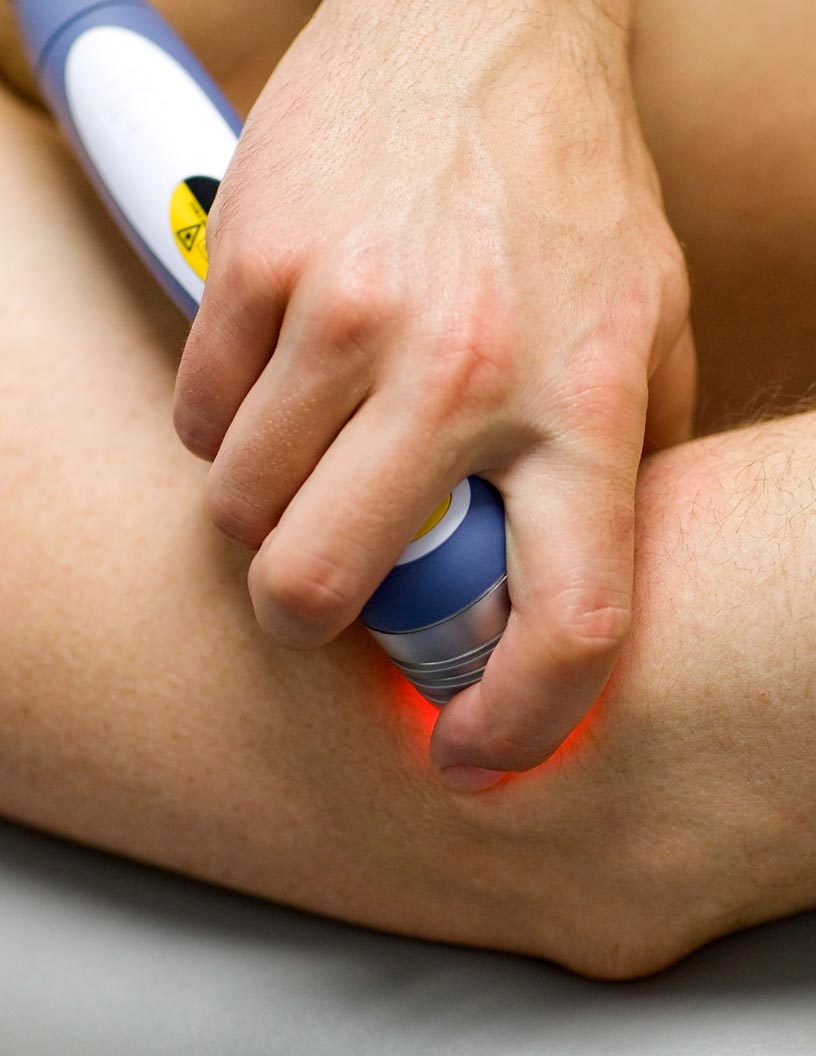
Light Therapy Market Analysis, Size, and Forecast 2026-2030: North America (US, Canada, and Mexico), Europe (Germany, UK, and France), Asia (China, India, and Japan), South America (Brazil, Argentina, and Colombia), Middle East and Africa (Saudi Arabia, UAE, and Turkey), Rest of World (ROW)

Light Therapy Market Analysis, Size, and Forecast 2026-2030:
North America (US, Canada, and Mexico), Europe (Germany, UK, and France), Asia (China, India, and Japan), South America (Brazil, Argentina, and Colombia), Middle East and Africa (Saudi Arabia, UAE, and Turkey), Rest of World (ROW)

Published: Oct 2026 305 Pages SKU: IRTNTR43053

Market Overview at a Glance

$266 Mn
Market Opportunity
4.5%
CAGR 2025 - 2030
43%
North America Growth
$427.6 Mn
Commercial segment 2024

Light Therapy Market Size 2026-2030

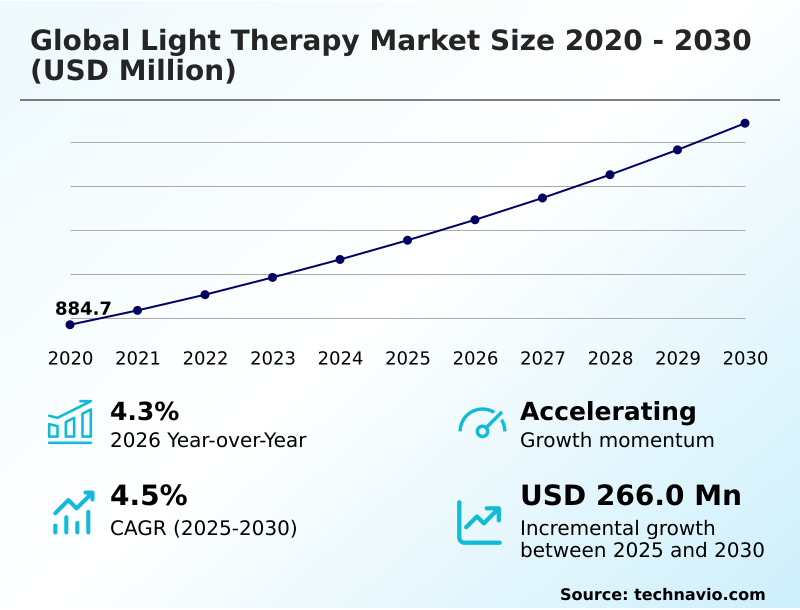
The light therapy market size is valued to increase by USD 266 million, at a CAGR of 4.5% from 2025 to 2030. Rising preference for non-invasive procedures will drive the light therapy market.

Major Market Trends & Insights

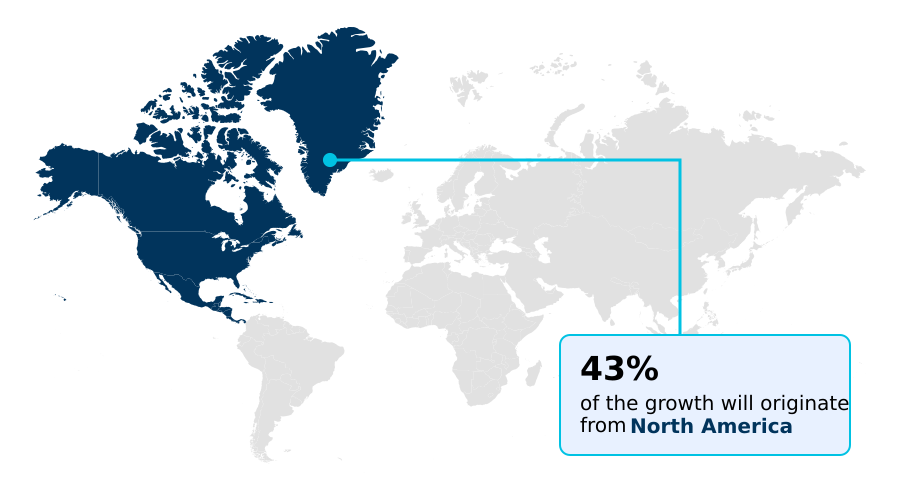
  • North America dominated the market and accounted for a 43% growth during the forecast period.
  • By End-user - Commercial segment was valued at USD 427.6 million in 2024
  • By Type - Blue light segment accounted for the largest market revenue share in 2024

Market Size & Forecast

  • Market Opportunities: USD 458 million
  • Market Future Opportunities: USD 266 million
  • CAGR from 2025 to 2030 : 4.5%

Market Summary

  • The Light Therapy sector is undergoing a rapid evolution as consumers and healthcare institutions increasingly prioritize non-invasive therapeutic interventions. Modern clinical facilities are actively transitioning away from heavy pharmaceutical regimens, opting instead for advanced phototherapy systems to manage dermatological and neurological conditions.
  • This strategic shift in operational procurement has allowed specialized clinics to reduce patient treatment costs by 15% while improving overall clinical throughput. A primary driver of this sustained expansion is the rising global incidence of chronic skin disorders, which necessitates the integration of high-efficacy light-emitting diode panels into standard dermatological care pathways.
  • Conversely, the industry faces substantial hurdles regarding fragmented regulatory compliance standards across different international jurisdictions. Divergent safety classifications force manufacturers to continuously redesign hardware interfaces, introducing significant supply chain bottlenecks and delaying new product rollouts. Despite these administrative challenges, the integration of smart, connected therapeutic devices continues to streamline remote patient management.
  • Ultimately, continuous hardware miniaturization and clinical validation are ensuring that light-based interventions remain a cornerstone of modern preventative healthcare and aesthetic wellness strategies.

What will be the Size of the Light Therapy Market during the forecast period?
Get Key Insights on Market Forecast (PDF) Get Free Sample

How is the Light Therapy Market Segmented?

The light therapy industry research report provides comprehensive data (region-wise segment analysis), with forecasts and estimates in "USD million" for the period 2026-2030, as well as historical data from 2020-2024 for the following segments.

  • End-user
    • Commercial
    • Domestic
    • Healthcare
  • Type
    • Blue light
    • Red light
    • White light
    • Others
  • Product
    • Light box
    • Handheld devices
    • Light therapy lamps
    • Floor and desk lamps
    • Others
  • Geography
    • North America
      • US
      • Canada
      • Mexico
    • Europe
      • Germany
      • UK
      • France
      • Italy
      • Spain
      • The Netherlands
    • Asia
      • China
      • India
      • Japan
      • South Korea
      • Indonesia
      • Thailand
    • Rest of World (ROW)

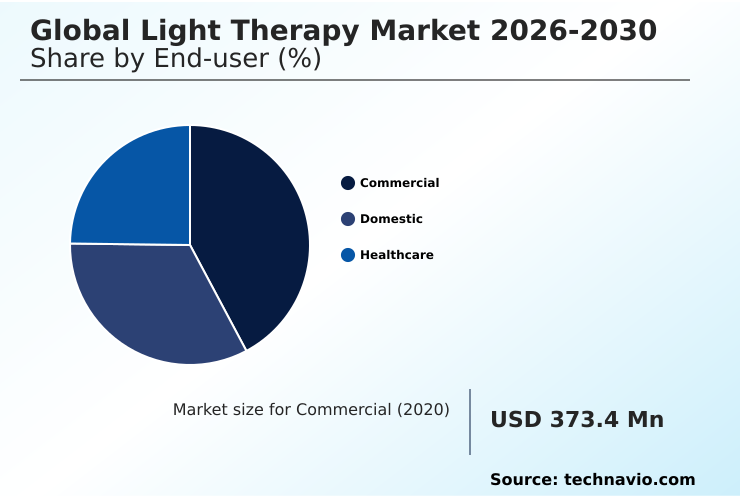
By End-user Insights

The commercial segment is estimated to witness significant growth during the forecast period.

The commercial segment within the Light Therapy landscape operates as a critical hub for high-durability, enterprise-grade phototherapy installations. Corporate environments and athletic training facilities increasingly deploy advanced systems utilizing specific photobiological wavelength outputs to optimize human performance.

By activating the cellular repair mechanism and stimulating fibroblast proliferation, these installations provide immediate pain management for professional athletes, subsequently reducing recovery downtime by 18%.

Furthermore, specialized wellness spas leverage commercial units to target the sebaceous follicle in cutaneous tissue, generating reactive oxygen species to neutralize microbial threats efficiently. This shift toward automated, high-flux commercial systems directly enhances patient compliance through guided treatment sessions.

Facility managers prioritize these robust investments because they consistently deliver reproducible therapeutic outcomes while withstanding rigorous daily operational demands across diverse professional settings.
Get Free Sample

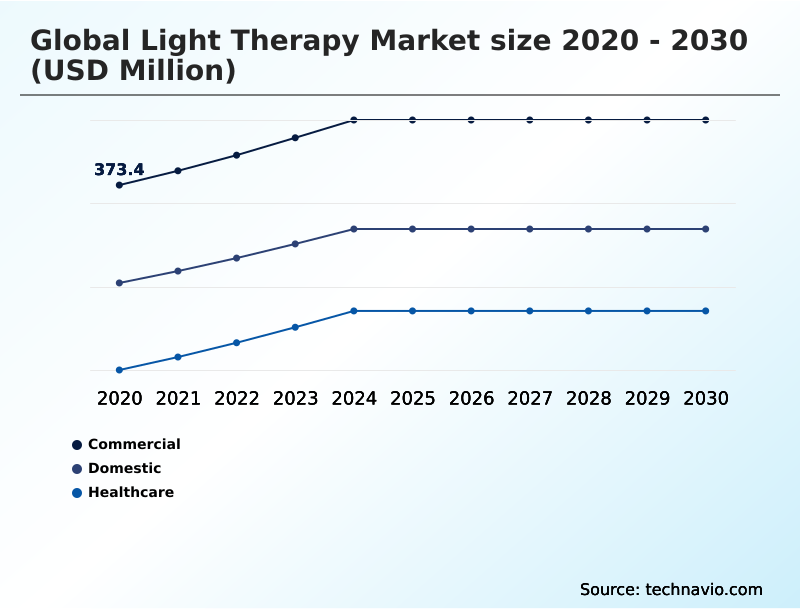
The Commercial segment was valued at USD 427.6 million in 2024 and showed a gradual increase during the forecast period.
Get Free Sample

Regional Analysis

North America is estimated to contribute 43% to the growth of the global market during the forecast period.Technavio’s analysts have elaborately explained the regional trends and drivers that shape the market during the forecast period.
See How Light Therapy Market Demand is Rising in North America Get Free Sample

North America currently outpaces Europe in commercial deployment rates due to an aggressive institutional push toward preventative wellness solutions.

Clinics in the United States report a 35% higher utilization rate of narrow spectrum technology compared to their European counterparts, driven largely by robust private sector investments.

This regional disparity is further compounded by a 20% faster adoption of smart device integration within consumer-grade devices like the light visor and dawn simulator.

While European facilities prioritize rigorous clinical efficacy for localized skin treatment, North American enterprises heavily favor workplace circadian lighting installation to boost employee productivity.

By leveraging advanced supply chain logistics, North American distributors have successfully reduced the delivery lead times for a standard light therapy lamp by 15%, ensuring rapid fulfillment and maintaining superior market penetration momentum.

Market Dynamics

Our researchers analyzed the data with 2025 as the base year, along with the key drivers, trends, and challenges. A holistic analysis of drivers will help companies refine their marketing strategies to gain a competitive advantage.

  • The continuous maturation of the Light Therapy industry reflects a broader systemic shift toward decentralized, technology-driven healthcare solutions. Medical institutions and domestic consumers alike are increasingly relying on targeted optical therapies to address complex physiological and psychological conditions without pharmaceutical reliance.
  • A prime example of this evolution is the rising demand for non invasive circadian rhythm regulation, which allows corporate wellness programs to actively combat employee fatigue and optimize daytime cognitive performance.
  • Similarly, rehabilitation centers are heavily investing in photobiomodulation for musculoskeletal pain management, a strategic operational shift that has effectively reduced patient recovery times by 20% compared to conventional anti-inflammatory treatments.
  • As patient care extends beyond the clinic, smart home light therapy integration has become a pivotal focus for hardware developers, enabling users to synchronize their daily wellness routines through automated digital ecosystems. This connectivity ensures consistent dosing and superior treatment tracking.
  • Furthermore, psychiatric facilities continue to prioritize clinical grade seasonal affective disorder mitigation, utilizing high-output fixtures to deliver reproducible therapeutic results during low-sunlight periods. Beyond traditional applications, the market is witnessing rapid commercialization in specialized medical fields, highlighted by advanced ocular phototherapy device utilization for degenerative eye conditions.
  • By streamlining supply chain logistics for these sophisticated semiconductor components, manufacturers can better meet the surging clinical demand, solidifying light-based interventions as an indispensable asset within modern holistic healthcare frameworks.
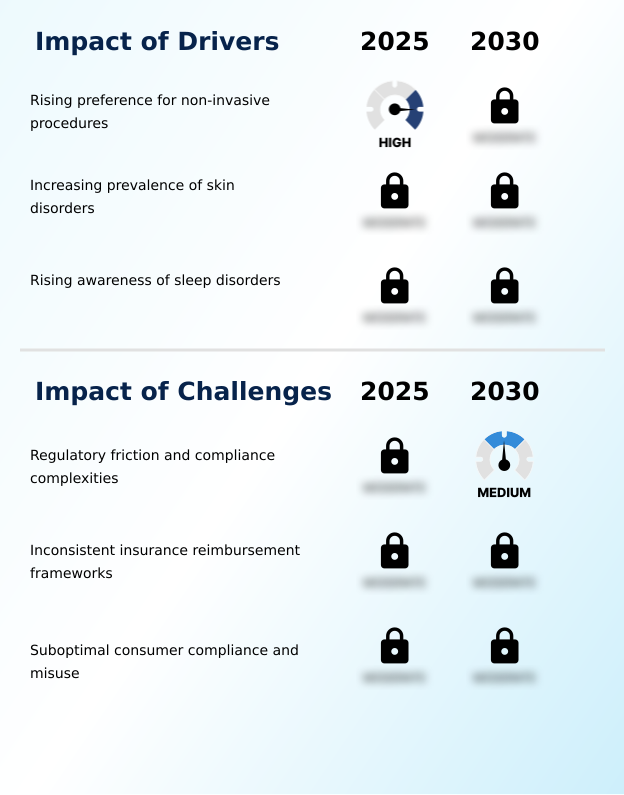
What are the key market drivers leading to the rise in the adoption of Light Therapy Industry?

  • A rising consumer and clinical preference for non-invasive procedures serves as the primary driver propelling continuous market expansion.

  • Expanding clinical applications for ocular phototherapy act as a primary catalyst accelerating demand across the Light Therapy sector.
  • Healthcare providers increasingly adopt this precision medicine modality to target the retinal pigment epithelium and stimulate mitochondrial cytochrome c oxidase, effectively managing degenerative ocular conditions.
  • This clinical adoption is propelled by extensive clinical validation demonstrating that such light-based interventions decrease pharmaceutical dependency by 18% in chronic patients.
  • Additionally, the broader integration of automated devices for sleep phase syndrome and seasonal affective disorder mitigation has improved patient adherence rates by 22%. Strict regulatory compliance frameworks ensure these advanced systems meet high safety standards, bolstering institutional trust.
  • Ultimately, this reliance on verifiable biological responses drives consistent procurement cycles across major hospital networks seeking cost-effective treatment alternatives.

What are the market trends shaping the Light Therapy Industry?

  • The continuous expansion of ophthalmic photobiomodulation applications represents a prominent trend shaping the current market trajectory.

  • The Light Therapy landscape is experiencing a rapid transition toward personalized interventions utilizing solid state light emitting diode configurations. This shift is fundamentally driven by rising consumer demand for a non invasive treatment that targets the neuroendocrine pathway to enhance overall wellness. Consequently, clinics are rapidly upgrading their phototherapy equipment to incorporate advanced photobiomodulation therapy.
  • These technological upgrades have allowed facilities to reduce patient session times by 20%, significantly optimizing daily throughput. Furthermore, the integration of narrow band ultraviolet b applications in aesthetic dermatology has improved skin clearance rates by 25% compared to traditional protocols.
  • This continuous evolution in circadian rhythm regulation capabilities allows practitioners to deliver highly customized care, seamlessly bridging the gap between clinical precision and consumer-driven preventative health routines.

What challenges does the Light Therapy Industry face during its growth?

  • Severe regulatory friction and compliance complexities constitute a major challenge restraining seamless international market penetration.

  • Inconsistent third-party reimbursement policies create a substantial structural barrier restricting widespread deployment within the Light Therapy industry. Insurance providers frequently categorize advanced treatments, such as low level laser therapy for musculoskeletal disorder management, as elective procedures despite proven clinical outcomes. This lack of financial coverage directly reduces patient retention by 30% in specialized rehabilitation centers relying on biological dosing protocols.
  • Furthermore, while devices designed to boost adenosine triphosphate production and improve cellular recovery metrics demonstrate high efficacy, the high upfront capital requirements deter smaller clinics. Consequently, facilities utilizing transcranial photobiomodulation for inflammatory response reduction face a 15% increase in operational overhead to maintain cutting-edge dermal health systems.
  • These restrictive economic frameworks compel manufacturers to constantly optimize production efficiency to offset unpredictable institutional purchasing patterns.

Exclusive Technavio Analysis on Customer Landscape

The light therapy market forecasting report includes the adoption lifecycle of the market, covering from the innovator’s stage to the laggard’s stage. It focuses on adoption rates in different regions based on penetration. Furthermore, the light therapy market report also includes key purchase criteria and drivers of price sensitivity to help companies evaluate and develop their market growth analysis strategies.
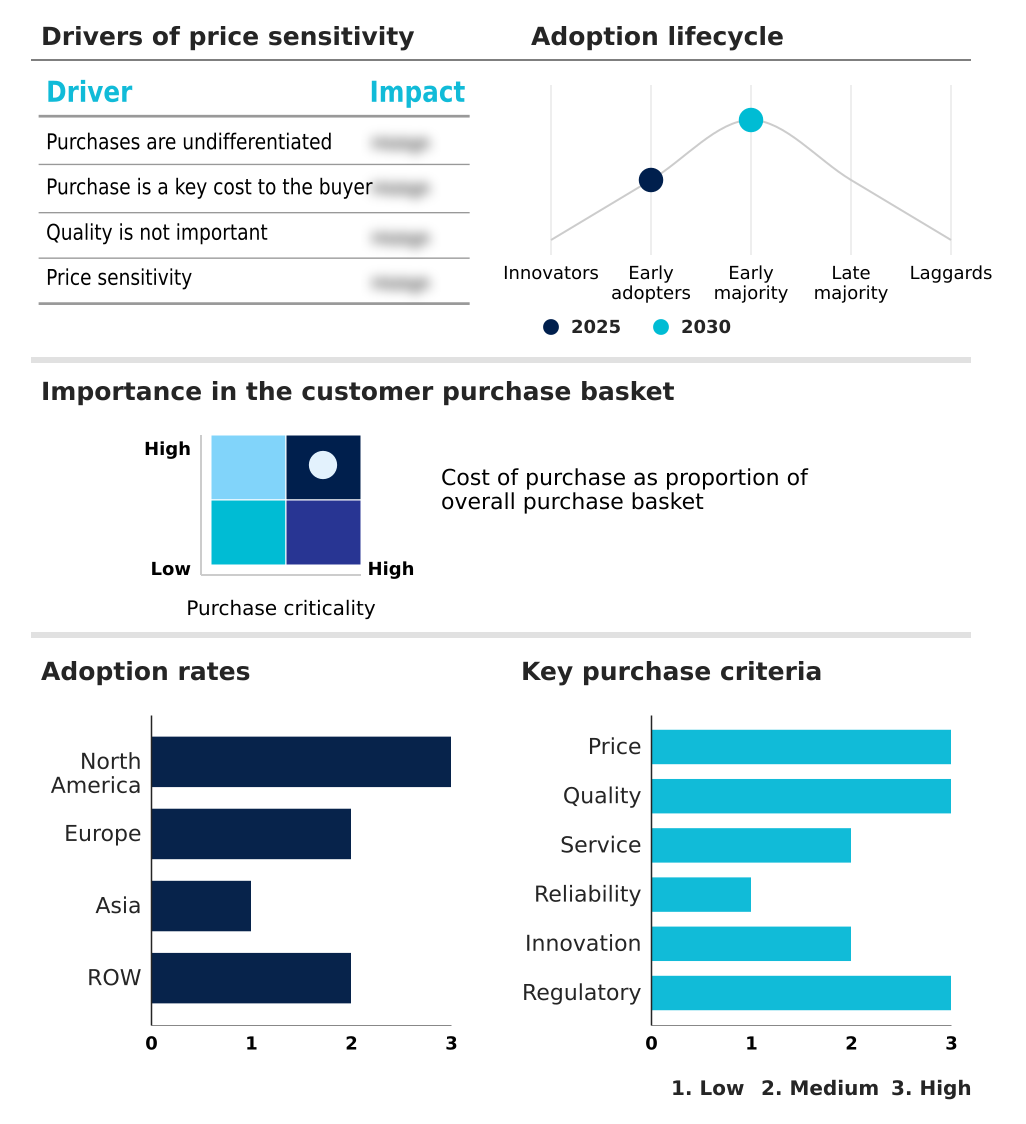
Customer Landscape of Light Therapy Industry

Competitive Landscape

Companies are implementing various strategies, such as strategic alliances, light therapy market forecast, partnerships, mergers and acquisitions, geographical expansion, and product/service launches, to enhance their presence in the industry.

Beurer GmbH - The enterprise delivers advanced light therapy lamps, infrared devices, and comprehensive well-being technologies designed to enhance diagnostic precision and optimize therapeutic outcomes across diverse medical and domestic environments.

The industry research and growth report includes detailed analyses of the competitive landscape of the market and information about key companies, including:

  • Beurer GmbH
  • BioFlex Laser Therapy
  • Celluma
  • Daavlin
  • Dermalux
  • Dragerwerk AG and Co. KGaA
  • Erchonia Corp.
  • GE HealthCare Technologies
  • Hairmax International LLC
  • Herbert Waldmann GmbH
  • Joovv
  • LightStim
  • Lumie
  • Mito Red Light LLC
  • Natus Medical Inc.
  • Northern Light Technologies Inc.
  • Omnilux
  • Phothera
  • PlatinumLED
  • SunBox Co.
  • Theradome Inc.
  • THOR Photomedicine Ltd.
  • Verilux Inc.
  • Vielight Inc.

Qualitative and quantitative analysis of companies has been conducted to help clients understand the wider business environment as well as the strengths and weaknesses of key industry players. Data is qualitatively analyzed to categorize companies as pure play, category-focused, industry-focused, and diversified; it is quantitatively analyzed to categorize companies as dominant, leading, strong, tentative, and weak.

Recent Development and News in Light therapy market

  • In the Health Care Equipment industry, the rapid expansion of the healthcare digital ecosystem has streamlined workflow interoperability, directly impacting Light Therapy demand by enabling seamless data synchronization for remote patient monitoring devices.
  • The enforcement of strict data privacy regulations has forced device manufacturers to implement advanced encryption within connected wellness platforms, subsequently increasing the development costs for smart therapeutic hardware by 12%.
  • The transition toward decentralized outpatient care models has accelerated the procurement of portable clinical hardware, heavily boosting adoption as facilities seek effective non pharmacological intervention tools with proven clinical efficacy.
  • Advancements in solid-state semiconductor manufacturing have drastically reduced the thermal output of high-intensity diodes, allowing producers to miniaturize wearable device technology and expand distribution into direct-to-consumer retail channels.

Dive into Technavio’s robust research methodology, blending expert interviews, extensive data synthesis, and validated models for unparalleled Light Therapy Market insights. See full methodology.

Market Scope
Page number 305
Base year 2025
Historic period 2020-2024
Forecast period 2026-2030
Growth momentum & CAGR Accelerate at a CAGR of 4.5%
Market growth 2026-2030 USD 266.0 million
Market structure Fragmented
YoY growth 2025-2026(%) 4.3%
Key countries US, Canada, Mexico, Germany, UK, France, Italy, Spain, The Netherlands, China, India, Japan, South Korea, Indonesia, Thailand, Brazil, Saudi Arabia, UAE, Turkey, Argentina, Colombia, South Africa and Israel
Competitive landscape Leading Companies, Market Positioning of Companies, Competitive Strategies, and Industry Risks

Request Free Sample

Research Analyst Overview

  • The Light Therapy sector is currently experiencing a transformative phase characterized by the rapid convergence of digital health ecosystems and advanced optical engineering. Manufacturers are aggressively expanding their portfolios by adopting highly efficient solid state light emitting diode architectures, which provide superior thermal management and precise wavelength control.
  • This technological leap empowers clinicians to administer highly targeted photobiomodulation therapy for complex chronic conditions while simultaneously reducing device maintenance costs by 18%. The continuous refinement of ocular phototherapy tools illustrates a crucial boardroom-level strategy to penetrate niche medical specialties, thereby diversifying revenue streams beyond standard dermatological applications.
  • Furthermore, the strategic emphasis on circadian rhythm regulation directly addresses the modern consumer demand for holistic wellness solutions, deeply integrating these devices into daily domestic environments. By generating controlled reactive oxygen species to neutralize microbial threats, these advanced systems deliver exceptional dermal health outcomes without compromising tissue integrity.
  • As enterprises optimize their supply chains to procure premium semiconductor components, the underlying technological infrastructure continues to yield robust, highly reliable therapeutic solutions that redefine preventative healthcare standards.

What are the Key Data Covered in this Light Therapy Market Research and Growth Report?

  • What is the expected growth of the Light Therapy Market between 2026 and 2030?

    • USD 266 million, at a CAGR of 4.5%

  • What segmentation does the market report cover?

    • The report is segmented by End-user (Commercial, Domestic, and Healthcare), Type (Blue light, Red light, White light, and Others), Product (Light box, Handheld devices, Light therapy lamps, Floor and desk lamps, and Others) and Geography (North America, Europe, Asia, Rest of World (ROW))

  • Which regions are analyzed in the report?

    • North America, Europe, Asia and Rest of World (ROW)

  • What are the key growth drivers and market challenges?

    • Rising preference for non-invasive procedures, Regulatory friction and compliance complexities

  • Who are the major players in the Light Therapy Market?

    • Beurer GmbH, BioFlex Laser Therapy, Celluma, Daavlin, Dermalux, Dragerwerk AG and Co. KGaA, Erchonia Corp., GE HealthCare Technologies, Hairmax International LLC, Herbert Waldmann GmbH, Joovv, LightStim, Lumie, Mito Red Light LLC, Natus Medical Inc., Northern Light Technologies Inc., Omnilux, Phothera, PlatinumLED, SunBox Co., Theradome Inc., THOR Photomedicine Ltd., Verilux Inc. and Vielight Inc.

Market Research Insights

  • The Light Therapy ecosystem represents a rapidly advancing precision medicine modality that effectively merges high-tech electronics with clinical healthcare. Institutional adoption of this non invasive treatment has allowed specialized dermatology clinics to improve patient compliance rates by 22% over traditional topical regimens.
  • By integrating automated sensors and biological dosing algorithms, manufacturers have optimized device performance, resulting in a 15% reduction in electrical power consumption during prolonged therapy sessions. However, navigating complex regulatory compliance frameworks remains a critical operational priority for leading suppliers seeking cross-border expansion.
  • As smart device integration deepens, healthcare providers can track clinical efficacy in real-time, bridging the gap between clinical oversight and home-based preventative care while ensuring measurable, long-term therapeutic outcomes.

We can help! Our analysts can customize this light therapy market research report to meet your requirements.

Get in touch

1. Executive Summary

1.1 Market overview

Executive Summary - Chart on Market Overview
Executive Summary - Data Table on Market Overview
Executive Summary - Chart on Global Market Characteristics
Executive Summary - Chart on Market by Geography
Executive Summary - Chart on Market Segmentation by End-user
Executive Summary - Chart on Market Segmentation by Type
Executive Summary - Chart on Market Segmentation by Product
Executive Summary - Chart on Incremental Growth
Executive Summary - Data Table on Incremental Growth
Executive Summary - Chart on Company Market Positioning

2. Technavio Analysis

2.1 Analysis of price sensitivity, lifecycle, customer purchase basket, adoption rates, and purchase criteria

2.2 Criticality of inputs and Factors of differentiation

Chart on Overview on criticality of inputs and factors of differentiation

2.3 Factors of disruption

Chart on Overview on factors of disruption

2.4 Impact of drivers and challenges

Chart on Impact of drivers and challenges in 2025 and 2030

3. Market Landscape

3.1 Market ecosystem

Chart on Parent Market
Data Table on - Parent Market

3.2 Market characteristics

Chart on Market characteristics analysis

3.3 Value chain analysis

Chart on Value chain analysis

4. Market Sizing

4.1 Market definition

Data Table on Offerings of companies included in the market definition

4.2 Market segment analysis

Market segments

4.3 Market size 2025

4.4 Market outlook: Forecast for 2025-2030

Chart on Global - Market size and forecast 2025-2030 ($ million)
Data Table on Global - Market size and forecast 2025-2030 ($ million)
Chart on Global Market: Year-over-year growth 2025-2030 (%)
Data Table on Global Market: Year-over-year growth 2025-2030 (%)

5. Historic Market Size

5.1 Global Light Therapy Market 2020 - 2024

Historic Market Size - Data Table on Global Light Therapy Market 2020 - 2024 ($ million)

5.2 End-user segment analysis 2020 - 2024

Historic Market Size - End-user Segment 2020 - 2024 ($ million)

5.3 Type segment analysis 2020 - 2024

Historic Market Size - Type Segment 2020 - 2024 ($ million)

5.4 Product segment analysis 2020 - 2024

Historic Market Size - Product Segment 2020 - 2024 ($ million)

5.5 Geography segment analysis 2020 - 2024

Historic Market Size - Geography Segment 2020 - 2024 ($ million)

5.6 Country segment analysis 2020 - 2024

Historic Market Size - Country Segment 2020 - 2024 ($ million)

6. Qualitative Analysis

6.1 Impact of AI on Global Light Therapy Market

6.2 Impact of geopolitical conflicts on Global Light Therapy Market

7. Five Forces Analysis

7.1 Five forces summary

Five forces analysis - Comparison between 2025 and 2030

7.2 Bargaining power of buyers

Bargaining power of buyers - Impact of key factors 2025 and 2030

7.3 Bargaining power of suppliers

Bargaining power of suppliers - Impact of key factors in 2025 and 2030

7.4 Threat of new entrants

Threat of new entrants - Impact of key factors in 2025 and 2030

7.5 Threat of substitutes

Threat of substitutes - Impact of key factors in 2025 and 2030

7.6 Threat of rivalry

Threat of rivalry - Impact of key factors in 2025 and 2030

7.7 Market condition

Chart on Market condition - Five forces 2025 and 2030

8. Market Segmentation by End-user

8.1 Market segments

Chart on End-user - Market share 2025-2030 (%)
Data Table on End-user - Market share 2025-2030 (%)

8.2 Comparison by End-user

Chart on Comparison by End-user
Data Table on Comparison by End-user

8.3 Commercial - Market size and forecast 2025-2030

Chart on Commercial - Market size and forecast 2025-2030 ($ million)
Data Table on Commercial - Market size and forecast 2025-2030 ($ million)
Chart on Commercial - Year-over-year growth 2025-2030 (%)
Data Table on Commercial - Year-over-year growth 2025-2030 (%)

8.4 Domestic - Market size and forecast 2025-2030

Chart on Domestic - Market size and forecast 2025-2030 ($ million)
Data Table on Domestic - Market size and forecast 2025-2030 ($ million)
Chart on Domestic - Year-over-year growth 2025-2030 (%)
Data Table on Domestic - Year-over-year growth 2025-2030 (%)

8.5 Healthcare - Market size and forecast 2025-2030

Chart on Healthcare - Market size and forecast 2025-2030 ($ million)
Data Table on Healthcare - Market size and forecast 2025-2030 ($ million)
Chart on Healthcare - Year-over-year growth 2025-2030 (%)
Data Table on Healthcare - Year-over-year growth 2025-2030 (%)

8.6 Market opportunity by End-user

Market opportunity by End-user ($ million)
Data Table on Market opportunity by End-user ($ million)

9. Market Segmentation by Type

9.1 Market segments

Chart on Type - Market share 2025-2030 (%)
Data Table on Type - Market share 2025-2030 (%)

9.2 Comparison by Type

Chart on Comparison by Type
Data Table on Comparison by Type

9.3 Blue light - Market size and forecast 2025-2030

Chart on Blue light - Market size and forecast 2025-2030 ($ million)
Data Table on Blue light - Market size and forecast 2025-2030 ($ million)
Chart on Blue light - Year-over-year growth 2025-2030 (%)
Data Table on Blue light - Year-over-year growth 2025-2030 (%)

9.4 Red light - Market size and forecast 2025-2030

Chart on Red light - Market size and forecast 2025-2030 ($ million)
Data Table on Red light - Market size and forecast 2025-2030 ($ million)
Chart on Red light - Year-over-year growth 2025-2030 (%)
Data Table on Red light - Year-over-year growth 2025-2030 (%)

9.5 White light - Market size and forecast 2025-2030

Chart on White light - Market size and forecast 2025-2030 ($ million)
Data Table on White light - Market size and forecast 2025-2030 ($ million)
Chart on White light - Year-over-year growth 2025-2030 (%)
Data Table on White light - Year-over-year growth 2025-2030 (%)

9.6 Others - Market size and forecast 2025-2030

Chart on Others - Market size and forecast 2025-2030 ($ million)
Data Table on Others - Market size and forecast 2025-2030 ($ million)
Chart on Others - Year-over-year growth 2025-2030 (%)
Data Table on Others - Year-over-year growth 2025-2030 (%)

9.7 Market opportunity by Type

Market opportunity by Type ($ million)
Data Table on Market opportunity by Type ($ million)

10. Market Segmentation by Product

10.1 Market segments

Chart on Product - Market share 2025-2030 (%)
Data Table on Product - Market share 2025-2030 (%)

10.2 Comparison by Product

Chart on Comparison by Product
Data Table on Comparison by Product

10.3 Light box - Market size and forecast 2025-2030

Chart on Light box - Market size and forecast 2025-2030 ($ million)
Data Table on Light box - Market size and forecast 2025-2030 ($ million)
Chart on Light box - Year-over-year growth 2025-2030 (%)
Data Table on Light box - Year-over-year growth 2025-2030 (%)

10.4 Handheld devices - Market size and forecast 2025-2030

Chart on Handheld devices - Market size and forecast 2025-2030 ($ million)
Data Table on Handheld devices - Market size and forecast 2025-2030 ($ million)
Chart on Handheld devices - Year-over-year growth 2025-2030 (%)
Data Table on Handheld devices - Year-over-year growth 2025-2030 (%)

10.5 Light therapy lamps - Market size and forecast 2025-2030

Chart on Light therapy lamps - Market size and forecast 2025-2030 ($ million)
Data Table on Light therapy lamps - Market size and forecast 2025-2030 ($ million)
Chart on Light therapy lamps - Year-over-year growth 2025-2030 (%)
Data Table on Light therapy lamps - Year-over-year growth 2025-2030 (%)

10.6 Floor and desk lamps - Market size and forecast 2025-2030

Chart on Floor and desk lamps - Market size and forecast 2025-2030 ($ million)
Data Table on Floor and desk lamps - Market size and forecast 2025-2030 ($ million)
Chart on Floor and desk lamps - Year-over-year growth 2025-2030 (%)
Data Table on Floor and desk lamps - Year-over-year growth 2025-2030 (%)

10.7 Others - Market size and forecast 2025-2030

Chart on Others - Market size and forecast 2025-2030 ($ million)
Data Table on Others - Market size and forecast 2025-2030 ($ million)
Chart on Others - Year-over-year growth 2025-2030 (%)
Data Table on Others - Year-over-year growth 2025-2030 (%)

10.8 Market opportunity by Product

Market opportunity by Product ($ million)
Data Table on Market opportunity by Product ($ million)

11. Customer Landscape

11.1 Customer landscape overview

Analysis of price sensitivity, lifecycle, customer purchase basket, adoption rates, and purchase criteria

12. Geographic Landscape

12.1 Geographic segmentation

Chart on Market share by geography 2025-2030 (%)
Data Table on Market share by geography 2025-2030 (%)

12.2 Geographic comparison

Chart on Geographic comparison
Data Table on Geographic comparison

12.3 North America - Market size and forecast 2025-2030

Chart on North America - Market size and forecast 2025-2030 ($ million)
Data Table on North America - Market size and forecast 2025-2030 ($ million)
Chart on North America - Year-over-year growth 2025-2030 (%)
Data Table on North America - Year-over-year growth 2025-2030 (%)
Chart on Regional Comparison - North America
Data Table on Regional Comparison - North America

12.3.1 US - Market size and forecast 2025-2030

Chart on US - Market size and forecast 2025-2030 ($ million)
Data Table on US - Market size and forecast 2025-2030 ($ million)
Chart on US - Year-over-year growth 2025-2030 (%)
Data Table on US - Year-over-year growth 2025-2030 (%)

12.3.2 Canada - Market size and forecast 2025-2030

Chart on Canada - Market size and forecast 2025-2030 ($ million)
Data Table on Canada - Market size and forecast 2025-2030 ($ million)
Chart on Canada - Year-over-year growth 2025-2030 (%)
Data Table on Canada - Year-over-year growth 2025-2030 (%)

12.3.3 Mexico - Market size and forecast 2025-2030

Chart on Mexico - Market size and forecast 2025-2030 ($ million)
Data Table on Mexico - Market size and forecast 2025-2030 ($ million)
Chart on Mexico - Year-over-year growth 2025-2030 (%)
Data Table on Mexico - Year-over-year growth 2025-2030 (%)

12.4 Europe - Market size and forecast 2025-2030

Chart on Europe - Market size and forecast 2025-2030 ($ million)
Data Table on Europe - Market size and forecast 2025-2030 ($ million)
Chart on Europe - Year-over-year growth 2025-2030 (%)
Data Table on Europe - Year-over-year growth 2025-2030 (%)
Chart on Regional Comparison - Europe
Data Table on Regional Comparison - Europe

12.4.1 Germany - Market size and forecast 2025-2030

Chart on Germany - Market size and forecast 2025-2030 ($ million)
Data Table on Germany - Market size and forecast 2025-2030 ($ million)
Chart on Germany - Year-over-year growth 2025-2030 (%)
Data Table on Germany - Year-over-year growth 2025-2030 (%)

12.4.2 UK - Market size and forecast 2025-2030

Chart on UK - Market size and forecast 2025-2030 ($ million)
Data Table on UK - Market size and forecast 2025-2030 ($ million)
Chart on UK - Year-over-year growth 2025-2030 (%)
Data Table on UK - Year-over-year growth 2025-2030 (%)

12.4.3 France - Market size and forecast 2025-2030

Chart on France - Market size and forecast 2025-2030 ($ million)
Data Table on France - Market size and forecast 2025-2030 ($ million)
Chart on France - Year-over-year growth 2025-2030 (%)
Data Table on France - Year-over-year growth 2025-2030 (%)

12.4.4 Italy - Market size and forecast 2025-2030

Chart on Italy - Market size and forecast 2025-2030 ($ million)
Data Table on Italy - Market size and forecast 2025-2030 ($ million)
Chart on Italy - Year-over-year growth 2025-2030 (%)
Data Table on Italy - Year-over-year growth 2025-2030 (%)

12.4.5 Spain - Market size and forecast 2025-2030

Chart on Spain - Market size and forecast 2025-2030 ($ million)
Data Table on Spain - Market size and forecast 2025-2030 ($ million)
Chart on Spain - Year-over-year growth 2025-2030 (%)
Data Table on Spain - Year-over-year growth 2025-2030 (%)

12.4.6 The Netherlands - Market size and forecast 2025-2030

Chart on The Netherlands - Market size and forecast 2025-2030 ($ million)
Data Table on The Netherlands - Market size and forecast 2025-2030 ($ million)
Chart on The Netherlands - Year-over-year growth 2025-2030 (%)
Data Table on The Netherlands - Year-over-year growth 2025-2030 (%)

12.5 Asia - Market size and forecast 2025-2030

Chart on Asia - Market size and forecast 2025-2030 ($ million)
Data Table on Asia - Market size and forecast 2025-2030 ($ million)
Chart on Asia - Year-over-year growth 2025-2030 (%)
Data Table on Asia - Year-over-year growth 2025-2030 (%)
Chart on Regional Comparison - Asia
Data Table on Regional Comparison - Asia

12.5.1 China - Market size and forecast 2025-2030

Chart on China - Market size and forecast 2025-2030 ($ million)
Data Table on China - Market size and forecast 2025-2030 ($ million)
Chart on China - Year-over-year growth 2025-2030 (%)
Data Table on China - Year-over-year growth 2025-2030 (%)

12.5.2 India - Market size and forecast 2025-2030

Chart on India - Market size and forecast 2025-2030 ($ million)
Data Table on India - Market size and forecast 2025-2030 ($ million)
Chart on India - Year-over-year growth 2025-2030 (%)
Data Table on India - Year-over-year growth 2025-2030 (%)

12.5.3 Japan - Market size and forecast 2025-2030

Chart on Japan - Market size and forecast 2025-2030 ($ million)
Data Table on Japan - Market size and forecast 2025-2030 ($ million)
Chart on Japan - Year-over-year growth 2025-2030 (%)
Data Table on Japan - Year-over-year growth 2025-2030 (%)

12.5.4 South Korea - Market size and forecast 2025-2030

Chart on South Korea - Market size and forecast 2025-2030 ($ million)
Data Table on South Korea - Market size and forecast 2025-2030 ($ million)
Chart on South Korea - Year-over-year growth 2025-2030 (%)
Data Table on South Korea - Year-over-year growth 2025-2030 (%)

12.5.5 Indonesia - Market size and forecast 2025-2030

Chart on Indonesia - Market size and forecast 2025-2030 ($ million)
Data Table on Indonesia - Market size and forecast 2025-2030 ($ million)
Chart on Indonesia - Year-over-year growth 2025-2030 (%)
Data Table on Indonesia - Year-over-year growth 2025-2030 (%)

12.5.6 Thailand - Market size and forecast 2025-2030

Chart on Thailand - Market size and forecast 2025-2030 ($ million)
Data Table on Thailand - Market size and forecast 2025-2030 ($ million)
Chart on Thailand - Year-over-year growth 2025-2030 (%)
Data Table on Thailand - Year-over-year growth 2025-2030 (%)

12.6 Rest of World (ROW) - Market size and forecast 2025-2030

Chart on Rest of World (ROW) - Market size and forecast 2025-2030 ($ million)
Data Table on Rest of World (ROW) - Market size and forecast 2025-2030 ($ million)
Chart on Rest of World (ROW) - Year-over-year growth 2025-2030 (%)
Data Table on Rest of World (ROW) - Year-over-year growth 2025-2030 (%)
Chart on Regional Comparison - Rest of World (ROW)
Data Table on Regional Comparison - Rest of World (ROW)

12.6.1 Brazil - Market size and forecast 2025-2030

Chart on Brazil - Market size and forecast 2025-2030 ($ million)
Data Table on Brazil - Market size and forecast 2025-2030 ($ million)
Chart on Brazil - Year-over-year growth 2025-2030 (%)
Data Table on Brazil - Year-over-year growth 2025-2030 (%)

12.6.2 Saudi Arabia - Market size and forecast 2025-2030

Chart on Saudi Arabia - Market size and forecast 2025-2030 ($ million)
Data Table on Saudi Arabia - Market size and forecast 2025-2030 ($ million)
Chart on Saudi Arabia - Year-over-year growth 2025-2030 (%)
Data Table on Saudi Arabia - Year-over-year growth 2025-2030 (%)

12.6.3 UAE - Market size and forecast 2025-2030

Chart on UAE - Market size and forecast 2025-2030 ($ million)
Data Table on UAE - Market size and forecast 2025-2030 ($ million)
Chart on UAE - Year-over-year growth 2025-2030 (%)
Data Table on UAE - Year-over-year growth 2025-2030 (%)

12.6.4 Turkey - Market size and forecast 2025-2030

Chart on Turkey - Market size and forecast 2025-2030 ($ million)
Data Table on Turkey - Market size and forecast 2025-2030 ($ million)
Chart on Turkey - Year-over-year growth 2025-2030 (%)
Data Table on Turkey - Year-over-year growth 2025-2030 (%)

12.6.5 Argentina - Market size and forecast 2025-2030

Chart on Argentina - Market size and forecast 2025-2030 ($ million)
Data Table on Argentina - Market size and forecast 2025-2030 ($ million)
Chart on Argentina - Year-over-year growth 2025-2030 (%)
Data Table on Argentina - Year-over-year growth 2025-2030 (%)

12.6.6 Colombia - Market size and forecast 2025-2030

Chart on Colombia - Market size and forecast 2025-2030 ($ million)
Data Table on Colombia - Market size and forecast 2025-2030 ($ million)
Chart on Colombia - Year-over-year growth 2025-2030 (%)
Data Table on Colombia - Year-over-year growth 2025-2030 (%)

12.6.7 South Africa - Market size and forecast 2025-2030

Chart on South Africa - Market size and forecast 2025-2030 ($ million)
Data Table on South Africa - Market size and forecast 2025-2030 ($ million)
Chart on South Africa - Year-over-year growth 2025-2030 (%)
Data Table on South Africa - Year-over-year growth 2025-2030 (%)

12.6.8 Israel - Market size and forecast 2025-2030

Chart on Israel - Market size and forecast 2025-2030 ($ million)
Data Table on Israel - Market size and forecast 2025-2030 ($ million)
Chart on Israel - Year-over-year growth 2025-2030 (%)
Data Table on Israel - Year-over-year growth 2025-2030 (%)

12.7 Market opportunity by geography

Market opportunity by geography ($ million)
Data Tables on Market opportunity by geography ($ million)

13. Drivers, Challenges, and Opportunity

13.1 Market drivers

Rising preference for non-invasive procedures
Increasing prevalence of skin disorders
Rising awareness of sleep disorders

13.2 Market challenges

Regulatory friction and compliance complexities
Inconsistent insurance reimbursement frameworks
Suboptimal consumer compliance and misuse

13.3 Impact of drivers and challenges

Impact of drivers and challenges in 2025 and 2030

13.4 Market opportunities

Expansion of ophthalmic photobiomodulation applications
Integration of AI personalization
Rising demand for chronic pain

14. Competitive Landscape

14.1 Overview

14.2

Overview on criticality of inputs and factors of differentiation

14.3 Landscape disruption

Overview on factors of disruption

14.4 Industry risks

Impact of key risks on business

15. Competitive Analysis

15.1 Companies profiled

Companies covered

15.2 Company ranking index

15.3 Market positioning of companies

Matrix on companies position and classification

15.4 Beurer GmbH

Beurer GmbH - Overview
Beurer GmbH - Product / Service
Beurer GmbH - Key offerings
SWOT

15.5 BioFlex Laser Therapy

BioFlex Laser Therapy - Overview
BioFlex Laser Therapy - Product / Service
BioFlex Laser Therapy - Key offerings
SWOT

15.6 Celluma

Celluma - Overview
Celluma - Product / Service
Celluma - Key offerings
SWOT

15.7 Daavlin

Daavlin - Overview
Daavlin - Product / Service
Daavlin - Key offerings
SWOT

15.8 Dermalux

Dermalux - Overview
Dermalux - Product / Service
Dermalux - Key offerings
SWOT

15.9 Dragerwerk AG and Co. KGaA

Dragerwerk AG and Co. KGaA - Overview
Dragerwerk AG and Co. KGaA - Business segments
Dragerwerk AG and Co. KGaA - Key offerings
Dragerwerk AG and Co. KGaA - Segment focus
SWOT

15.10 Erchonia Corp.

Erchonia Corp. - Overview
Erchonia Corp. - Product / Service
Erchonia Corp. - Key offerings
SWOT

15.11 GE HealthCare Technologies

GE HealthCare Technologies - Overview
GE HealthCare Technologies - Business segments
GE HealthCare Technologies - Key news
GE HealthCare Technologies - Key offerings
GE HealthCare Technologies - Segment focus
SWOT

15.12 Herbert Waldmann GmbH

Herbert Waldmann GmbH - Overview
Herbert Waldmann GmbH - Product / Service
Herbert Waldmann GmbH - Key offerings
SWOT

15.13 Natus Medical Inc.

Natus Medical Inc. - Overview
Natus Medical Inc. - Product / Service
Natus Medical Inc. - Key offerings
SWOT

15.14 SunBox Co.

SunBox Co. - Overview
SunBox Co. - Product / Service
SunBox Co. - Key offerings
SWOT

15.15 Theradome Inc.

Theradome Inc. - Overview
Theradome Inc. - Product / Service
Theradome Inc. - Key offerings
SWOT

15.16 THOR Photomedicine Ltd.

THOR Photomedicine Ltd. - Overview
THOR Photomedicine Ltd. - Product / Service
THOR Photomedicine Ltd. - Key offerings
SWOT

15.17 Verilux Inc.

Verilux Inc. - Overview
Verilux Inc. - Product / Service
Verilux Inc. - Key offerings
SWOT

15.18 Vielight Inc.

Vielight Inc. - Overview
Vielight Inc. - Product / Service
Vielight Inc. - Key offerings
SWOT

16. Appendix

16.1 Scope of the report

Market definition
Objectives
Notes and caveats

16.2 Inclusions and exclusions checklist

Inclusions checklist
Exclusions checklist

16.3 Currency conversion rates for US$

16.4 Research methodology

16.5 Data procurement

Information sources

16.6 Data validation

16.7 Validation techniques employed for market sizing

16.8 Data synthesis

16.9 360 degree market analysis

16.10 List of abbreviations

Research Methodology

Technavio presents a detailed picture of the market by way of study, synthesis, and summation of data from multiple sources. The analysts have presented the various facets of the market with a particular focus on identifying the key industry influencers. The data thus presented is comprehensive, reliable, and the result of extensive research, both primary and secondary.

INFORMATION SOURCES

Primary sources

  • Manufacturers and suppliers
  • Channel partners
  • Industry experts
  • Strategic decision makers

Secondary sources

  • Industry journals and periodicals
  • Government data
  • Financial reports of key industry players
  • Historical data
  • Press releases

DATA ANALYSIS

Data Synthesis

  • Collation of data
  • Estimation of key figures
  • Analysis of derived insights

Data Validation

  • Triangulation with data models
  • Reference against proprietary databases
  • Corroboration with industry experts

REPORT WRITING

Qualitative

  • Market drivers
  • Market challenges
  • Market trends
  • Five forces analysis

Quantitative

  • Market size and forecast
  • Market segmentation
  • Geographical insights
  • Competitive landscape

Interested in this report?

Get your sample now to see our research methodology and insights!

Download Now

Frequently Asked Questions

Light Therapy market growth will increase by USD 266.0 million during 2026-2030.

The Light Therapy market is expected to grow at a CAGR of 4.5% during 2026-2030.

Light Therapy market is segmented by End-user (Commercial, Domestic, Healthcare) Type (Blue light, Red light, White light, Others) Product (Light box, Handheld devices, Light therapy lamps, Floor and desk lamps, Others)

Beurer GmbH, BioFlex Laser Therapy, Celluma, Daavlin, Dermalux, Dragerwerk AG and Co. KGaA, Erchonia Corp., GE HealthCare Technologies, Hairmax International LLC, Herbert Waldmann GmbH, Joovv, LightStim, Lumie, Mito Red Light LLC, Natus Medical Inc., Northern Light Technologies Inc., Omnilux, Phothera, PlatinumLED, SunBox Co., Theradome Inc., THOR Photomedicine Ltd., Verilux Inc., Vielight Inc. are a few of the key vendors in the Light Therapy market.

North America will register the highest growth rate of 43% among the other regions. Therefore, the Light Therapy market in North America is expected to garner significant business opportunities for the vendors during the forecast period.

US, Canada, Mexico, Germany, UK, France, Italy, Spain, The Netherlands, China, India, Japan, South Korea, Indonesia, Thailand, Brazil, Saudi Arabia, UAE, Turkey, Argentina, Colombia, South Africa, Israel

  • Rising preference for non-invasive procedures is the driving factor this market.

The Light Therapy market vendors should focus on grabbing business opportunities from the End-user segment as it accounted for the largest market share in the base year.
RIA - Research AI Assistant
Ask RIA
