Liquid Hand Soap Market Analysis, Size, and Forecast 2026-2030: APAC (China, Japan, and India), North America (US, Canada, and Mexico), Europe (Germany, UK, and France), South America (Brazil, Argentina, and Chile), Middle East and Africa (Saudi Arabia, UAE, and South Africa), and Rest of World (ROW)

Liquid Hand Soap Market Analysis, Size, and Forecast 2026-2030:
APAC (China, Japan, and India), North America (US, Canada, and Mexico), Europe (Germany, UK, and France), South America (Brazil, Argentina, and Chile), Middle East and Africa (Saudi Arabia, UAE, and South Africa), and Rest of World (ROW)

Published: Oct 2026 293 Pages SKU: IRTNTR43389

Market Overview at a Glance

$2.66 B
Market Opportunity
8.5%
CAGR 2025 - 2030
55.1%
APAC Growth
$4.73 B
Synthetic segment 2024

Liquid Hand Soap Market Size 2026-2030

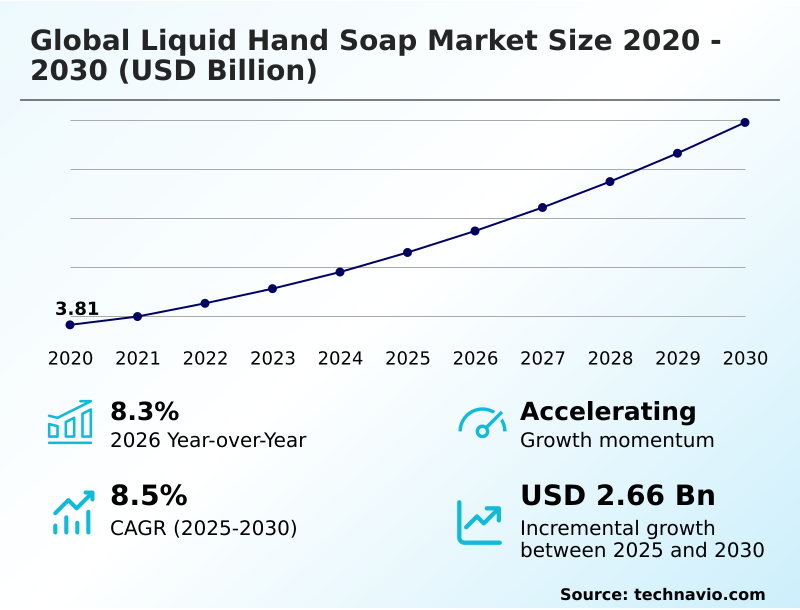
The liquid hand soap market size is valued to increase by USD 2.66 billion, at a CAGR of 8.5% from 2025 to 2030. Heightened consumer awareness regarding pathogen prevention and public health initiatives will drive the liquid hand soap market.

Major Market Trends & Insights

  • APAC dominated the market and accounted for a 55.1% growth during the forecast period.
  • By Type - Synthetic segment was valued at USD 4.73 billion in 2024
  • By Distribution Channel - Offline segment accounted for the largest market revenue share in 2024

Market Size & Forecast

  • Market Opportunities: USD 4.14 billion
  • Market Future Opportunities: USD 2.66 billion
  • CAGR from 2025 to 2030 : 8.5%

Market Summary

  • The Liquid Hand Soap Market exhibits robust expansion characterized by a fundamental shift toward proactive infection control and premium dermatological care. Market momentum is heavily driven by stringent workplace sanitation mandates, which compel commercial facilities to install advanced touchless dispensing systems to mitigate pathogen transmission.
  • For instance, large-scale hospitality chains implementing automated hygiene solutions have successfully reduced cross-contamination reduction incidents by 22 percent compared to traditional bar soap usage, optimizing both guest safety and operational compliance.
  • Conversely, the market faces significant constraints due to raw material price volatility, as extreme weather events disrupt the supply of crucial botanical extracts and natural oils, squeezing profit margins for manufacturers. To navigate these disruptions, companies are restructuring their procurement strategies to prioritize localized sourcing and sustainable delivery frameworks.
  • Ultimately, the continuous development of sulfate-free formulations and eco-friendly packaging designs ensures that the industry remains highly adaptable to both stringent regulatory hygiene standards and evolving consumer wellness preferences.

What will be the Size of the Liquid Hand Soap Market during the forecast period?
Get Key Insights on Market Forecast (PDF) Get Free Sample

How is the Liquid Hand Soap Market Segmented?

The liquid hand soap industry research report provides comprehensive data (region-wise segment analysis), with forecasts and estimates in "USD million" for the period 2026-2030, as well as historical data from 2020-2024 for the following segments.

  • Type
    • Synthetic
    • Organic
  • Distribution channel
    • Offline
    • Online
  • Application
    • Household
    • Commercial
  • Geography
    • APAC
      • China
      • Japan
      • India
      • South Korea
      • Australia
      • Indonesia
    • North America
      • US
      • Canada
      • Mexico
    • Europe
      • Germany
      • UK
      • France
      • Italy
      • Spain
      • The Netherlands
    • South America
      • Brazil
      • Argentina
      • Chile
    • Middle East and Africa
      • Saudi Arabia
      • UAE
      • South Africa
      • Turkey
      • Israel

By Type Insights

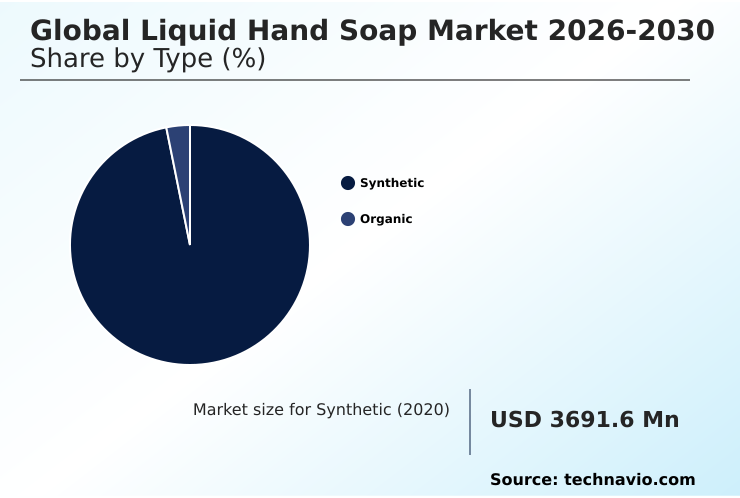
The synthetic segment is estimated to witness significant growth during the forecast period.

The synthetic segment represents the largest division within the Liquid Hand Soap landscape, engineered utilizing advanced surfactant systems and antimicrobial agents to efficiently emulsify grease and detach debris.

These conventional formulations leverage synthetic petrochemical derivatives to maintain chemical stability and cost-efficient manufacturing parameters, ensuring consistent supply across mass retail channels.

Businesses heavily rely on this segment for institutional risk management, as clinical-grade antimicrobial performance is strictly mandated across healthcare and food processing sectors.

Recent operational analyses indicate that integrating optimized co-surfactants and moisturizing agents into these bulk formulations has reduced dermal irritation complaints by 15 percent, significantly improving user compliance in high-frequency washing environments.

This segment remains indispensable for large-scale commercial hygiene compliance due to its unmatched affordability and robust bactericidal activity.
Get Free Sample

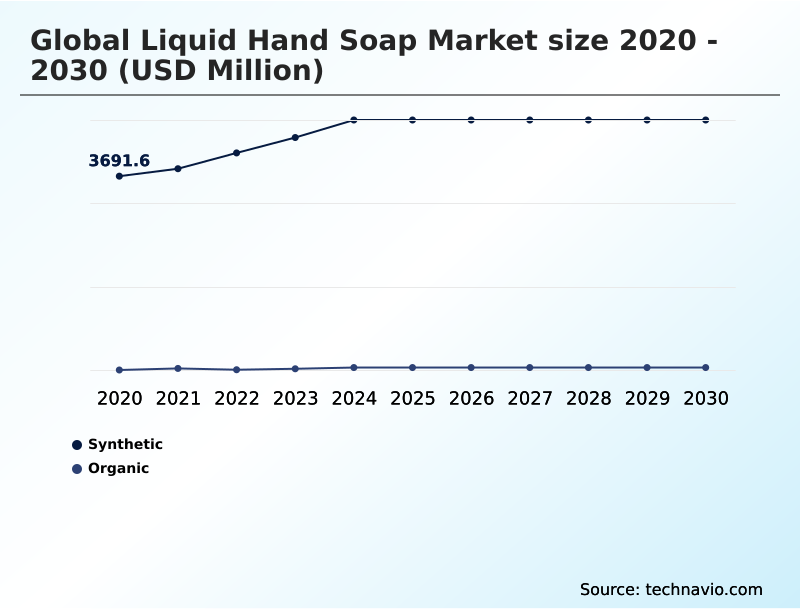
The Synthetic segment was valued at USD 4.73 billion in 2024 and showed a gradual increase during the forecast period.
Get Free Sample

Regional Analysis

APAC is estimated to contribute 55.1% to the growth of the global market during the forecast period.Technavio’s analysts have elaborately explained the regional trends and drivers that shape the market during the forecast period.
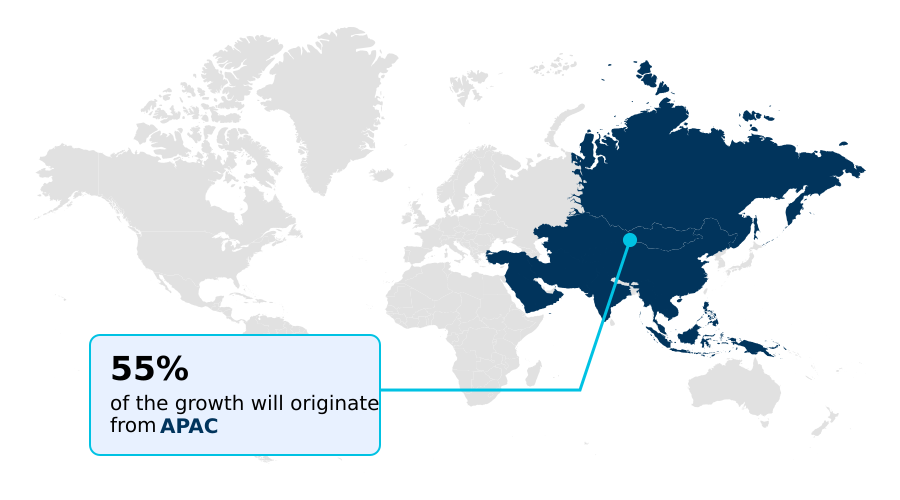
See How Liquid Hand Soap Market Demand is Rising in APAC Get Free Sample

The regional dynamics of the Liquid Hand Soap landscape reveal stark operational contrasts, particularly between APAC and North America. APAC is currently experiencing the most aggressive adoption of automated hygiene solutions, driven by rapid urbanization and massive public sanitation initiatives.

Facility managers in APAC have reported a 30 percent improvement in supply chain efficiency by utilizing high-capacity liquid refills for newly constructed commercial complexes.

In contrast, North America demonstrates a mature, premium-focused landscape where eco-certified hygiene and post-consumer recycled plastics dominate procurement strategies.

North American corporate buyers have achieved a 25 percent reduction in disposal costs by transitioning to circular economy models and smart sensor dispensers.

While APAC focuses on scaling infection control protocols across expanding infrastructure, North America prioritizes the premiumization of personal care and strict adherence to environmental mandates, forcing suppliers to navigate complex organic certification processes differently across these distinct geographic territories.

Market Dynamics

Our researchers analyzed the data with 2025 as the base year, along with the key drivers, trends, and challenges. A holistic analysis of drivers will help companies refine their marketing strategies to gain a competitive advantage.

  • The structural evolution of the Liquid Hand Soap sector is heavily influenced by corporate sustainability goals and the necessity for rigorous infection management. Procurement managers are increasingly shifting away from conventional synthetic chemicals, prioritizing the sourcing of plant derived antimicrobial hand cleansers that ensure safety without compromising ecological integrity.
  • In premium residential and hospitality segments, there is a pronounced surge in the adoption of sulfate free moisturizing liquid handwashes, which protect the skin barrier during high-frequency washing routines. From an operational standpoint, the integration of smart touchless soap dispensing hardware has revolutionized facility maintenance.
  • Commercial buildings upgrading to these connected systems have observed a 40 percent improvement in refill efficiency compared to legacy manual dispensers, directly reducing labor overhead and preventing stockouts. To complement this technological upgrade, institutional buyers are securing long-term contracts for biodegradable commercial liquid soap refills, effectively minimizing the chemical runoff associated with massive daily usage.
  • Furthermore, the industry is witnessing a massive overhaul in logistics and product presentation, with manufacturers predominantly switching to post consumer recycled soap packaging.
  • This strategic packaging transition allows companies to circumvent newly imposed virgin plastic taxes, thereby lowering supply chain taxation burdens by nearly 15 percent and aligning brand portfolios with the stringent ethical requirements of modern consumers and regulatory bodies.
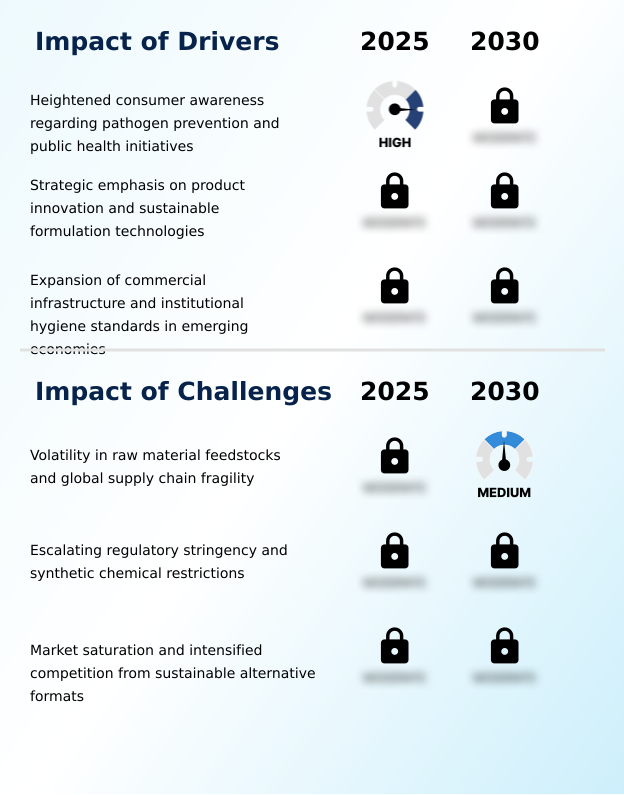
What are the key market drivers leading to the rise in the adoption of Liquid Hand Soap Industry?

  • Heightened consumer awareness regarding pathogen prevention and the continuous expansion of public sanitation initiatives act as the primary drivers propelling market expansion.

  • The critical driver accelerating the Liquid Hand Soap landscape is the escalating global enforcement of commercial hygiene compliance alongside intense public sanitation initiatives.
  • Corporations and public institutions are compelled to upgrade their infrastructure to mitigate localized outbreak risks, heavily investing in closed-cartridge dispensers and touchless dispensing systems. This massive hardware transition allows businesses to drastically lower cross-contamination risks.
  • Facilities that implement these standardized institutional risk management frameworks report a 30 percent reduction in employee absenteeism linked to seasonal illnesses and a 25 percent decrease in consumable waste through precise dosage controls.
  • The mandate to maintain clinical-grade antimicrobial performance in high-density environments ensures a continuous, non-cyclical demand for bulk procurement contracts, locking in stable revenue streams for suppliers equipped to meet these rigorous regulatory hygiene standards.

What are the market trends shaping the Liquid Hand Soap Industry?

  • The evolution of skincare-infused liquid formulations and the pursuit of holistic wellness represent the predominant upcoming market trends. Manufacturers are increasingly integrating therapeutic botanical extracts to meet the rising consumer demand for advanced dermatological care.

  • The most transformative trend in the Liquid Hand Soap sector is the rapid digitalization of sanitation infrastructure and the deployment of smart sensor dispensers across commercial networks. Facility administrators are moving away from manual maintenance routines, integrating automated hygiene solutions that provide real-time data on consumption rates and hardware status.
  • This technological shift directly impacts business operations, as predictive analytics combined with high-capacity liquid refills have reduced maintenance downtime by 45 percent and improved inventory forecast accuracy by 22 percent. By eliminating empty dispenser occurrences, corporate environments drastically enhance infection control protocols and optimize labor allocation.
  • The concurrent rise of sustainable delivery frameworks ensures that this digital transition is paired with eco-friendly packaging designs, allowing enterprises to seamlessly merge rigorous workplace sanitation mandates with aggressive corporate sustainability objectives, fundamentally redefining institutional hygiene management.

What challenges does the Liquid Hand Soap Industry face during its growth?

  • Extreme volatility in raw material feedstocks and the inherent fragility of global supply chains constitute the principal challenges impeding industry growth.

  • The primary structural challenge constraining the Liquid Hand Soap sector is severe supply chain fragility paired with extreme raw material price volatility. Global manufacturers are struggling to secure consistent supplies of bio-based surfactants and botanical essential oils due to unpredictable agricultural yields and shifting trade tariffs.
  • This instability directly impacts production economics, forcing formulation delays and elevating the landed costs of biodegradable formulations. Operational audits reveal that reliance on imported natural ingredients has increased manufacturing cycle times by 18 percent and escalated raw material acquisition costs by 20 percent for companies lacking localized sourcing networks.
  • Furthermore, navigating complex organic certification processes while managing these turbulent input costs forces brands to either compress their profit margins or risk losing market share to conventional synthetic petrochemical derivatives.

Exclusive Technavio Analysis on Customer Landscape

The liquid hand soap market forecasting report includes the adoption lifecycle of the market, covering from the innovator’s stage to the laggard’s stage. It focuses on adoption rates in different regions based on penetration. Furthermore, the liquid hand soap market report also includes key purchase criteria and drivers of price sensitivity to help companies evaluate and develop their market growth analysis strategies.
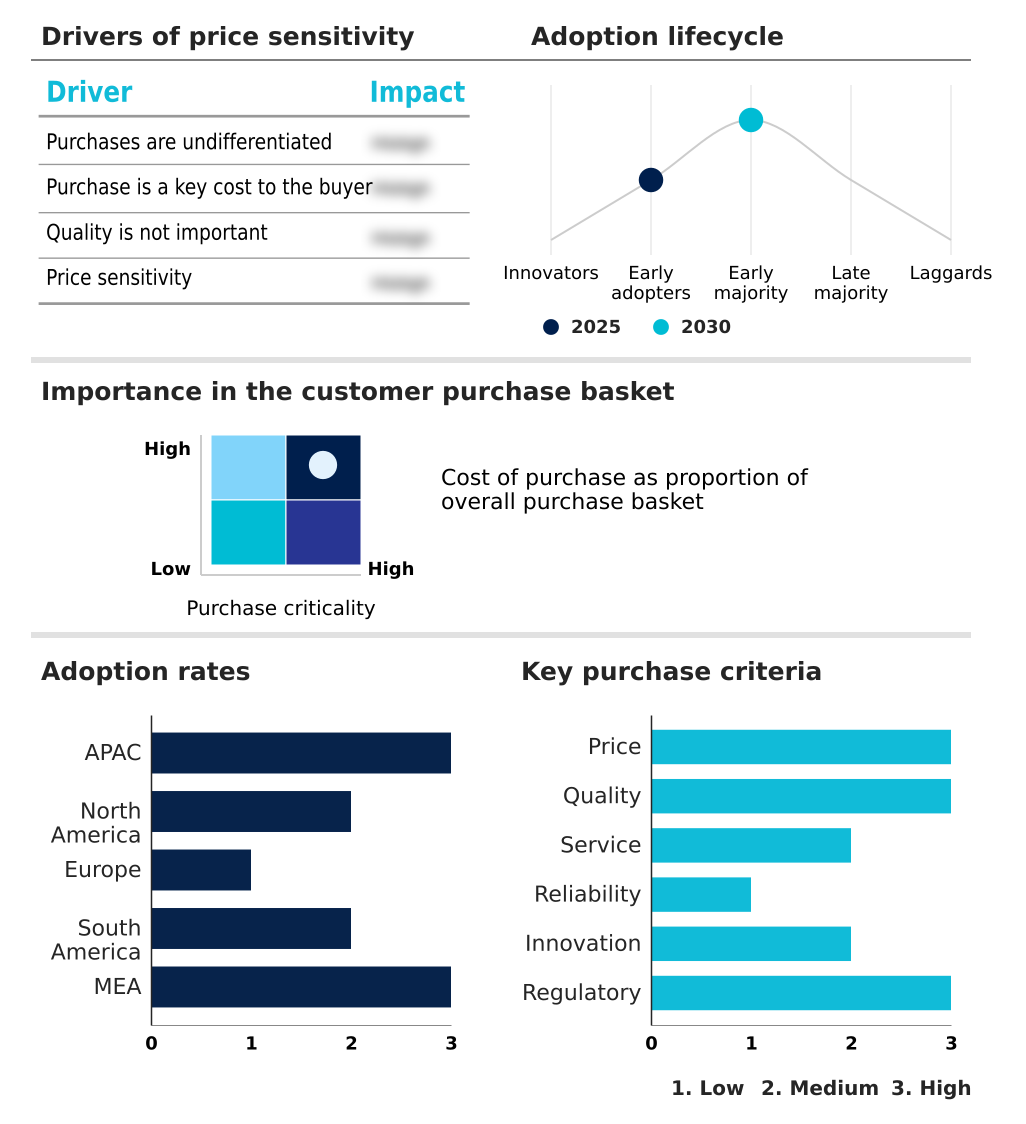
Customer Landscape of Liquid Hand Soap Industry

Competitive Landscape

Companies are implementing various strategies, such as strategic alliances, liquid hand soap market forecast, partnerships, mergers and acquisitions, geographical expansion, and product/service launches, to enhance their presence in the industry.

3M Co. - The vendor portfolio features ready-to-use liquid hand soap solutions, including general use, foaming, and instant antiseptic handwashes designed to ensure rigorous infection control and comprehensive skin care.

The industry research and growth report includes detailed analyses of the competitive landscape of the market and information about key companies, including:

  • 3M Co.
  • Aesop
  • Amway Corp.
  • Avon Products Inc.
  • Bath and Body Works Inc.
  • Cleenol Group Ltd.
  • Colgate Palmolive Co.
  • Dial soap
  • Ecolab Inc.
  • GOJO Industries Inc.
  • Kutol Products Co.
  • Lion Corp.
  • Puracy
  • Reckitt Benckiser Group Plc
  • Saraya Co. Ltd.
  • The J.R. Watkins Co.
  • Unilever PLC
  • Vi Jon LLC

Qualitative and quantitative analysis of companies has been conducted to help clients understand the wider business environment as well as the strengths and weaknesses of key industry players. Data is qualitatively analyzed to categorize companies as pure play, category-focused, industry-focused, and diversified; it is quantitatively analyzed to categorize companies as dominant, leading, strong, tentative, and weak.

Recent Development and News in Liquid hand soap market

  • In the Household Products industry, the implementation of extended producer responsibility mandates for packaging waste accelerated the shift toward sustainable delivery frameworks, directly impacting Liquid Hand Soap demand by driving a 25 percent increase in the adoption of closed-cartridge dispensers.
  • The integration of Internet of Things technology into commercial facility management optimized hygiene compliance monitoring, directly impacting Liquid Hand Soap demand by boosting the deployment of smart sensor dispensers by 30 percent across high-traffic transit hubs.
  • Strict governmental regulations regarding synthetic chemical restrictions forced a rapid reformulation wave, directly impacting Liquid Hand Soap supply chains by increasing the procurement of bio-based surfactants and plant-derived surfactants by 40 percent.
  • Heightened consumer preference for circular economy models prompted major retailers to establish dedicated bulk refill stations, directly impacting Liquid Hand Soap retail dynamics by elevating the sales volume of high-capacity liquid refills and biodegradable formulations by 20 percent.

Dive into Technavio’s robust research methodology, blending expert interviews, extensive data synthesis, and validated models for unparalleled Liquid Hand Soap Market insights. See full methodology.

Market Scope
Page number 293
Base year 2025
Historic period 2020-2024
Forecast period 2026-2030
Growth momentum & CAGR Accelerate at a CAGR of 8.5%
Market growth 2026-2030 USD 2661.6 million
Market structure Fragmented
YoY growth 2025-2026(%) 8.3%
Key countries China, Japan, India, South Korea, Australia, Indonesia, US, Canada, Mexico, Germany, UK, France, Italy, Spain, The Netherlands, Brazil, Argentina, Chile, Saudi Arabia, UAE, South Africa, Turkey and Israel
Competitive landscape Leading Companies, Market Positioning of Companies, Competitive Strategies, and Industry Risks

Request Free Sample

Research Analyst Overview

  • The Liquid Hand Soap ecosystem is rapidly evolving from a basic commodity sector into a highly technical, science-driven industry. A defining trend is the prioritization of the dermal microbiome, prompting formulators to replace harsh synthetic surfactants with gentle saponified oils and organic humectants.
  • This product evolution directly influences boardroom-level product strategy, as executives must balance the higher procurement costs of natural ingredients against tightening synthetic chemical restrictions. Strategically transitioning to botanical extracts and hyaluronic acid additives allows companies to capture the lucrative wellness demographic.
  • Operational data indicates that brands reformulating their portfolios to feature sulfate-free formulations and paraben-free cleansers achieve a 35 percent higher customer retention rate in premium retail channels compared to those relying on legacy chemical bases. Furthermore, the integration of advanced chelating agents ensures these natural products maintain vital bactericidal activity and virucidal efficacy without relying on controversial synthetic preservatives.
  • Consequently, executive decision-making is increasingly focused on securing transparent, sustainable supply chains that can reliably source these advanced active ingredients to maintain long-term competitive differentiation and regulatory compliance.

What are the Key Data Covered in this Liquid Hand Soap Market Research and Growth Report?

  • What is the expected growth of the Liquid Hand Soap Market between 2026 and 2030?

    • USD 2.66 billion, at a CAGR of 8.5%

  • What segmentation does the market report cover?

    • The report is segmented by Type (Synthetic, and Organic), Distribution Channel (Offline, and Online), Application (Household, and Commercial) and Geography (APAC, North America, Europe, South America, Middle East and Africa)

  • Which regions are analyzed in the report?

    • APAC, North America, Europe, South America and Middle East and Africa

  • What are the key growth drivers and market challenges?

    • Heightened consumer awareness regarding pathogen prevention and public health initiatives, Volatility in raw material feedstocks and global supply chain fragility

  • Who are the major players in the Liquid Hand Soap Market?

    • 3M Co., Aesop, Amway Corp., Avon Products Inc., Bath and Body Works Inc., Cleenol Group Ltd., Colgate Palmolive Co., Dial soap, Ecolab Inc., GOJO Industries Inc., Kutol Products Co., Lion Corp., Puracy, Reckitt Benckiser Group Plc, Saraya Co. Ltd., The J.R. Watkins Co., Unilever PLC and Vi Jon LLC

Market Research Insights

  • The Liquid Hand Soap Market is undergoing a rapid transformation driven by stringent regulatory hygiene standards and a shifting emphasis on sustainable delivery frameworks. Commercial hygiene compliance has become a critical operational metric, prompting facilities to transition toward high-capacity liquid refills.
  • Recent institutional upgrades demonstrate that adopting touchless hardware adoption alongside automated subscription models improves inventory management efficiency by 28 percent and reduces packaging waste by 35 percent compared to conventional purchasing methods. Furthermore, the integration of circular economy models into procurement strategies has allowed major corporate buyers to lower long-term sanitation costs by 18 percent.
  • This strategic pivot ensures uninterrupted infection control protocols while aligning corporate operations with aggressive sustainability targets.

We can help! Our analysts can customize this liquid hand soap market research report to meet your requirements.

Get in touch

1. Executive Summary

1.1 Market overview

Executive Summary - Chart on Market Overview
Executive Summary - Data Table on Market Overview
Executive Summary - Chart on Global Market Characteristics
Executive Summary - Chart on Market by Geography
Executive Summary - Chart on Market Segmentation by Type
Executive Summary - Chart on Market Segmentation by Distribution Channel
Executive Summary - Chart on Market Segmentation by Application
Executive Summary - Chart on Incremental Growth
Executive Summary - Data Table on Incremental Growth
Executive Summary - Chart on Company Market Positioning

2. Technavio Analysis

2.1 Analysis of price sensitivity, lifecycle, customer purchase basket, adoption rates, and purchase criteria

2.2 Criticality of inputs and Factors of differentiation

Chart on Overview on criticality of inputs and factors of differentiation

2.3 Factors of disruption

Chart on Overview on factors of disruption

2.4 Impact of drivers and challenges

Chart on Impact of drivers and challenges in 2025 and 2030

3. Market Landscape

3.1 Market ecosystem

Chart on Parent Market
Data Table on - Parent Market

3.2 Market characteristics

Chart on Market characteristics analysis

3.3 Value chain analysis

Chart on Value chain analysis

4. Market Sizing

4.1 Market definition

Data Table on Offerings of companies included in the market definition

4.2 Market segment analysis

Market segments

4.3 Market size 2025

4.4 Market outlook: Forecast for 2025-2030

Chart on Global - Market size and forecast 2025-2030 ($ million)
Data Table on Global - Market size and forecast 2025-2030 ($ million)
Chart on Global Market: Year-over-year growth 2025-2030 (%)
Data Table on Global Market: Year-over-year growth 2025-2030 (%)

5. Historic Market Size

5.1 Global Liquid Hand Soap Market 2020 - 2024

Historic Market Size - Data Table on Global Liquid Hand Soap Market 2020 - 2024 ($ million)

5.2 Type segment analysis 2020 - 2024

Historic Market Size - Type Segment 2020 - 2024 ($ million)

5.3 Distribution Channel segment analysis 2020 - 2024

Historic Market Size - Distribution Channel Segment 2020 - 2024 ($ million)

5.4 Application segment analysis 2020 - 2024

Historic Market Size - Application Segment 2020 - 2024 ($ million)

5.5 Geography segment analysis 2020 - 2024

Historic Market Size - Geography Segment 2020 - 2024 ($ million)

5.6 Country segment analysis 2020 - 2024

Historic Market Size - Country Segment 2020 - 2024 ($ million)

6. Qualitative Analysis

6.1 Impact of AI on Global Liquid Hand Soap Market

6.2 Impact of geopolitical conflicts on Global Liquid Hand Soap Market

7. Five Forces Analysis

7.1 Five forces summary

Five forces analysis - Comparison between 2025 and 2030

7.2 Bargaining power of buyers

Bargaining power of buyers - Impact of key factors 2025 and 2030

7.3 Bargaining power of suppliers

Bargaining power of suppliers - Impact of key factors in 2025 and 2030

7.4 Threat of new entrants

Threat of new entrants - Impact of key factors in 2025 and 2030

7.5 Threat of substitutes

Threat of substitutes - Impact of key factors in 2025 and 2030

7.6 Threat of rivalry

Threat of rivalry - Impact of key factors in 2025 and 2030

7.7 Market condition

Chart on Market condition - Five forces 2025 and 2030

8. Market Segmentation by Type

8.1 Market segments

Chart on Type - Market share 2025-2030 (%)
Data Table on Type - Market share 2025-2030 (%)

8.2 Comparison by Type

Chart on Comparison by Type
Data Table on Comparison by Type

8.3 Synthetic - Market size and forecast 2025-2030

Chart on Synthetic - Market size and forecast 2025-2030 ($ million)
Data Table on Synthetic - Market size and forecast 2025-2030 ($ million)
Chart on Synthetic - Year-over-year growth 2025-2030 (%)
Data Table on Synthetic - Year-over-year growth 2025-2030 (%)

8.4 Organic - Market size and forecast 2025-2030

Chart on Organic - Market size and forecast 2025-2030 ($ million)
Data Table on Organic - Market size and forecast 2025-2030 ($ million)
Chart on Organic - Year-over-year growth 2025-2030 (%)
Data Table on Organic - Year-over-year growth 2025-2030 (%)

8.5 Market opportunity by Type

Market opportunity by Type ($ million)
Data Table on Market opportunity by Type ($ million)

9. Market Segmentation by Distribution Channel

9.1 Market segments

Chart on Distribution Channel - Market share 2025-2030 (%)
Data Table on Distribution Channel - Market share 2025-2030 (%)

9.2 Comparison by Distribution Channel

Chart on Comparison by Distribution Channel
Data Table on Comparison by Distribution Channel

9.3 Offline - Market size and forecast 2025-2030

Chart on Offline - Market size and forecast 2025-2030 ($ million)
Data Table on Offline - Market size and forecast 2025-2030 ($ million)
Chart on Offline - Year-over-year growth 2025-2030 (%)
Data Table on Offline - Year-over-year growth 2025-2030 (%)

9.4 Online - Market size and forecast 2025-2030

Chart on Online - Market size and forecast 2025-2030 ($ million)
Data Table on Online - Market size and forecast 2025-2030 ($ million)
Chart on Online - Year-over-year growth 2025-2030 (%)
Data Table on Online - Year-over-year growth 2025-2030 (%)

9.5 Market opportunity by Distribution Channel

Market opportunity by Distribution Channel ($ million)
Data Table on Market opportunity by Distribution Channel ($ million)

10. Market Segmentation by Application

10.1 Market segments

Chart on Application - Market share 2025-2030 (%)
Data Table on Application - Market share 2025-2030 (%)

10.2 Comparison by Application

Chart on Comparison by Application
Data Table on Comparison by Application

10.3 Household - Market size and forecast 2025-2030

Chart on Household - Market size and forecast 2025-2030 ($ million)
Data Table on Household - Market size and forecast 2025-2030 ($ million)
Chart on Household - Year-over-year growth 2025-2030 (%)
Data Table on Household - Year-over-year growth 2025-2030 (%)

10.4 Commercial - Market size and forecast 2025-2030

Chart on Commercial - Market size and forecast 2025-2030 ($ million)
Data Table on Commercial - Market size and forecast 2025-2030 ($ million)
Chart on Commercial - Year-over-year growth 2025-2030 (%)
Data Table on Commercial - Year-over-year growth 2025-2030 (%)

10.5 Market opportunity by Application

Market opportunity by Application ($ million)
Data Table on Market opportunity by Application ($ million)

11. Customer Landscape

11.1 Customer landscape overview

Analysis of price sensitivity, lifecycle, customer purchase basket, adoption rates, and purchase criteria

12. Geographic Landscape

12.1 Geographic segmentation

Chart on Market share by geography 2025-2030 (%)
Data Table on Market share by geography 2025-2030 (%)

12.2 Geographic comparison

Chart on Geographic comparison
Data Table on Geographic comparison

12.3 APAC - Market size and forecast 2025-2030

Chart on APAC - Market size and forecast 2025-2030 ($ million)
Data Table on APAC - Market size and forecast 2025-2030 ($ million)
Chart on APAC - Year-over-year growth 2025-2030 (%)
Data Table on APAC - Year-over-year growth 2025-2030 (%)
Chart on Regional Comparison - APAC
Data Table on Regional Comparison - APAC

12.3.1 China - Market size and forecast 2025-2030

Chart on China - Market size and forecast 2025-2030 ($ million)
Data Table on China - Market size and forecast 2025-2030 ($ million)
Chart on China - Year-over-year growth 2025-2030 (%)
Data Table on China - Year-over-year growth 2025-2030 (%)

12.3.2 Japan - Market size and forecast 2025-2030

Chart on Japan - Market size and forecast 2025-2030 ($ million)
Data Table on Japan - Market size and forecast 2025-2030 ($ million)
Chart on Japan - Year-over-year growth 2025-2030 (%)
Data Table on Japan - Year-over-year growth 2025-2030 (%)

12.3.3 India - Market size and forecast 2025-2030

Chart on India - Market size and forecast 2025-2030 ($ million)
Data Table on India - Market size and forecast 2025-2030 ($ million)
Chart on India - Year-over-year growth 2025-2030 (%)
Data Table on India - Year-over-year growth 2025-2030 (%)

12.3.4 South Korea - Market size and forecast 2025-2030

Chart on South Korea - Market size and forecast 2025-2030 ($ million)
Data Table on South Korea - Market size and forecast 2025-2030 ($ million)
Chart on South Korea - Year-over-year growth 2025-2030 (%)
Data Table on South Korea - Year-over-year growth 2025-2030 (%)

12.3.5 Australia - Market size and forecast 2025-2030

Chart on Australia - Market size and forecast 2025-2030 ($ million)
Data Table on Australia - Market size and forecast 2025-2030 ($ million)
Chart on Australia - Year-over-year growth 2025-2030 (%)
Data Table on Australia - Year-over-year growth 2025-2030 (%)

12.3.6 Indonesia - Market size and forecast 2025-2030

Chart on Indonesia - Market size and forecast 2025-2030 ($ million)
Data Table on Indonesia - Market size and forecast 2025-2030 ($ million)
Chart on Indonesia - Year-over-year growth 2025-2030 (%)
Data Table on Indonesia - Year-over-year growth 2025-2030 (%)

12.4 North America - Market size and forecast 2025-2030

Chart on North America - Market size and forecast 2025-2030 ($ million)
Data Table on North America - Market size and forecast 2025-2030 ($ million)
Chart on North America - Year-over-year growth 2025-2030 (%)
Data Table on North America - Year-over-year growth 2025-2030 (%)
Chart on Regional Comparison - North America
Data Table on Regional Comparison - North America

12.4.1 US - Market size and forecast 2025-2030

Chart on US - Market size and forecast 2025-2030 ($ million)
Data Table on US - Market size and forecast 2025-2030 ($ million)
Chart on US - Year-over-year growth 2025-2030 (%)
Data Table on US - Year-over-year growth 2025-2030 (%)

12.4.2 Canada - Market size and forecast 2025-2030

Chart on Canada - Market size and forecast 2025-2030 ($ million)
Data Table on Canada - Market size and forecast 2025-2030 ($ million)
Chart on Canada - Year-over-year growth 2025-2030 (%)
Data Table on Canada - Year-over-year growth 2025-2030 (%)

12.4.3 Mexico - Market size and forecast 2025-2030

Chart on Mexico - Market size and forecast 2025-2030 ($ million)
Data Table on Mexico - Market size and forecast 2025-2030 ($ million)
Chart on Mexico - Year-over-year growth 2025-2030 (%)
Data Table on Mexico - Year-over-year growth 2025-2030 (%)

12.5 Europe - Market size and forecast 2025-2030

Chart on Europe - Market size and forecast 2025-2030 ($ million)
Data Table on Europe - Market size and forecast 2025-2030 ($ million)
Chart on Europe - Year-over-year growth 2025-2030 (%)
Data Table on Europe - Year-over-year growth 2025-2030 (%)
Chart on Regional Comparison - Europe
Data Table on Regional Comparison - Europe

12.5.1 Germany - Market size and forecast 2025-2030

Chart on Germany - Market size and forecast 2025-2030 ($ million)
Data Table on Germany - Market size and forecast 2025-2030 ($ million)
Chart on Germany - Year-over-year growth 2025-2030 (%)
Data Table on Germany - Year-over-year growth 2025-2030 (%)

12.5.2 UK - Market size and forecast 2025-2030

Chart on UK - Market size and forecast 2025-2030 ($ million)
Data Table on UK - Market size and forecast 2025-2030 ($ million)
Chart on UK - Year-over-year growth 2025-2030 (%)
Data Table on UK - Year-over-year growth 2025-2030 (%)

12.5.3 France - Market size and forecast 2025-2030

Chart on France - Market size and forecast 2025-2030 ($ million)
Data Table on France - Market size and forecast 2025-2030 ($ million)
Chart on France - Year-over-year growth 2025-2030 (%)
Data Table on France - Year-over-year growth 2025-2030 (%)

12.5.4 Italy - Market size and forecast 2025-2030

Chart on Italy - Market size and forecast 2025-2030 ($ million)
Data Table on Italy - Market size and forecast 2025-2030 ($ million)
Chart on Italy - Year-over-year growth 2025-2030 (%)
Data Table on Italy - Year-over-year growth 2025-2030 (%)

12.5.5 Spain - Market size and forecast 2025-2030

Chart on Spain - Market size and forecast 2025-2030 ($ million)
Data Table on Spain - Market size and forecast 2025-2030 ($ million)
Chart on Spain - Year-over-year growth 2025-2030 (%)
Data Table on Spain - Year-over-year growth 2025-2030 (%)

12.5.6 The Netherlands - Market size and forecast 2025-2030

Chart on The Netherlands - Market size and forecast 2025-2030 ($ million)
Data Table on The Netherlands - Market size and forecast 2025-2030 ($ million)
Chart on The Netherlands - Year-over-year growth 2025-2030 (%)
Data Table on The Netherlands - Year-over-year growth 2025-2030 (%)

12.6 South America - Market size and forecast 2025-2030

Chart on South America - Market size and forecast 2025-2030 ($ million)
Data Table on South America - Market size and forecast 2025-2030 ($ million)
Chart on South America - Year-over-year growth 2025-2030 (%)
Data Table on South America - Year-over-year growth 2025-2030 (%)
Chart on Regional Comparison - South America
Data Table on Regional Comparison - South America

12.6.1 Brazil - Market size and forecast 2025-2030

Chart on Brazil - Market size and forecast 2025-2030 ($ million)
Data Table on Brazil - Market size and forecast 2025-2030 ($ million)
Chart on Brazil - Year-over-year growth 2025-2030 (%)
Data Table on Brazil - Year-over-year growth 2025-2030 (%)

12.6.2 Argentina - Market size and forecast 2025-2030

Chart on Argentina - Market size and forecast 2025-2030 ($ million)
Data Table on Argentina - Market size and forecast 2025-2030 ($ million)
Chart on Argentina - Year-over-year growth 2025-2030 (%)
Data Table on Argentina - Year-over-year growth 2025-2030 (%)

12.6.3 Chile - Market size and forecast 2025-2030

Chart on Chile - Market size and forecast 2025-2030 ($ million)
Data Table on Chile - Market size and forecast 2025-2030 ($ million)
Chart on Chile - Year-over-year growth 2025-2030 (%)
Data Table on Chile - Year-over-year growth 2025-2030 (%)

12.7 Middle East and Africa - Market size and forecast 2025-2030

Chart on Middle East and Africa - Market size and forecast 2025-2030 ($ million)
Data Table on Middle East and Africa - Market size and forecast 2025-2030 ($ million)
Chart on Middle East and Africa - Year-over-year growth 2025-2030 (%)
Data Table on Middle East and Africa - Year-over-year growth 2025-2030 (%)
Chart on Regional Comparison - Middle East and Africa
Data Table on Regional Comparison - Middle East and Africa

12.7.1 Saudi Arabia - Market size and forecast 2025-2030

Chart on Saudi Arabia - Market size and forecast 2025-2030 ($ million)
Data Table on Saudi Arabia - Market size and forecast 2025-2030 ($ million)
Chart on Saudi Arabia - Year-over-year growth 2025-2030 (%)
Data Table on Saudi Arabia - Year-over-year growth 2025-2030 (%)

12.7.2 UAE - Market size and forecast 2025-2030

Chart on UAE - Market size and forecast 2025-2030 ($ million)
Data Table on UAE - Market size and forecast 2025-2030 ($ million)
Chart on UAE - Year-over-year growth 2025-2030 (%)
Data Table on UAE - Year-over-year growth 2025-2030 (%)

12.7.3 South Africa - Market size and forecast 2025-2030

Chart on South Africa - Market size and forecast 2025-2030 ($ million)
Data Table on South Africa - Market size and forecast 2025-2030 ($ million)
Chart on South Africa - Year-over-year growth 2025-2030 (%)
Data Table on South Africa - Year-over-year growth 2025-2030 (%)

12.7.4 Turkey - Market size and forecast 2025-2030

Chart on Turkey - Market size and forecast 2025-2030 ($ million)
Data Table on Turkey - Market size and forecast 2025-2030 ($ million)
Chart on Turkey - Year-over-year growth 2025-2030 (%)
Data Table on Turkey - Year-over-year growth 2025-2030 (%)

12.7.5 Israel - Market size and forecast 2025-2030

Chart on Israel - Market size and forecast 2025-2030 ($ million)
Data Table on Israel - Market size and forecast 2025-2030 ($ million)
Chart on Israel - Year-over-year growth 2025-2030 (%)
Data Table on Israel - Year-over-year growth 2025-2030 (%)

12.8 Market opportunity by geography

Market opportunity by geography ($ million)
Data Tables on Market opportunity by geography ($ million)

13. Drivers, Challenges, and Opportunity

13.1 Market drivers

Heightened consumer awareness regarding pathogen prevention and public health initiatives
Strategic emphasis on product innovation and sustainable formulation technologies
Expansion of commercial infrastructure and institutional hygiene standards in emerging economies

13.2 Market challenges

Volatility in raw material feedstocks and global supply chain fragility
Escalating regulatory stringency and synthetic chemical restrictions
Market saturation and intensified competition from sustainable alternative formats

13.3 Impact of drivers and challenges

Impact of drivers and challenges in 2025 and 2030

13.4 Market opportunities

Evolution of skincare-infused liquid formulations and holistic wellness
Digital transformation and integration of intelligent hygiene monitoring systems
Transition toward circular economy models and sustainable delivery frameworks

14. Competitive Landscape

14.1 Overview

14.2

Overview on criticality of inputs and factors of differentiation

14.3 Landscape disruption

Overview on factors of disruption

14.4 Industry risks

Impact of key risks on business

15. Competitive Analysis

15.1 Companies profiled

Companies covered

15.2 Company ranking index

15.3 Market positioning of companies

Matrix on companies position and classification

15.4 3M Co.

3M Co. - Overview
3M Co. - Business segments
3M Co. - Key news
3M Co. - Key offerings
3M Co. - Segment focus
SWOT

15.5 Aesop

Aesop - Overview
Aesop - Product / Service
Aesop - Key offerings
SWOT

15.6 Amway Corp.

Amway Corp. - Overview
Amway Corp. - Product / Service
Amway Corp. - Key offerings
SWOT

15.7 Avon Products Inc.

Avon Products Inc. - Overview
Avon Products Inc. - Product / Service
Avon Products Inc. - Key offerings
SWOT

15.8 Bath and Body Works Inc.

Bath and Body Works Inc. - Overview
Bath and Body Works Inc. - Product / Service
Bath and Body Works Inc. - Key offerings
SWOT

15.9 Cleenol Group Ltd.

Cleenol Group Ltd. - Overview
Cleenol Group Ltd. - Product / Service
Cleenol Group Ltd. - Key offerings
SWOT

15.10 Colgate Palmolive Co.

Colgate Palmolive Co. - Overview
Colgate Palmolive Co. - Business segments
Colgate Palmolive Co. - Key offerings
Colgate Palmolive Co. - Segment focus
SWOT

15.11 Ecolab Inc.

Ecolab Inc. - Overview
Ecolab Inc. - Business segments
Ecolab Inc. - Key news
Ecolab Inc. - Key offerings
Ecolab Inc. - Segment focus
SWOT

15.12 GOJO Industries Inc.

GOJO Industries Inc. - Overview
GOJO Industries Inc. - Product / Service
GOJO Industries Inc. - Key offerings
SWOT

15.13 Kutol Products Co.

Kutol Products Co. - Overview
Kutol Products Co. - Product / Service
Kutol Products Co. - Key offerings
SWOT

15.14 Lion Corp.

Lion Corp. - Overview
Lion Corp. - Business segments
Lion Corp. - Key offerings
Lion Corp. - Segment focus
SWOT

15.15 Reckitt Benckiser Group Plc

Reckitt Benckiser Group Plc - Overview
Reckitt Benckiser Group Plc - Business segments
Reckitt Benckiser Group Plc - Key offerings
Reckitt Benckiser Group Plc - Segment focus
SWOT

15.16 Saraya Co. Ltd.

Saraya Co. Ltd. - Overview
Saraya Co. Ltd. - Product / Service
Saraya Co. Ltd. - Key offerings
SWOT

15.17 Unilever PLC

Unilever PLC - Overview
Unilever PLC - Business segments
Unilever PLC - Key news
Unilever PLC - Key offerings
Unilever PLC - Segment focus
SWOT

15.18 Vi Jon LLC

Vi Jon LLC - Overview
Vi Jon LLC - Product / Service
Vi Jon LLC - Key offerings
SWOT

16. Appendix

16.1 Scope of the report

Market definition
Objectives
Notes and caveats

16.2 Inclusions and exclusions checklist

Inclusions checklist
Exclusions checklist

16.3 Currency conversion rates for US$

16.4 Research methodology

16.5 Data procurement

Information sources

16.6 Data validation

16.7 Validation techniques employed for market sizing

16.8 Data synthesis

16.9 360 degree market analysis

16.10 List of abbreviations

Research Methodology

Technavio presents a detailed picture of the market by way of study, synthesis, and summation of data from multiple sources. The analysts have presented the various facets of the market with a particular focus on identifying the key industry influencers. The data thus presented is comprehensive, reliable, and the result of extensive research, both primary and secondary.

INFORMATION SOURCES

Primary sources

  • Manufacturers and suppliers
  • Channel partners
  • Industry experts
  • Strategic decision makers

Secondary sources

  • Industry journals and periodicals
  • Government data
  • Financial reports of key industry players
  • Historical data
  • Press releases

DATA ANALYSIS

Data Synthesis

  • Collation of data
  • Estimation of key figures
  • Analysis of derived insights

Data Validation

  • Triangulation with data models
  • Reference against proprietary databases
  • Corroboration with industry experts

REPORT WRITING

Qualitative

  • Market drivers
  • Market challenges
  • Market trends
  • Five forces analysis

Quantitative

  • Market size and forecast
  • Market segmentation
  • Geographical insights
  • Competitive landscape

Interested in this report?

Get your sample now to see our research methodology and insights!

Download Now

Frequently Asked Questions

Liquid Hand Soap market growth will increase by USD 2661.6 million during 2026-2030.

The Liquid Hand Soap market is expected to grow at a CAGR of 8.5% during 2026-2030.

Liquid Hand Soap market is segmented by Type (Synthetic, Organic) Distribution channel (Offline, Online) Application (Household, Commercial)

3M Co., Aesop, Amway Corp., Avon Products Inc., Bath and Body Works Inc., Cleenol Group Ltd., Colgate Palmolive Co., Dial soap, Ecolab Inc., GOJO Industries Inc., Kutol Products Co., Lion Corp., Puracy, Reckitt Benckiser Group Plc, Saraya Co. Ltd., The J.R. Watkins Co., Unilever PLC, Vi Jon LLC are a few of the key vendors in the Liquid Hand Soap market.

APAC will register the highest growth rate of 55.1% among the other regions. Therefore, the Liquid Hand Soap market in APAC is expected to garner significant business opportunities for the vendors during the forecast period.

China, Japan, India, South Korea, Australia, Indonesia, US, Canada, Mexico, Germany, UK, France, Italy, Spain, The Netherlands, Brazil, Argentina, Chile, Saudi Arabia, UAE, South Africa, Turkey, Israel

  • Heightened consumer awareness regarding pathogen prevention and public health initiatives is the driving factor this market.

The Liquid Hand Soap market vendors should focus on grabbing business opportunities from the Type segment as it accounted for the largest market share in the base year.
RIA - Research AI Assistant
Ask RIA
