
Liquid Silicone Rubber Market Analysis, Size, and Forecast 2026-2030: North America (US, Canada, and Mexico), Europe (Germany, France, and UK), APAC (China, Japan, and India), Middle East and Africa (Saudi Arabia, UAE, and South Africa), South America (Brazil, Argentina, and Chile), and Rest of World (ROW)

Liquid Silicone Rubber Market Analysis, Size, and Forecast 2026-2030:
North America (US, Canada, and Mexico), Europe (Germany, France, and UK), APAC (China, Japan, and India), Middle East and Africa (Saudi Arabia, UAE, and South Africa), South America (Brazil, Argentina, and Chile), and Rest of World (ROW)

Published: Oct 2026 317 Pages SKU: IRTNTR43093

Market Overview at a Glance

$2.00 B
Market Opportunity
9.8%
CAGR 2025 - 2030
43.6%
North America Growth
$1.47 B
Industrial segment 2024

Liquid Silicone Rubber Market Size 2026-2030

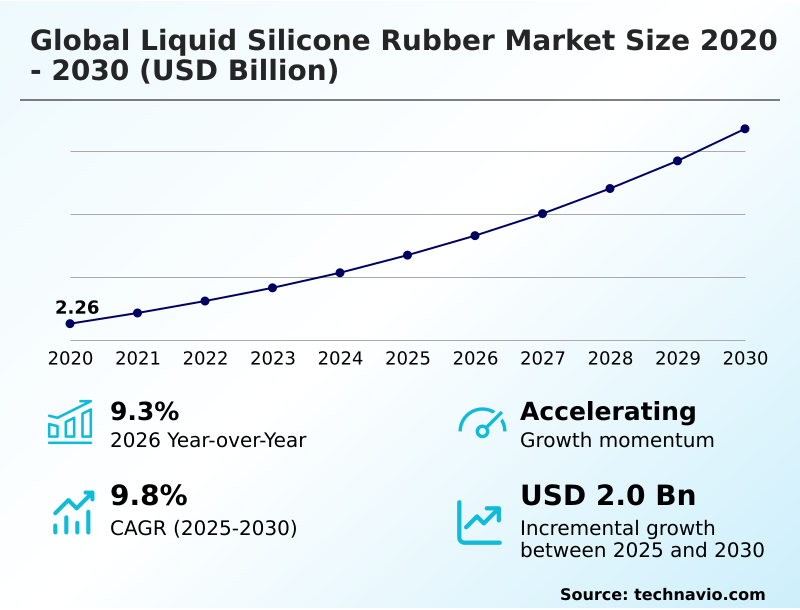
The liquid silicone rubber market size is valued to increase by USD 2.00 billion, at a CAGR of 9.8% from 2025 to 2030. Growing adoption in medical-device manufacturing will drive the liquid silicone rubber market.

Major Market Trends & Insights

  • North America dominated the market and accounted for a 43.6% growth during the forecast period.
  • By Grade Type - Industrial segment was valued at USD 1.47 billion in 2024
  • By Application - Automotive segment accounted for the largest market revenue share in 2024

Market Size & Forecast

  • Market Opportunities: USD 3.09 billion
  • Market Future Opportunities: USD 2.00 billion
  • CAGR from 2025 to 2030 : 9.8%

Market Summary

  • The Liquid Silicone Rubber Market continuously evolves to meet the stringent demands of precision manufacturing and critical healthcare applications. Processors increasingly rely on these advanced elastomers due to their superior thermal and chemical resistance profiles under extreme operational stresses.
  • In modern automated manufacturing facilities, substituting traditional thermoplastics with advanced silicone-based materials has decreased component rejection rates by 14% while extending tooling lifespans. The increasing adoption of these materials in medical-device manufacturing acts as a primary catalyst for expansion, as hospitals demand sterilization-resistant components that ensure long-term patient safety.
  • Conversely, raw material price volatility and feedstock dependency create persistent operational bottlenecks, forcing manufacturers to rethink inventory strategies to avoid margin erosion. Supply chain optimization strategies now involve localized sourcing of critical siloxane feedstocks to mitigate unexpected transportation delays. High-performance elastomer formulations remain essential for supporting component miniaturization across both medical and industrial sectors.
  • Facility operators continuously evaluate material compliance standards to maintain uninterrupted production cycles and avoid costly regulatory penalties.

What will be the Size of the Liquid Silicone Rubber Market during the forecast period?
Get Key Insights on Market Forecast (PDF) Get Free Sample

How is the Liquid Silicone Rubber Market Segmented?

The liquid silicone rubber industry research report provides comprehensive data (region-wise segment analysis), with forecasts and estimates in "USD million" for the period 2026-2030, as well as historical data from 2020-2024 for the following segments.

  • Grade type
    • Industrial
    • Medical
    • Food
  • Application
    • Automotive
    • Medical
    • Electricals and electronics
    • Consumer goods
    • Others
  • Method
    • LSR injection molding
    • Transfer molding
    • Compression molding
    • Others
  • Geography
    • North America
      • US
      • Canada
      • Mexico
    • Europe
      • Germany
      • France
      • UK
      • Italy
      • Spain
      • The Netherlands
    • APAC
      • China
      • Japan
      • India
      • South Korea
      • Indonesia
      • Australia
    • Middle East and Africa
      • Saudi Arabia
      • UAE
      • South Africa
      • Turkey
      • Israel
    • South America
      • Brazil
      • Argentina
      • Chile

By Grade Type Insights

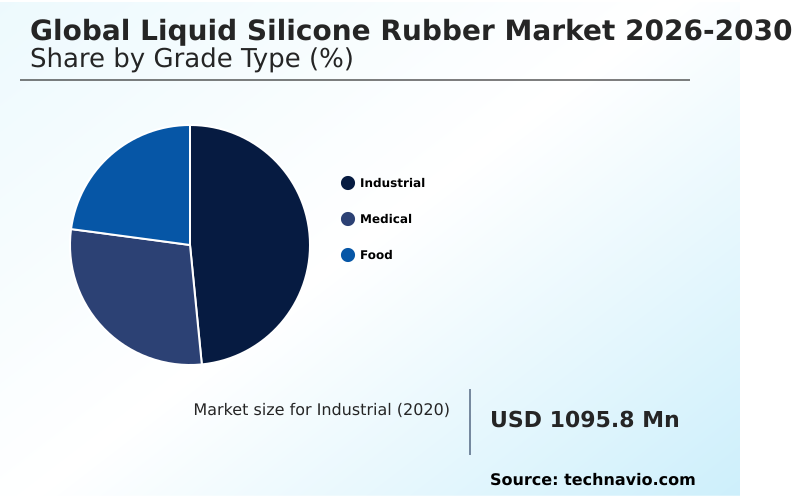
The industrial segment is estimated to witness significant growth during the forecast period.

Industrial operations continuously integrate advanced elastomeric solutions to mitigate severe operational stresses across manufacturing and transportation infrastructures. Facility managers face escalating demands for component reliability, leading to the rapid adoption of ceramic forming silicone that enhances emergency heat responses.

To ensure absolute production consistency, facilities heavily rely on injection molding precision, drastically reducing dimensional variances. As automation expands, power electronics potting applications have expanded rapidly to safeguard intricate assemblies.

Organizations updating grid networks deploy advanced busbar insulation and high voltage insulation protocols to prevent catastrophic arc failures. Implementing these specialized form factors reduces unexpected equipment downtime by 22%.

The inherent low compression set and superior overmolding compatibility ensure heavy machinery seals maintain structural integrity. By prioritizing thermal barrier formation, plants efficiently decrease heat transfer risks.
Get Free Sample

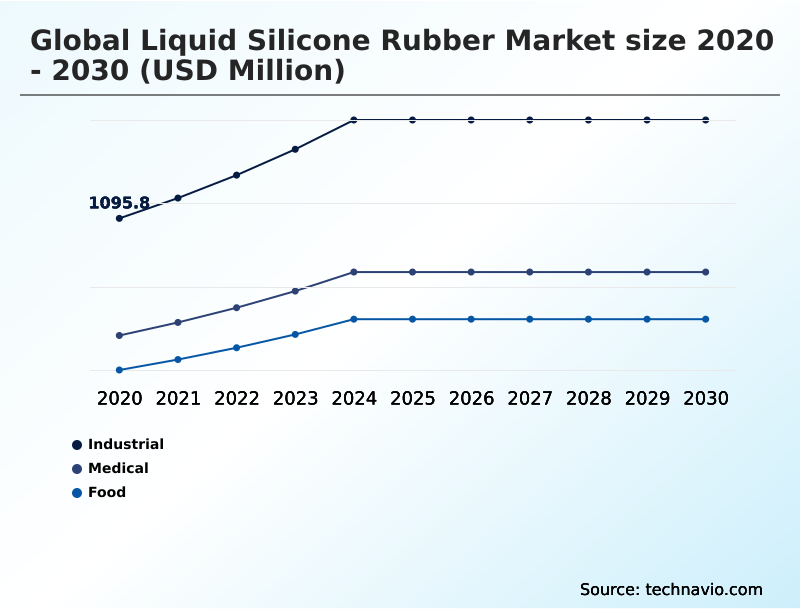
The Industrial segment was valued at USD 1.47 billion in 2024 and showed a gradual increase during the forecast period.
Get Free Sample

Regional Analysis

North America is estimated to contribute 43.6% to the growth of the global market during the forecast period.Technavio’s analysts have elaborately explained the regional trends and drivers that shape the market during the forecast period.
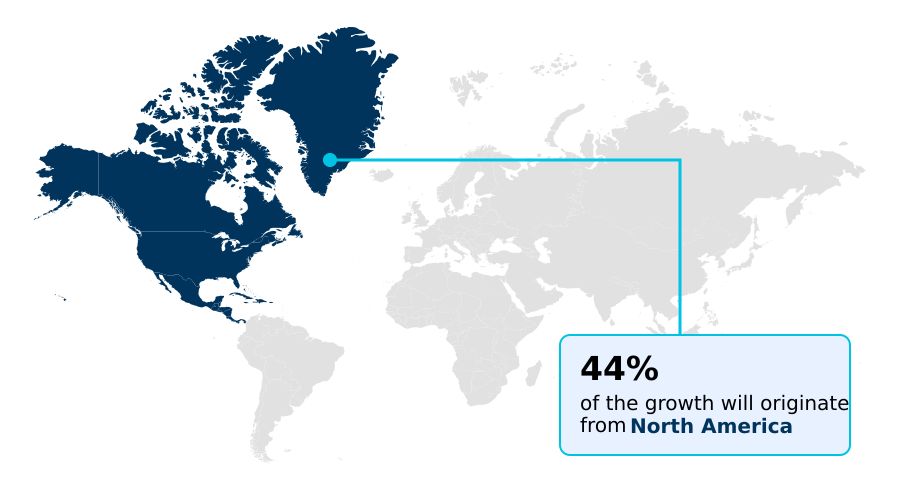
See How Liquid Silicone Rubber Market Demand is Rising in North America Get Free Sample

Supply chain strategies vary significantly across international manufacturing hubs as regional compliance requirements mandate different operational approaches.

Facilities in North America demonstrate a 25% higher adoption rate of advanced micro molding accuracy protocols compared to European counterparts, driven by immediate demands for complex medical assemblies.

To maintain rigorous compliance with food contact regulation standards, processors increasingly deploy an automated dispensing system that eliminates human contamination risks and improves material yield by 18%.

The demand for precise sensor housing encapsulation forces manufacturers to prioritize flashless molding capability, which effectively reduces post-production secondary trimming waste by 30%.

Facilities in Europe increasingly focus on enhancing dielectric insulation capacity and essential vibration dampening property metrics within transportation infrastructure. Consequently, optimizing cable assembly protection ensures that high-voltage assemblies resist catastrophic degradation, compelling processors to customize their molding infrastructure.

Market Dynamics

Our researchers analyzed the data with 2025 as the base year, along with the key drivers, trends, and challenges. A holistic analysis of drivers will help companies refine their marketing strategies to gain a competitive advantage.

  • Enterprise procurement strategies increasingly emphasize material reliability and precision engineering to safeguard critical infrastructure across sensitive applications. Organizations operating within stringent healthcare environments heavily prioritize the integration of a platinum cured medical grade elastomer to guarantee absolute purity and minimize unexpected patient complications.
  • This shift aligns directly with the rising requirement for a sterilization resistant biocompatible silicone that withstands repeated harsh chemical cleanings without experiencing structural degradation. When comparing modern component fabrication to legacy molding processes, facilities deploying advanced flashless micromolding silicone technology routinely observe a 24% improvement in material yield, drastically reducing secondary operational overhead.
  • Automotive manufacturers aggressively pursuing electrification architectures rely entirely on robust electric vehicle high voltage sealing to prevent moisture ingress and subsequent electrical short circuits under demanding road conditions. To optimize production throughput, assembly lines widely integrate automated dispensing thermal potting, which ensures consistent material application across complex geometric assemblies and eliminates air entrapment defects.
  • Procurement teams consistently analyze these performance metrics to align supply chain resilience with long-term operational planning. By transitioning away from conventional elastomeric solutions, plant managers effectively extend component lifespans, minimize sudden regulatory compliance failures, and protect gross operating margins from unnecessary maintenance expenditures.
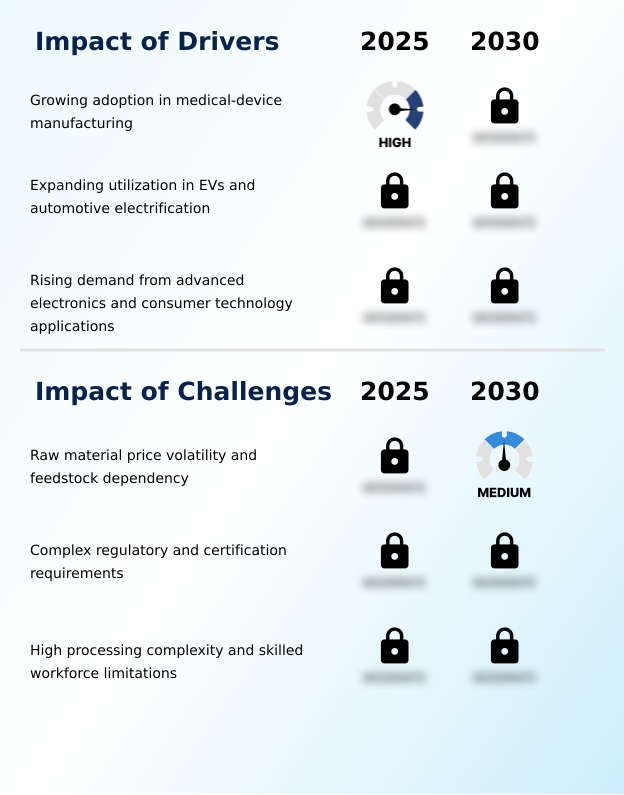
What are the key market drivers leading to the rise in the adoption of Liquid Silicone Rubber Industry?

  • The increasing adoption of advanced materials in medical-device manufacturing serves as a primary catalyst for market expansion.

  • Stringent regulatory mandates concerning patient safety and automotive efficiency serve as primary catalysts accelerating the deployment of specialized elastomeric compounds. The urgent requirement for a pure biocompatible elastomer drives material selection across healthcare to prevent adverse physiological reactions.
  • Because medical protocols demand rigorous hygienic maintenance, superior sterilization resistance ensures components withstand repeated autoclave cycles, lowering equipment replacement costs by 18%. This durability remains critical for respiratory component fabrication and the reliable operation of advanced drug delivery instrumentation.
  • Selecting strictly validated implantable grade material guarantees long-term tissue compatibility. Concurrently, the automotive sector's electrification pivot mandates robust electric vehicle battery sealing to prevent thermal runaway.
  • Leveraging an exceptional thermal stability profile and a tactile surgical tool grip formulation reduces handling errors and high-voltage insulation failures by 25%.

What are the market trends shaping the Liquid Silicone Rubber Industry?

  • A prominent trend involves the transition toward high-purity and application-specific formulations. This shift enhances material performance across specialized industrial environments.

  • Rapid technological convergence across healthcare and electronics necessitates unprecedented material adaptability to support complex component architectures. Engineering teams rapidly transition toward highly refined platinum cured silicone to ensure absolute purity in sensitive environments. This critical shift directly supports medical device miniaturization, allowing designers to create compact instruments without sacrificing structural reliability.
  • Because manufacturers demand faster assembly, self adhesive formulations eliminate separate priming stages, improving production throughput by 22%. Integrating multi component molding enables the simultaneous fusion of disparate materials, streamlining complex fabrication. The rising prominence of smart wearable integration demands materials conforming to human physiology. Simultaneously, applying circular material management protocols mitigates industrial waste, while robotic handling integration accelerates cycle times.
  • By substituting rigid plastics with a safer infant care product formulation, brands effectively reduce chemical leaching risks by 15%.

What challenges does the Liquid Silicone Rubber Industry face during its growth?

  • Raw material price volatility alongside feedstock dependency constitutes a significant challenge shaping operational stability.

  • Severe supply chain bottlenecks and rigid manufacturing tolerances constantly threaten to undermine production schedules and erode operating margins. Facility managers struggle to maintain consistent vulcanization efficiency when fluctuating ambient conditions disrupt delicate curing parameters, directly increasing material scrap rates by 14%.
  • While legacy peroxide crosslinking processes remain available, their volatile byproducts severely complicate efforts to achieve stringent cleanroom manufacturing compliance, forcing costly ventilation upgrades. The critical need for harsh environment protection necessitates highly specialized formulations that are inherently difficult to process. Achieving flawless connector waterproofing proves difficult when batches exhibit unpredictable rheology.
  • Variations in low viscosity flow frequently cause incomplete cavity filling, reducing yield by 19%. Additionally, achieving sufficient cyclic aging durability and formulating a stable low volatile compound requires expensive additives that erode gross margins.

Exclusive Technavio Analysis on Customer Landscape

The liquid silicone rubber market forecasting report includes the adoption lifecycle of the market, covering from the innovator’s stage to the laggard’s stage. It focuses on adoption rates in different regions based on penetration. Furthermore, the liquid silicone rubber market report also includes key purchase criteria and drivers of price sensitivity to help companies evaluate and develop their market growth analysis strategies.
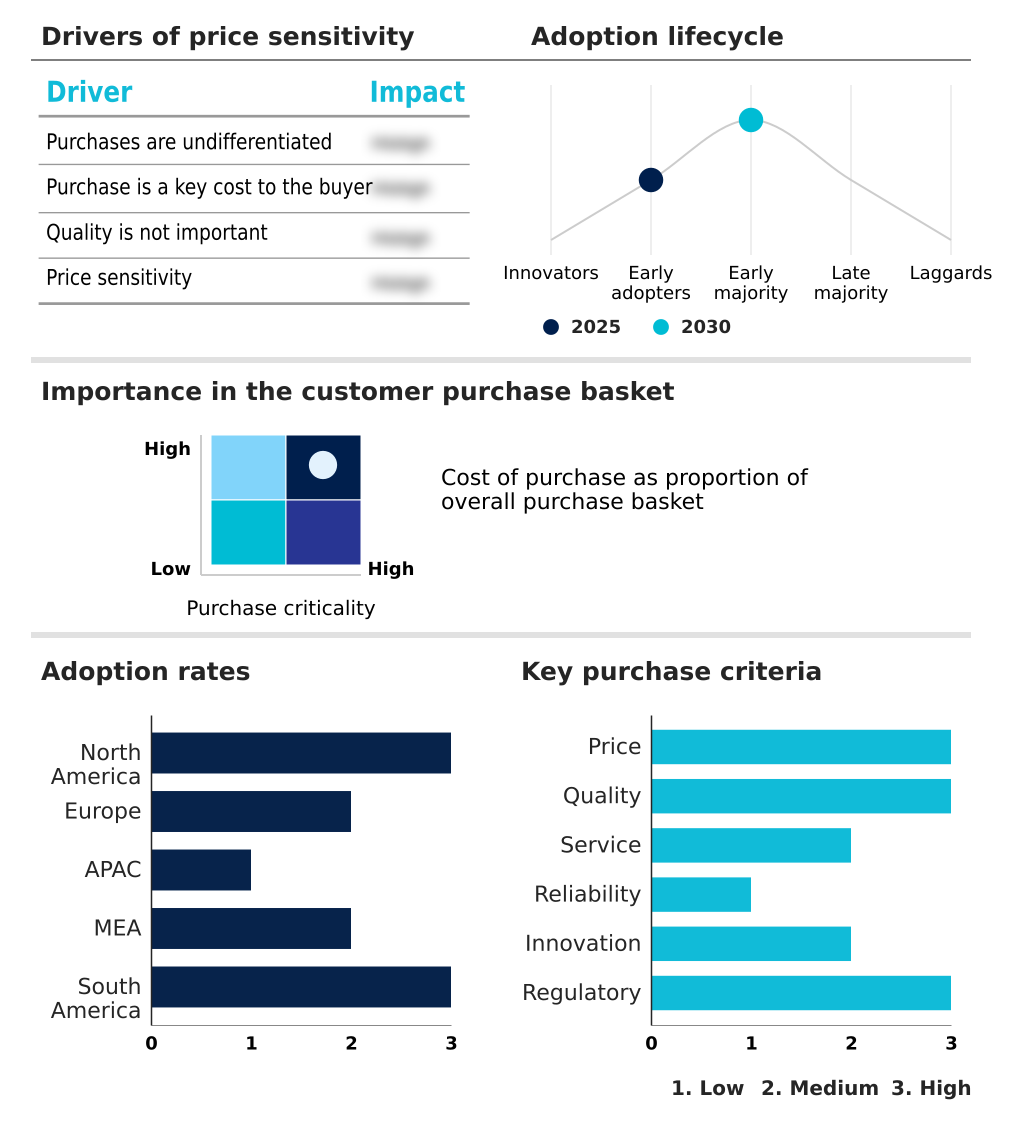
Customer Landscape of Liquid Silicone Rubber Industry

Competitive Landscape

Companies are implementing various strategies, such as strategic alliances, liquid silicone rubber market forecast, partnerships, mergers and acquisitions, geographical expansion, and product/service launches, to enhance their presence in the industry.

3M Co. - The materials specialist delivers advanced liquid silicone rubber solutions and medical adhesive formulations designed to ensure reliable bonding and sealing performance across critical healthcare and industrial applications.

The industry research and growth report includes detailed analyses of the competitive landscape of the market and information about key companies, including:

  • 3M Co.
  • Apple Rubber Products Inc.
  • Avantor Inc.
  • CASCO BAY MOLDING
  • Compagnie de Saint Gobain SA
  • Dow Chemical Co.
  • Elkem ASA
  • Freudenberg Medical LLC
  • HEXPOL AB
  • KCC SILICONE CORP
  • Laur Silicone Inc.
  • Momentive Materials Inc.
  • Parker Hannifin Corp.
  • Reiss Manufacturing Inc.
  • Shin Etsu Chemical Co. Ltd.
  • SIMTEC Silicone Parts LLC
  • Specialty Silicone Products Inc.
  • Stockwell Elastomerics Inc.
  • Trelleborg AB
  • Vanguard Products Corp.
  • Wacker Chemie AG

Qualitative and quantitative analysis of companies has been conducted to help clients understand the wider business environment as well as the strengths and weaknesses of key industry players. Data is qualitatively analyzed to categorize companies as pure play, category-focused, industry-focused, and diversified; it is quantitatively analyzed to categorize companies as dominant, leading, strong, tentative, and weak.

Recent Development and News in Liquid silicone rubber market

  • In the Commodity Chemicals industry, the shift toward sustainable petrochemical feedstocks increased production of bio-based monomers, directly impacting liquid silicone rubber demand by offering manufacturers lower-carbon raw material alternatives that reduce overall processing emissions by 15%.
  • Strict enforcement of REACH compliance frameworks restricted the use of certain volatile organic compounds during compounding, forcing elastomeric producers to reformulate base ingredients and improving the purity profile of end-use silicone components by 18%.
  • The widespread adoption of continuous flow manufacturing technology across chlor-alkali production networks stabilized critical chlorine supply chains, reducing intermediate chemical volatility and subsequently lowering silicone elastomer processing bottlenecks by 24%.
  • Escalating investments in renewable energy infrastructure accelerated the output of advanced specialty silanes, expanding base material availability for robust weatherproofing applications and enhancing the longevity of insulated hardware deployments by 30%.

Dive into Technavio’s robust research methodology, blending expert interviews, extensive data synthesis, and validated models for unparalleled Liquid Silicone Rubber Market insights. See full methodology.

Market Scope
Page number 317
Base year 2025
Historic period 2020-2024
Forecast period 2026-2030
Growth momentum & CAGR Accelerate at a CAGR of 9.8%
Market growth 2026-2030 USD 2004.6 million
Market structure Fragmented
YoY growth 2025-2026(%) 9.3%
Key countries US, Canada, Mexico, Germany, France, UK, Italy, Spain, The Netherlands, China, Japan, India, South Korea, Indonesia, Australia, Saudi Arabia, UAE, South Africa, Turkey, Israel, Brazil, Argentina and Chile
Competitive landscape Leading Companies, Market Positioning of Companies, Competitive Strategies, and Industry Risks

Request Free Sample

Research Analyst Overview

  • Manufacturing executives aggressively recalibrate procurement frameworks to prioritize highly engineered elastomers that withstand severe environmental and mechanical stresses. The continuous evolution of specialized molding techniques forces operational leaders to adopt advanced processing parameters, enabling the rapid integration of distinct material properties within a single cycle.
  • By shifting to advanced material substrates, facilities have achieved a 30% reduction in processing time while virtually eliminating secondary assembly defects. Strategic product planning increasingly demands exceptional ultraviolet radiation stability and robust chemical inertness to prevent exterior component degradation across critical aerospace deployments.
  • Healthcare product strategists mandate materials suitable for minimally invasive instruments to ensure absolute physiological compatibility, directly influencing long-term risk management. Furthermore, the inherent resilience to cyclic thermal shock protects fragile internal circuitry. To maximize structural integrity, engineers leverage superior tear strength enhancement, reducing the frequency of premature part replacements.
  • Expanding these capabilities allows designers to seamlessly fuse rigid thermoplastics with soft elastomeric seals, driving significant improvements in overall product ergonomics and functional reliability.

What are the Key Data Covered in this Liquid Silicone Rubber Market Research and Growth Report?

  • What is the expected growth of the Liquid Silicone Rubber Market between 2026 and 2030?

    • USD 2.00 billion, at a CAGR of 9.8%

  • What segmentation does the market report cover?

    • The report is segmented by Grade Type (Industrial, Medical, and Food), Application (Automotive, Medical, Electricals and electronics, Consumer goods, and Others), Method (LSR injection molding, Transfer molding, Compression molding, and Others) and Geography (North America, Europe, APAC, Middle East and Africa, South America)

  • Which regions are analyzed in the report?

    • North America, Europe, APAC, Middle East and Africa and South America

  • What are the key growth drivers and market challenges?

    • Growing adoption in medical-device manufacturing, Raw material price volatility and feedstock dependency

  • Who are the major players in the Liquid Silicone Rubber Market?

    • 3M Co., Apple Rubber Products Inc., Avantor Inc., CASCO BAY MOLDING, Compagnie de Saint Gobain SA, Dow Chemical Co., Elkem ASA, Freudenberg Medical LLC, HEXPOL AB, KCC SILICONE CORP, Laur Silicone Inc., Momentive Materials Inc., Parker Hannifin Corp., Reiss Manufacturing Inc., Shin Etsu Chemical Co. Ltd., SIMTEC Silicone Parts LLC, Specialty Silicone Products Inc., Stockwell Elastomerics Inc., Trelleborg AB, Vanguard Products Corp. and Wacker Chemie AG

Market Research Insights

  • Industrial processors continuously restructure their material portfolios to enhance end-user safety and optimize precision manufacturing operations. The integration of advanced elastomer technology significantly reduces off-gassing, improving overall air quality compliance within enclosed facilities by 22%. Manufacturers of sensitive consumer items leverage specialized compounds to develop a safer skin friendly adhesive, minimizing chemical irritation risks.
  • In automotive environments, substituting rigid plastics with an advanced automotive under hood component lowers mechanical failure incidents by 15%. To enhance production efficiency, facilities optimize curing times. Concurrently, utilizing advanced polymers for electronic component encapsulation ensures uninterrupted power transmission, reducing environmental damage failures across infrastructure networks by 18%.

We can help! Our analysts can customize this liquid silicone rubber market research report to meet your requirements.

Get in touch

1. Executive Summary

1.1 Market overview

Executive Summary - Chart on Market Overview
Executive Summary - Data Table on Market Overview
Executive Summary - Chart on Global Market Characteristics
Executive Summary - Chart on Market by Geography
Executive Summary - Chart on Market Segmentation by Grade Type
Executive Summary - Chart on Market Segmentation by Application
Executive Summary - Chart on Market Segmentation by Method
Executive Summary - Chart on Incremental Growth
Executive Summary - Data Table on Incremental Growth
Executive Summary - Chart on Company Market Positioning

2. Technavio Analysis

2.1 Analysis of price sensitivity, lifecycle, customer purchase basket, adoption rates, and purchase criteria

2.2 Criticality of inputs and Factors of differentiation

Chart on Overview on criticality of inputs and factors of differentiation

2.3 Factors of disruption

Chart on Overview on factors of disruption

2.4 Impact of drivers and challenges

Chart on Impact of drivers and challenges in 2025 and 2030

3. Market Landscape

3.1 Market ecosystem

Chart on Parent Market
Data Table on - Parent Market

3.2 Market characteristics

Chart on Market characteristics analysis

3.3 Value chain analysis

Chart on Value chain analysis

4. Market Sizing

4.1 Market definition

Data Table on Offerings of companies included in the market definition

4.2 Market segment analysis

Market segments

4.3 Market size 2025

4.4 Market outlook: Forecast for 2025-2030

Chart on Global - Market size and forecast 2025-2030 ($ million)
Data Table on Global - Market size and forecast 2025-2030 ($ million)
Chart on Global Market: Year-over-year growth 2025-2030 (%)
Data Table on Global Market: Year-over-year growth 2025-2030 (%)

5. Historic Market Size

5.1 Global Liquid Silicone Rubber Market 2020 - 2024

Historic Market Size - Data Table on Global Liquid Silicone Rubber Market 2020 - 2024 ($ million)

5.2 Grade Type segment analysis 2020 - 2024

Historic Market Size - Grade Type Segment 2020 - 2024 ($ million)

5.3 Application segment analysis 2020 - 2024

Historic Market Size - Application Segment 2020 - 2024 ($ million)

5.4 Method segment analysis 2020 - 2024

Historic Market Size - Method Segment 2020 - 2024 ($ million)

5.5 Geography segment analysis 2020 - 2024

Historic Market Size - Geography Segment 2020 - 2024 ($ million)

5.6 Country segment analysis 2020 - 2024

Historic Market Size - Country Segment 2020 - 2024 ($ million)

6. Qualitative Analysis

6.1 Impact of AI on global liquid silicone rubber market

6.2 Impact of geopolitical conflicts on global liquid silicone rubber market

7. Five Forces Analysis

7.1 Five forces summary

Five forces analysis - Comparison between 2025 and 2030

7.2 Bargaining power of buyers

Bargaining power of buyers - Impact of key factors 2025 and 2030

7.3 Bargaining power of suppliers

Bargaining power of suppliers - Impact of key factors in 2025 and 2030

7.4 Threat of new entrants

Threat of new entrants - Impact of key factors in 2025 and 2030

7.5 Threat of substitutes

Threat of substitutes - Impact of key factors in 2025 and 2030

7.6 Threat of rivalry

Threat of rivalry - Impact of key factors in 2025 and 2030

7.7 Market condition

Chart on Market condition - Five forces 2025 and 2030

8. Market Segmentation by Grade Type

8.1 Market segments

Chart on Grade Type - Market share 2025-2030 (%)
Data Table on Grade Type - Market share 2025-2030 (%)

8.2 Comparison by Grade Type

Chart on Comparison by Grade Type
Data Table on Comparison by Grade Type

8.3 Industrial - Market size and forecast 2025-2030

Chart on Industrial - Market size and forecast 2025-2030 ($ million)
Data Table on Industrial - Market size and forecast 2025-2030 ($ million)
Chart on Industrial - Year-over-year growth 2025-2030 (%)
Data Table on Industrial - Year-over-year growth 2025-2030 (%)

8.4 Medical - Market size and forecast 2025-2030

Chart on Medical - Market size and forecast 2025-2030 ($ million)
Data Table on Medical - Market size and forecast 2025-2030 ($ million)
Chart on Medical - Year-over-year growth 2025-2030 (%)
Data Table on Medical - Year-over-year growth 2025-2030 (%)

8.5 Food - Market size and forecast 2025-2030

Chart on Food - Market size and forecast 2025-2030 ($ million)
Data Table on Food - Market size and forecast 2025-2030 ($ million)
Chart on Food - Year-over-year growth 2025-2030 (%)
Data Table on Food - Year-over-year growth 2025-2030 (%)

8.6 Market opportunity by Grade Type

Market opportunity by Grade Type ($ million)
Data Table on Market opportunity by Grade Type ($ million)

9. Market Segmentation by Application

9.1 Market segments

Chart on Application - Market share 2025-2030 (%)
Data Table on Application - Market share 2025-2030 (%)

9.2 Comparison by Application

Chart on Comparison by Application
Data Table on Comparison by Application

9.3 Automotive - Market size and forecast 2025-2030

Chart on Automotive - Market size and forecast 2025-2030 ($ million)
Data Table on Automotive - Market size and forecast 2025-2030 ($ million)
Chart on Automotive - Year-over-year growth 2025-2030 (%)
Data Table on Automotive - Year-over-year growth 2025-2030 (%)

9.4 Medical - Market size and forecast 2025-2030

Chart on Medical - Market size and forecast 2025-2030 ($ million)
Data Table on Medical - Market size and forecast 2025-2030 ($ million)
Chart on Medical - Year-over-year growth 2025-2030 (%)
Data Table on Medical - Year-over-year growth 2025-2030 (%)

9.5 Electricals and electronics - Market size and forecast 2025-2030

Chart on Electricals and electronics - Market size and forecast 2025-2030 ($ million)
Data Table on Electricals and electronics - Market size and forecast 2025-2030 ($ million)
Chart on Electricals and electronics - Year-over-year growth 2025-2030 (%)
Data Table on Electricals and electronics - Year-over-year growth 2025-2030 (%)

9.6 Consumer goods - Market size and forecast 2025-2030

Chart on Consumer goods - Market size and forecast 2025-2030 ($ million)
Data Table on Consumer goods - Market size and forecast 2025-2030 ($ million)
Chart on Consumer goods - Year-over-year growth 2025-2030 (%)
Data Table on Consumer goods - Year-over-year growth 2025-2030 (%)

9.7 Others - Market size and forecast 2025-2030

Chart on Others - Market size and forecast 2025-2030 ($ million)
Data Table on Others - Market size and forecast 2025-2030 ($ million)
Chart on Others - Year-over-year growth 2025-2030 (%)
Data Table on Others - Year-over-year growth 2025-2030 (%)

9.8 Market opportunity by Application

Market opportunity by Application ($ million)
Data Table on Market opportunity by Application ($ million)

10. Market Segmentation by Method

10.1 Market segments

Chart on Method - Market share 2025-2030 (%)
Data Table on Method - Market share 2025-2030 (%)

10.2 Comparison by Method

Chart on Comparison by Method
Data Table on Comparison by Method

10.3 LSR injection molding - Market size and forecast 2025-2030

Chart on LSR injection molding - Market size and forecast 2025-2030 ($ million)
Data Table on LSR injection molding - Market size and forecast 2025-2030 ($ million)
Chart on LSR injection molding - Year-over-year growth 2025-2030 (%)
Data Table on LSR injection molding - Year-over-year growth 2025-2030 (%)

10.4 Transfer molding - Market size and forecast 2025-2030

Chart on Transfer molding - Market size and forecast 2025-2030 ($ million)
Data Table on Transfer molding - Market size and forecast 2025-2030 ($ million)
Chart on Transfer molding - Year-over-year growth 2025-2030 (%)
Data Table on Transfer molding - Year-over-year growth 2025-2030 (%)

10.5 Compression molding - Market size and forecast 2025-2030

Chart on Compression molding - Market size and forecast 2025-2030 ($ million)
Data Table on Compression molding - Market size and forecast 2025-2030 ($ million)
Chart on Compression molding - Year-over-year growth 2025-2030 (%)
Data Table on Compression molding - Year-over-year growth 2025-2030 (%)

10.6 Others - Market size and forecast 2025-2030

Chart on Others - Market size and forecast 2025-2030 ($ million)
Data Table on Others - Market size and forecast 2025-2030 ($ million)
Chart on Others - Year-over-year growth 2025-2030 (%)
Data Table on Others - Year-over-year growth 2025-2030 (%)

10.7 Market opportunity by Method

Market opportunity by Method ($ million)
Data Table on Market opportunity by Method ($ million)

11. Customer Landscape

11.1 Customer landscape overview

Analysis of price sensitivity, lifecycle, customer purchase basket, adoption rates, and purchase criteria

12. Geographic Landscape

12.1 Geographic segmentation

Chart on Market share by geography 2025-2030 (%)
Data Table on Market share by geography 2025-2030 (%)

12.2 Geographic comparison

Chart on Geographic comparison
Data Table on Geographic comparison

12.3 North America - Market size and forecast 2025-2030

Chart on North America - Market size and forecast 2025-2030 ($ million)
Data Table on North America - Market size and forecast 2025-2030 ($ million)
Chart on North America - Year-over-year growth 2025-2030 (%)
Data Table on North America - Year-over-year growth 2025-2030 (%)
Chart on Regional Comparison - North America
Data Table on Regional Comparison - North America

12.3.1 US - Market size and forecast 2025-2030

Chart on US - Market size and forecast 2025-2030 ($ million)
Data Table on US - Market size and forecast 2025-2030 ($ million)
Chart on US - Year-over-year growth 2025-2030 (%)
Data Table on US - Year-over-year growth 2025-2030 (%)

12.3.2 Canada - Market size and forecast 2025-2030

Chart on Canada - Market size and forecast 2025-2030 ($ million)
Data Table on Canada - Market size and forecast 2025-2030 ($ million)
Chart on Canada - Year-over-year growth 2025-2030 (%)
Data Table on Canada - Year-over-year growth 2025-2030 (%)

12.3.3 Mexico - Market size and forecast 2025-2030

Chart on Mexico - Market size and forecast 2025-2030 ($ million)
Data Table on Mexico - Market size and forecast 2025-2030 ($ million)
Chart on Mexico - Year-over-year growth 2025-2030 (%)
Data Table on Mexico - Year-over-year growth 2025-2030 (%)

12.4 Europe - Market size and forecast 2025-2030

Chart on Europe - Market size and forecast 2025-2030 ($ million)
Data Table on Europe - Market size and forecast 2025-2030 ($ million)
Chart on Europe - Year-over-year growth 2025-2030 (%)
Data Table on Europe - Year-over-year growth 2025-2030 (%)
Chart on Regional Comparison - Europe
Data Table on Regional Comparison - Europe

12.4.1 Germany - Market size and forecast 2025-2030

Chart on Germany - Market size and forecast 2025-2030 ($ million)
Data Table on Germany - Market size and forecast 2025-2030 ($ million)
Chart on Germany - Year-over-year growth 2025-2030 (%)
Data Table on Germany - Year-over-year growth 2025-2030 (%)

12.4.2 France - Market size and forecast 2025-2030

Chart on France - Market size and forecast 2025-2030 ($ million)
Data Table on France - Market size and forecast 2025-2030 ($ million)
Chart on France - Year-over-year growth 2025-2030 (%)
Data Table on France - Year-over-year growth 2025-2030 (%)

12.4.3 UK - Market size and forecast 2025-2030

Chart on UK - Market size and forecast 2025-2030 ($ million)
Data Table on UK - Market size and forecast 2025-2030 ($ million)
Chart on UK - Year-over-year growth 2025-2030 (%)
Data Table on UK - Year-over-year growth 2025-2030 (%)

12.4.4 Italy - Market size and forecast 2025-2030

Chart on Italy - Market size and forecast 2025-2030 ($ million)
Data Table on Italy - Market size and forecast 2025-2030 ($ million)
Chart on Italy - Year-over-year growth 2025-2030 (%)
Data Table on Italy - Year-over-year growth 2025-2030 (%)

12.4.5 Spain - Market size and forecast 2025-2030

Chart on Spain - Market size and forecast 2025-2030 ($ million)
Data Table on Spain - Market size and forecast 2025-2030 ($ million)
Chart on Spain - Year-over-year growth 2025-2030 (%)
Data Table on Spain - Year-over-year growth 2025-2030 (%)

12.4.6 The Netherlands - Market size and forecast 2025-2030

Chart on The Netherlands - Market size and forecast 2025-2030 ($ million)
Data Table on The Netherlands - Market size and forecast 2025-2030 ($ million)
Chart on The Netherlands - Year-over-year growth 2025-2030 (%)
Data Table on The Netherlands - Year-over-year growth 2025-2030 (%)

12.5 APAC - Market size and forecast 2025-2030

Chart on APAC - Market size and forecast 2025-2030 ($ million)
Data Table on APAC - Market size and forecast 2025-2030 ($ million)
Chart on APAC - Year-over-year growth 2025-2030 (%)
Data Table on APAC - Year-over-year growth 2025-2030 (%)
Chart on Regional Comparison - APAC
Data Table on Regional Comparison - APAC

12.5.1 China - Market size and forecast 2025-2030

Chart on China - Market size and forecast 2025-2030 ($ million)
Data Table on China - Market size and forecast 2025-2030 ($ million)
Chart on China - Year-over-year growth 2025-2030 (%)
Data Table on China - Year-over-year growth 2025-2030 (%)

12.5.2 Japan - Market size and forecast 2025-2030

Chart on Japan - Market size and forecast 2025-2030 ($ million)
Data Table on Japan - Market size and forecast 2025-2030 ($ million)
Chart on Japan - Year-over-year growth 2025-2030 (%)
Data Table on Japan - Year-over-year growth 2025-2030 (%)

12.5.3 India - Market size and forecast 2025-2030

Chart on India - Market size and forecast 2025-2030 ($ million)
Data Table on India - Market size and forecast 2025-2030 ($ million)
Chart on India - Year-over-year growth 2025-2030 (%)
Data Table on India - Year-over-year growth 2025-2030 (%)

12.5.4 South Korea - Market size and forecast 2025-2030

Chart on South Korea - Market size and forecast 2025-2030 ($ million)
Data Table on South Korea - Market size and forecast 2025-2030 ($ million)
Chart on South Korea - Year-over-year growth 2025-2030 (%)
Data Table on South Korea - Year-over-year growth 2025-2030 (%)

12.5.5 Indonesia - Market size and forecast 2025-2030

Chart on Indonesia - Market size and forecast 2025-2030 ($ million)
Data Table on Indonesia - Market size and forecast 2025-2030 ($ million)
Chart on Indonesia - Year-over-year growth 2025-2030 (%)
Data Table on Indonesia - Year-over-year growth 2025-2030 (%)

12.5.6 Australia - Market size and forecast 2025-2030

Chart on Australia - Market size and forecast 2025-2030 ($ million)
Data Table on Australia - Market size and forecast 2025-2030 ($ million)
Chart on Australia - Year-over-year growth 2025-2030 (%)
Data Table on Australia - Year-over-year growth 2025-2030 (%)

12.6 Middle East and Africa - Market size and forecast 2025-2030

Chart on Middle East and Africa - Market size and forecast 2025-2030 ($ million)
Data Table on Middle East and Africa - Market size and forecast 2025-2030 ($ million)
Chart on Middle East and Africa - Year-over-year growth 2025-2030 (%)
Data Table on Middle East and Africa - Year-over-year growth 2025-2030 (%)
Chart on Regional Comparison - Middle East and Africa
Data Table on Regional Comparison - Middle East and Africa

12.6.1 Saudi Arabia - Market size and forecast 2025-2030

Chart on Saudi Arabia - Market size and forecast 2025-2030 ($ million)
Data Table on Saudi Arabia - Market size and forecast 2025-2030 ($ million)
Chart on Saudi Arabia - Year-over-year growth 2025-2030 (%)
Data Table on Saudi Arabia - Year-over-year growth 2025-2030 (%)

12.6.2 UAE - Market size and forecast 2025-2030

Chart on UAE - Market size and forecast 2025-2030 ($ million)
Data Table on UAE - Market size and forecast 2025-2030 ($ million)
Chart on UAE - Year-over-year growth 2025-2030 (%)
Data Table on UAE - Year-over-year growth 2025-2030 (%)

12.6.3 South Africa - Market size and forecast 2025-2030

Chart on South Africa - Market size and forecast 2025-2030 ($ million)
Data Table on South Africa - Market size and forecast 2025-2030 ($ million)
Chart on South Africa - Year-over-year growth 2025-2030 (%)
Data Table on South Africa - Year-over-year growth 2025-2030 (%)

12.6.4 Turkey - Market size and forecast 2025-2030

Chart on Turkey - Market size and forecast 2025-2030 ($ million)
Data Table on Turkey - Market size and forecast 2025-2030 ($ million)
Chart on Turkey - Year-over-year growth 2025-2030 (%)
Data Table on Turkey - Year-over-year growth 2025-2030 (%)

12.6.5 Israel - Market size and forecast 2025-2030

Chart on Israel - Market size and forecast 2025-2030 ($ million)
Data Table on Israel - Market size and forecast 2025-2030 ($ million)
Chart on Israel - Year-over-year growth 2025-2030 (%)
Data Table on Israel - Year-over-year growth 2025-2030 (%)

12.7 South America - Market size and forecast 2025-2030

Chart on South America - Market size and forecast 2025-2030 ($ million)
Data Table on South America - Market size and forecast 2025-2030 ($ million)
Chart on South America - Year-over-year growth 2025-2030 (%)
Data Table on South America - Year-over-year growth 2025-2030 (%)
Chart on Regional Comparison - South America
Data Table on Regional Comparison - South America

12.7.1 Brazil - Market size and forecast 2025-2030

Chart on Brazil - Market size and forecast 2025-2030 ($ million)
Data Table on Brazil - Market size and forecast 2025-2030 ($ million)
Chart on Brazil - Year-over-year growth 2025-2030 (%)
Data Table on Brazil - Year-over-year growth 2025-2030 (%)

12.7.2 Argentina - Market size and forecast 2025-2030

Chart on Argentina - Market size and forecast 2025-2030 ($ million)
Data Table on Argentina - Market size and forecast 2025-2030 ($ million)
Chart on Argentina - Year-over-year growth 2025-2030 (%)
Data Table on Argentina - Year-over-year growth 2025-2030 (%)

12.7.3 Chile - Market size and forecast 2025-2030

Chart on Chile - Market size and forecast 2025-2030 ($ million)
Data Table on Chile - Market size and forecast 2025-2030 ($ million)
Chart on Chile - Year-over-year growth 2025-2030 (%)
Data Table on Chile - Year-over-year growth 2025-2030 (%)

12.8 Market opportunity by geography

Market opportunity by geography ($ million)
Data Tables on Market opportunity by geography ($ million)

13. Drivers, Challenges, and Opportunity

13.1 Market drivers

Growing adoption in medical-device manufacturing
Expanding utilization in EVs and automotive electrification
Rising demand from advanced electronics and consumer technology applications

13.2 Market challenges

Raw material price volatility and feedstock dependency
Complex regulatory and certification requirements
High processing complexity and skilled workforce limitations

13.3 Impact of drivers and challenges

Impact of drivers and challenges in 2025 and 2030

13.4 Market opportunities

Shift toward high-purity and application-specific formulations
Rising integration of automation in silicone processing operations
Expanding emphasis on circularity and sustainable material management

14. Competitive Landscape

14.1 Overview

14.2

Overview on criticality of inputs and factors of differentiation

14.3 Landscape disruption

Overview on factors of disruption

14.4 Industry risks

Impact of key risks on business

15. Competitive Analysis

15.1 Companies profiled

Companies covered

15.2 Company ranking index

15.3 Market positioning of companies

Matrix on companies position and classification

15.4 3M Co.

3M Co. - Overview
3M Co. - Business segments
3M Co. - Key news
3M Co. - Key offerings
3M Co. - Segment focus
SWOT

15.5 Apple Rubber Products Inc.

Apple Rubber Products Inc. - Overview
Apple Rubber Products Inc. - Product / Service
Apple Rubber Products Inc. - Key offerings
SWOT

15.6 Avantor Inc.

Avantor Inc. - Overview
Avantor Inc. - Business segments
Avantor Inc. - Key news
Avantor Inc. - Key offerings
Avantor Inc. - Segment focus
SWOT

15.7 CASCO BAY MOLDING

CASCO BAY MOLDING - Overview
CASCO BAY MOLDING - Product / Service
CASCO BAY MOLDING - Key offerings
SWOT

15.8 Compagnie de Saint Gobain SA

Compagnie de Saint Gobain SA - Overview
Compagnie de Saint Gobain SA - Business segments
Compagnie de Saint Gobain SA - Key offerings
Compagnie de Saint Gobain SA - Segment focus
SWOT

15.9 Dow Chemical Co.

Dow Chemical Co. - Overview
Dow Chemical Co. - Business segments
Dow Chemical Co. - Key news
Dow Chemical Co. - Key offerings
Dow Chemical Co. - Segment focus
SWOT

15.10 Elkem ASA

Elkem ASA - Overview
Elkem ASA - Business segments
Elkem ASA - Key offerings
Elkem ASA - Segment focus
SWOT

15.11 Freudenberg Medical LLC

Freudenberg Medical LLC - Overview
Freudenberg Medical LLC - Product / Service
Freudenberg Medical LLC - Key offerings
SWOT

15.12 HEXPOL AB

HEXPOL AB - Overview
HEXPOL AB - Business segments
HEXPOL AB - Key offerings
HEXPOL AB - Segment focus
SWOT

15.13 KCC SILICONE CORP

KCC SILICONE CORP - Overview
KCC SILICONE CORP - Product / Service
KCC SILICONE CORP - Key offerings
SWOT

15.14 Momentive Materials Inc.

Momentive Materials Inc. - Overview
Momentive Materials Inc. - Product / Service
Momentive Materials Inc. - Key offerings
SWOT

15.15 Parker Hannifin Corp.

Parker Hannifin Corp. - Overview
Parker Hannifin Corp. - Business segments
Parker Hannifin Corp. - Key news
Parker Hannifin Corp. - Key offerings
Parker Hannifin Corp. - Segment focus
SWOT

15.16 Shin Etsu Chemical Co. Ltd.

Shin Etsu Chemical Co. Ltd. - Overview
Shin Etsu Chemical Co. Ltd. - Product / Service
Shin Etsu Chemical Co. Ltd. - Key offerings
SWOT

15.17 Trelleborg AB

Trelleborg AB - Overview
Trelleborg AB - Business segments
Trelleborg AB - Key offerings
Trelleborg AB - Segment focus
SWOT

15.18 Wacker Chemie AG

Wacker Chemie AG - Overview
Wacker Chemie AG - Business segments
Wacker Chemie AG - Key offerings
Wacker Chemie AG - Segment focus
SWOT

16. Appendix

16.1 Scope of the report

Market definition
Objectives
Notes and caveats

16.2 Inclusions and exclusions checklist

Inclusions checklist
Exclusions checklist

16.3 Currency conversion rates for US$

16.4 Research methodology

16.5 Data procurement

Information sources

16.6 Data validation

16.7 Validation techniques employed for market sizing

16.8 Data synthesis

16.9 360 degree market analysis

16.10 List of abbreviations

Research Methodology

Technavio presents a detailed picture of the market by way of study, synthesis, and summation of data from multiple sources. The analysts have presented the various facets of the market with a particular focus on identifying the key industry influencers. The data thus presented is comprehensive, reliable, and the result of extensive research, both primary and secondary.

INFORMATION SOURCES

Primary sources

  • Manufacturers and suppliers
  • Channel partners
  • Industry experts
  • Strategic decision makers

Secondary sources

  • Industry journals and periodicals
  • Government data
  • Financial reports of key industry players
  • Historical data
  • Press releases

DATA ANALYSIS

Data Synthesis

  • Collation of data
  • Estimation of key figures
  • Analysis of derived insights

Data Validation

  • Triangulation with data models
  • Reference against proprietary databases
  • Corroboration with industry experts

REPORT WRITING

Qualitative

  • Market drivers
  • Market challenges
  • Market trends
  • Five forces analysis

Quantitative

  • Market size and forecast
  • Market segmentation
  • Geographical insights
  • Competitive landscape

Interested in this report?

Get your sample now to see our research methodology and insights!

Download Now

Frequently Asked Questions

Liquid Silicone Rubber market growth will increase by USD 2004.6 million during 2026-2030.

The Liquid Silicone Rubber market is expected to grow at a CAGR of 9.8% during 2026-2030.

Liquid Silicone Rubber market is segmented by Grade type (Industrial, Medical, Food) Application (Automotive, Medical, Electricals and electronics, Consumer goods, Others) Method (LSR injection molding, Transfer molding, Compression molding, Others)

3M Co., Apple Rubber Products Inc., Avantor Inc., CASCO BAY MOLDING, Compagnie de Saint Gobain SA, Dow Chemical Co., Elkem ASA, Freudenberg Medical LLC, HEXPOL AB, KCC SILICONE CORP, Laur Silicone Inc., Momentive Materials Inc., Parker Hannifin Corp., Reiss Manufacturing Inc., Shin Etsu Chemical Co. Ltd., SIMTEC Silicone Parts LLC, Specialty Silicone Products Inc., Stockwell Elastomerics Inc., Trelleborg AB, Vanguard Products Corp., Wacker Chemie AG are a few of the key vendors in the Liquid Silicone Rubber market.

North America will register the highest growth rate of 43.6% among the other regions. Therefore, the Liquid Silicone Rubber market in North America is expected to garner significant business opportunities for the vendors during the forecast period.

US, Canada, Mexico, Germany, France, UK, Italy, Spain, The Netherlands, China, Japan, India, South Korea, Indonesia, Australia, Saudi Arabia, UAE, South Africa, Turkey, Israel, Brazil, Argentina, Chile

  • Growing adoption in medical-device manufacturing is the driving factor this market.

The Liquid Silicone Rubber market vendors should focus on grabbing business opportunities from the Grade type segment as it accounted for the largest market share in the base year.
RIA - Research AI Assistant
Ask RIA
