Lithium-ion Battery Market Analysis, Size, and Forecast 2026-2030: APAC (China, Japan, and South Korea), Europe (Germany, France, and Italy), North America (US, Canada, and Mexico), South America (Brazil and Argentina), Middle East and Africa (South Africa, Saudi Arabia, and UAE), and Rest of World (ROW)

Lithium-ion Battery Market Analysis, Size, and Forecast 2026-2030:
APAC (China, Japan, and South Korea), Europe (Germany, France, and Italy), North America (US, Canada, and Mexico), South America (Brazil and Argentina), Middle East and Africa (South Africa, Saudi Arabia, and UAE), and Rest of World (ROW)

Published: Apr 2026 305 Pages SKU: IRTNTR41001

Market Overview at a Glance

$580.19 B
Market Opportunity
36.2%
CAGR 2025 - 2030
50.5%
APAC Growth
$53.30 B
Lithium nickel manganese cobalt segment 2024

Lithium-ion Battery Market Size 2026-2030

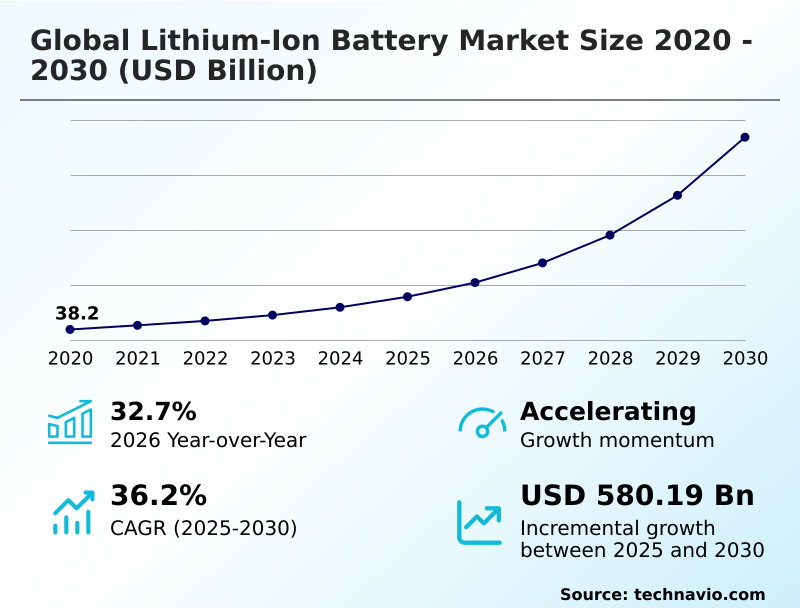
The lithium-ion battery market size is valued to increase by USD 580.19 billion, at a CAGR of 36.2% from 2025 to 2030. Accelerating electric vehicle adoption and infrastructure expansion will drive the lithium-ion battery market.

Major Market Trends & Insights

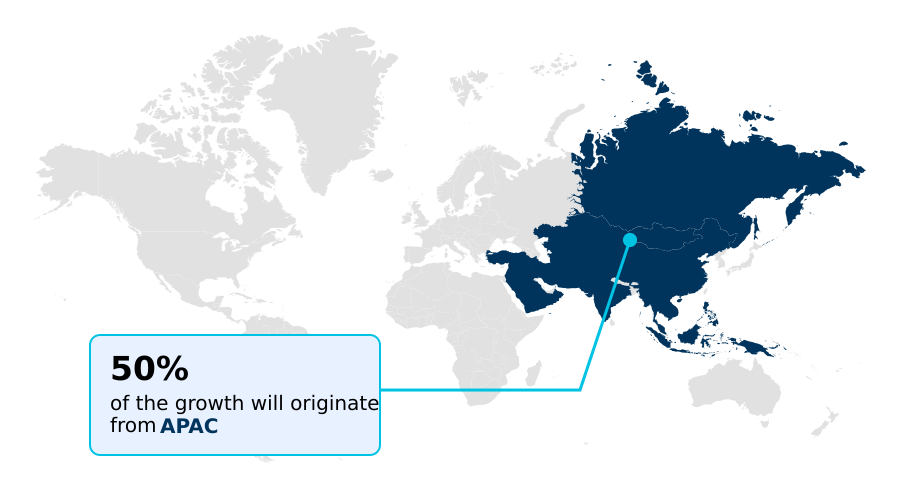
  • APAC dominated the market and accounted for a 50.5% growth during the forecast period.
  • By Type - Lithium nickel manganese cobalt segment was valued at USD 53.30 billion in 2024
  • By Application - Automotive segment accounted for the largest market revenue share in 2024

Market Size & Forecast

  • Market Opportunities: USD 699.29 billion
  • Market Future Opportunities: USD 580.19 billion
  • CAGR from 2025 to 2030 : 36.2%

Market Summary

  • The lithium-ion battery market is the linchpin of the global energy transition, primarily driven by the dual imperatives of transport electrification and grid modernization. Demand is bifurcated between high-density chemistries for electric vehicles and robust, long-cycle-life solutions for stationary energy storage systems.
  • A prevailing trend is the strategic shift toward safer and more cost-effective materials, which reduces dependence on volatile commodity markets. However, the industry grapples with significant supply chain risks stemming from the high geopolitical concentration of critical minerals. For instance, an automotive OEM navigating this landscape must balance performance with resilience.
  • This involves diversifying its portfolio to include both high-performance cells for premium models and dependable alternatives for standard-range vehicles, while simultaneously investing in regionalized battery circular economy initiatives to secure a stable, long-term supply of essential materials. This strategic recalibration of cell to pack design is essential for maintaining competitiveness and mitigating operational disruptions in a volatile global environment.

What will be the Size of the Lithium-ion Battery Market during the forecast period?

Get Key Insights on Market Forecast (PDF) Request Free Sample

How is the Lithium-ion Battery Market Segmented?

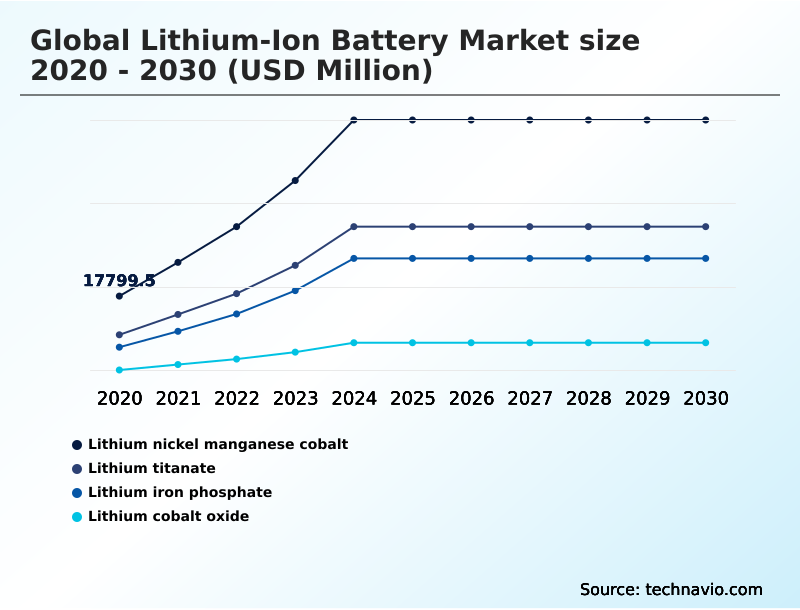
The lithium-ion battery industry research report provides comprehensive data (region-wise segment analysis), with forecasts and estimates in "USD million" for the period 2026-2030, as well as historical data from 2020-2024 for the following segments.

  • Type
    • Lithium nickel manganese cobalt
    • Lithium titanate
    • Lithium iron phosphate
    • Lithium cobalt oxide
  • Application
    • Automotive
    • Consumer electronics
    • Others
  • Power output
    • High
    • Medium
    • Low
  • Geography
    • APAC
      • China
      • Japan
      • South Korea
    • Europe
      • Germany
      • France
      • Italy
    • North America
      • US
      • Canada
      • Mexico
    • South America
      • Brazil
      • Argentina
    • Middle East and Africa
      • South Africa
      • Saudi Arabia
      • UAE
    • Rest of World (ROW)

By Type Insights

The lithium nickel manganese cobalt segment is estimated to witness significant growth during the forecast period.

The lithium nickel manganese cobalt segment is foundational to the high-performance electric vehicle industry, where energy density and driving range are primary performance indicators.

This chemistry allows manufacturers to fine-tune the ratio of nickel, manganese, and cobalt to achieve specific targets for automotive battery solutions, from cost optimization to maximum power output.

Research in high nickel cathode formulations has significantly enhanced structural stability, addressing historical challenges of capacity degradation. These advancements in cathode materials are essential for luxury and high-performance automotive segments.

Innovations in doping and coating technologies enable manufacturers to reduce cobalt reliance, mitigating supply chain risks. Breakthroughs in polymer binders now allow for manufacturing adjustments that reduce internal resistance by up to 40%, boosting charging efficiency.

Request Free Sample

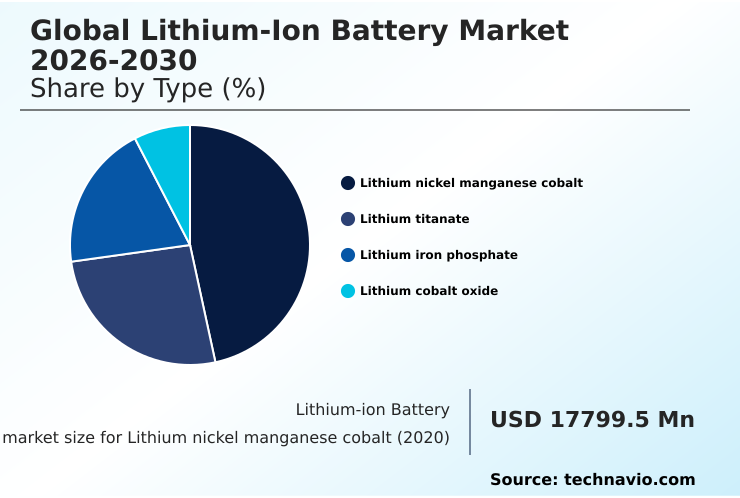
The Lithium nickel manganese cobalt segment was valued at USD 53.30 billion in 2024 and showed a gradual increase during the forecast period.

Request Free Sample

Regional Analysis

APAC is estimated to contribute 50.5% to the growth of the global market during the forecast period.Technavio’s analysts have elaborately explained the regional trends and drivers that shape the market during the forecast period.

See How Lithium-ion Battery Market Demand is Rising in APAC Request Free Sample

The geographic landscape is transitioning from a centralized model to a multi-polar ecosystem. APAC, which is forecast to contribute over 50% of incremental market growth, maintains its dominance through highly integrated supply chains for key components.

However, North America and Europe are rapidly closing the gap by localizing production of automotive battery solutions.

This strategic onshoring is accelerated by federal incentives aimed at building resilient domestic supply chains for precursor cathode materials and mitigating geopolitical risks associated with cobalt free blade battery technologies.

In Europe, the focus extends to grid stability, with nations like Germany adding over 6 GWh of new storage capacity in a single year to support renewable energy integration.

This regionalization fosters innovation in areas like high voltage architectures and thermal management systems, creating distinct competitive advantages beyond APAC.

Market Dynamics

Our researchers analyzed the data with 2025 as the base year, along with the key drivers, trends, and challenges. A holistic analysis of drivers will help companies refine their marketing strategies to gain a competitive advantage.

  • Navigating the global lithium-ion battery market 2026-2030 requires a nuanced understanding of its divergent application requirements and supply-side complexities. The demands of the global lithium-ion battery market 2026-2030 for automotive, which prioritizes energy density and fast charging, contrast sharply with the needs of the global lithium-ion battery market 2026-2030 for grid storage, where longevity and cost-effectiveness are paramount.
  • This divergence dictates choices among global lithium-ion battery market 2026-2030 chemistries, with high-performance nickel-based cells serving premium vehicles while LFP technology dominates stationary applications. These decisions are intrinsically linked to the global lithium-ion battery market 2026-2030 supply chain, which remains vulnerable due to its dependence on a few key regions for raw materials.
  • To mitigate this risk, leading firms are heavily investing in the global lithium-ion battery market 2026-2030 recycling processes to establish regional, closed-loop systems. For operational planning, companies that integrate recycled materials into their production achieve a significantly higher raw material security index compared to those solely reliant on virgin mineral imports.
  • This strategic shift not only enhances supply stability but also aligns with evolving regulatory mandates, positioning these firms for sustainable, long-term success.

What are the key market drivers leading to the rise in the adoption of Lithium-ion Battery Industry?

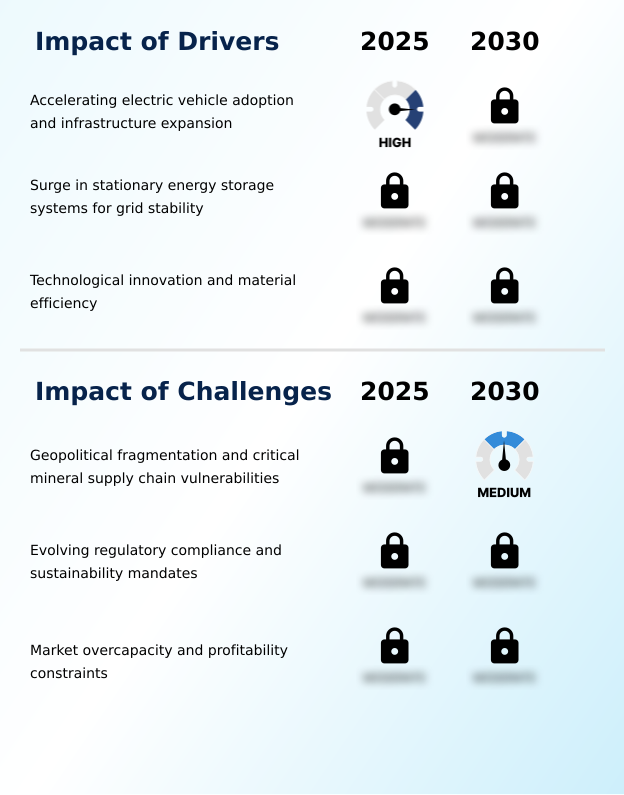
  • Accelerating electric vehicle adoption, coupled with the expansion of supporting infrastructure, serves as a key driver for market growth.

  • Market momentum is propelled by the global transition toward electric mobility, supported by government mandates and significant private investment in fast charging infrastructure and stationary energy storage systems.
  • A secondary driver is the rapid expansion of grid-scale storage to manage renewable energy intermittency, with deployments in major markets set to increase by over 50% year-over-year.
  • The third crucial driver is continuous technological innovation in areas like nickel based chemistries. For example, advanced visualization techniques for polymer binders within electrodes are enabling manufacturing adjustments that reduce internal resistance by up to 40%.
  • This directly improves charging efficiency and extends the cycle life of automotive battery solutions and other high-performance applications, enhancing the value proposition of closed loop supply chains.

What are the market trends shaping the Lithium-ion Battery Industry?

  • The market is experiencing a significant trend with the pervasive transition toward lithium iron phosphate chemistries. This shift is reshaping product strategies and supply chains across key applications.

  • Key market trends are reshaping the competitive landscape. A primary shift is the accelerated adoption of specific chemistries, which now account for 65% of new energy storage deployments due to their enhanced safety and cost-effectiveness, driving innovation in cell to pack design.
  • This pivot supports the institutionalization of a battery circular economy, where regulations mandating extended producer responsibility are becoming standard. Advanced hydrometallurgical processing facilities are achieving material recovery rates exceeding 95%, transforming end-of-life products into a secure source for cathode materials.
  • Concurrently, the integration of AI is optimizing manufacturing and enabling new business models such as battery as a service and second life energy storage. This synergy between hardware and software improves production yields and facilitates sophisticated grid scale energy management for all domain energy solutions.

What challenges does the Lithium-ion Battery Industry face during its growth?

  • Geopolitical fragmentation and vulnerabilities within critical mineral supply chains present a key challenge to the industry's growth trajectory.

  • The market confronts significant structural challenges that temper its growth potential. The geopolitical concentration of critical minerals creates systemic vulnerabilities for supply chains dependent on lithium cobalt oxide and other specialized chemistries, complicating the production of high purity sulfuric acid. Evolving regulations, such as mandates for a 70% recycling rate, impose heavy operational burdens and force costly product redesigns.
  • Furthermore, structural overcapacity, with global nameplate capacity exceeding demand by an estimated 900 GWh, has ignited fierce price competition. This pressure on margins erodes profitability and discourages long-term R&D investment in next-generation technologies like solid state batteries, threatening the viability of all but the largest, most integrated manufacturers and hindering the development of smart grid frameworks.

Exclusive Technavio Analysis on Customer Landscape

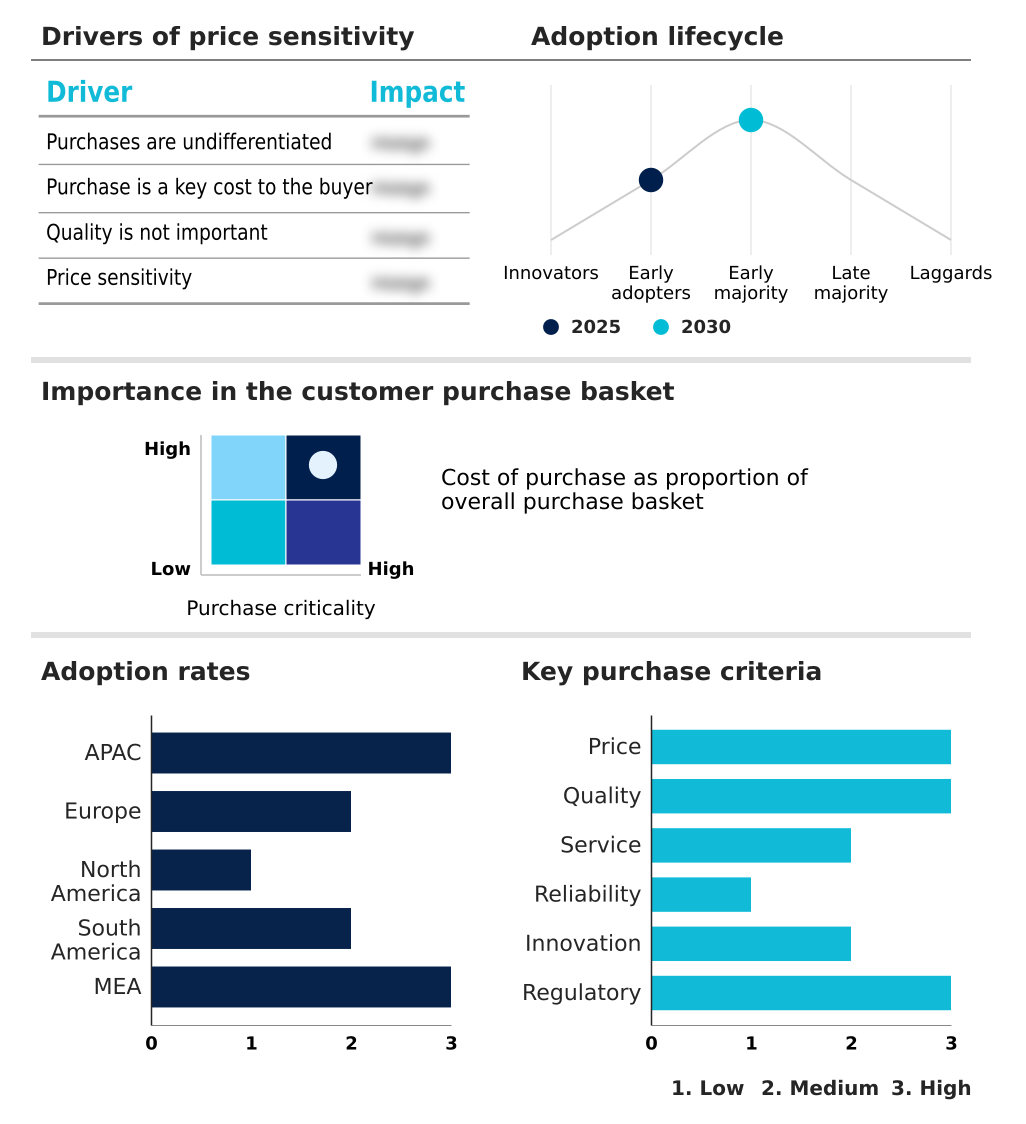
The lithium-ion battery market forecasting report includes the adoption lifecycle of the market, covering from the innovator’s stage to the laggard’s stage. It focuses on adoption rates in different regions based on penetration. Furthermore, the lithium-ion battery market report also includes key purchase criteria and drivers of price sensitivity to help companies evaluate and develop their market growth analysis strategies.

Customer Landscape of Lithium-ion Battery Industry

Competitive Landscape

Companies are implementing various strategies, such as strategic alliances, lithium-ion battery market forecast, partnerships, mergers and acquisitions, geographical expansion, and product/service launches, to enhance their presence in the industry.

Analog Devices Inc. - Specializes in high-precision battery management systems and power management ICs, delivering advanced solutions for sophisticated energy storage applications.

The industry research and growth report includes detailed analyses of the competitive landscape of the market and information about key companies, including:

  • Analog Devices Inc.
  • AVL List GmbH
  • BMS Powersafe
  • Elithion Inc.
  • Ewert Energy Systems Inc.
  • Flash Battery Srl
  • Gentherm Inc.
  • Infineon Technologies AG
  • Johnson Matthey Plc
  • Kurui New Energy Co. Ltd.
  • Lithium Balance AS
  • LithiumHub
  • Nuvation Energy
  • Panasonic Holdings Corp.
  • PowerTech Systems
  • Renesas Electronics Corp.
  • STAFL Systems LLC
  • Texas Instruments Inc.
  • Toshiba Corp.
  • Victron Energy BV

Qualitative and quantitative analysis of companies has been conducted to help clients understand the wider business environment as well as the strengths and weaknesses of key industry players. Data is qualitatively analyzed to categorize companies as pure play, category-focused, industry-focused, and diversified; it is quantitatively analyzed to categorize companies as dominant, leading, strong, tentative, and weak.

Recent Development and News in Lithium-ion battery market

  • In January 2025, General Motors entered into a substantial agreement with Vianode to secure synthetic graphite anode materials, enhancing the domestic supply chain for battery components.
  • In November 2024, Panasonic Energy announced a supply agreement with Zoox to provide cylindrical cells for its robotaxi fleets, marking a strategic entry into the autonomous mobility segment.
  • In December 2024, Adani Group initiated a 3.53 GWh battery storage project in India, underscoring the growing requirement for high-output systems to manage renewable energy integration.
  • In February 2025, the United States Energy Information Administration reported that developers planned to add significant utility-scale battery storage to the power grid, illustrating a strategic shift toward treating storage as a vital utility asset.

Dive into Technavio’s robust research methodology, blending expert interviews, extensive data synthesis, and validated models for unparalleled Lithium-ion Battery Market insights. See full methodology.

Market Scope
Page number 305
Base year 2025
Historic period 2020-2024
Forecast period 2026-2030
Growth momentum & CAGR Accelerate at a CAGR of 36.2%
Market growth 2026-2030 USD 580185.7 million
Market structure Fragmented
YoY growth 2025-2026(%) 32.7%
Key countries China, Japan, South Korea, India, Taiwan, Indonesia, Germany, France, Poland, Italy, UK, The Netherlands, US, Canada, Mexico, Brazil, Argentina, Chile, South Africa, Saudi Arabia, UAE, Israel and Turkey
Competitive landscape Leading Companies, Market Positioning of Companies, Competitive Strategies, and Industry Risks

Request Free Sample

Research Analyst Overview

  • The lithium-ion battery market’s trajectory is shaped by intense innovation across its core components and chemistries. For high-performance applications, development remains focused on lithium nickel manganese cobalt and high nickel cathode designs, which offer superior energy density but carry supply chain risks.
  • In contrast, mass-market applications are rapidly adopting lithium iron phosphate and, in specialized cases, lithium titanate, prioritizing safety, longevity, and cost over peak performance. This bifurcation presents a critical boardroom-level decision regarding product strategy and risk management.
  • A key factor influencing this is the evolving regulatory landscape, with mandates requiring up to a 70% recycling rate forcing a fundamental rethinking of product design. Companies must now engineer for disassembly, integrating cell to pack architectures and investing in hydrometallurgical processing.
  • This strategic imperative impacts the entire value chain, from R&D in solid state electrolyte and polymer binders to mitigating thermal runaway and implementing a digital battery passport to ensure compliance and supply chain transparency.

What are the Key Data Covered in this Lithium-ion Battery Market Research and Growth Report?

  • What is the expected growth of the Lithium-ion Battery Market between 2026 and 2030?

    • USD 580.19 billion, at a CAGR of 36.2%

  • What segmentation does the market report cover?

    • The report is segmented by Type (Lithium nickel manganese cobalt, Lithium titanate, Lithium iron phosphate, and Lithium cobalt oxide), Application (Automotive, Consumer electronics, and Others), Power Output (High, Medium, and Low) and Geography (APAC, Europe, North America, South America, Middle East and Africa)

  • Which regions are analyzed in the report?

    • APAC, Europe, North America, South America and Middle East and Africa

  • What are the key growth drivers and market challenges?

    • Accelerating electric vehicle adoption and infrastructure expansion, Geopolitical fragmentation and critical mineral supply chain vulnerabilities

  • Who are the major players in the Lithium-ion Battery Market?

    • Analog Devices Inc., AVL List GmbH, BMS Powersafe, Elithion Inc., Ewert Energy Systems Inc., Flash Battery Srl, Gentherm Inc., Infineon Technologies AG, Johnson Matthey Plc, Kurui New Energy Co. Ltd., Lithium Balance AS, LithiumHub, Nuvation Energy, Panasonic Holdings Corp., PowerTech Systems, Renesas Electronics Corp., STAFL Systems LLC, Texas Instruments Inc., Toshiba Corp. and Victron Energy BV

Market Research Insights

  • Market dynamics are defined by a strategic diversification in both technology and business models. The adoption of specific chemistries is increasingly application-driven, with certain types now accounting for 65% of new stationary deployments due to superior safety and longevity, enabling advanced grid scale energy management.
  • This specialization supports the institutionalization of a battery circular economy, where extended producer responsibility mandates are fostering a market for second life energy storage. Advanced recovery techniques now reclaim over 95% of critical materials, bolstering supply chain resilience. Concurrently, new models like battery as a service are emerging, powered by sophisticated battery health monitoring platforms.
  • These systems integrate with smart grid frameworks to optimize asset performance and create new revenue streams, moving the industry beyond simple hardware sales toward integrated, service-oriented power management integrated circuit solutions.

We can help! Our analysts can customize this lithium-ion battery market research report to meet your requirements.

Get in touch

1. Executive Summary

1.1 Market overview

Executive Summary - Chart on Market Overview
Executive Summary - Data Table on Market Overview
Executive Summary - Chart on Global Market Characteristics
Executive Summary - Chart on Market by Geography
Executive Summary - Chart on Market Segmentation by Type
Executive Summary - Chart on Market Segmentation by Application
Executive Summary - Chart on Market Segmentation by Power Output
Executive Summary - Chart on Incremental Growth
Executive Summary - Data Table on Incremental Growth
Executive Summary - Chart on Company Market Positioning

2. Technavio Analysis

2.1 Analysis of price sensitivity, lifecycle, customer purchase basket, adoption rates, and purchase criteria

2.2 Criticality of inputs and Factors of differentiation

Chart on Overview on criticality of inputs and factors of differentiation

2.3 Factors of disruption

Chart on Overview on factors of disruption

2.4 Impact of drivers and challenges

Chart on Impact of drivers and challenges in 2025 and 2030

3. Market Landscape

3.1 Market ecosystem

Chart on Parent Market
Data Table on - Parent Market

3.2 Market characteristics

Chart on Market characteristics analysis

3.3 Value chain analysis

Chart on Value chain analysis

4. Market Sizing

4.1 Market definition

Data Table on Offerings of companies included in the market definition

4.2 Market segment analysis

Market segments

4.3 Market size 2025

4.4 Market outlook: Forecast for 2025-2030

Chart on Global - Market size and forecast 2025-2030 ($ million)
Data Table on Global - Market size and forecast 2025-2030 ($ million)
Chart on Global Market: Year-over-year growth 2025-2030 (%)
Data Table on Global Market: Year-over-year growth 2025-2030 (%)

5. Historic Market Size

5.1 Global Lithium-Ion Battery Market 2020 - 2024

Historic Market Size - Data Table on Global Lithium-Ion Battery Market 2020 - 2024 ($ million)

5.2 Type segment analysis 2020 - 2024

Historic Market Size - Type Segment 2020 - 2024 ($ million)

5.3 Application segment analysis 2020 - 2024

Historic Market Size - Application Segment 2020 - 2024 ($ million)

5.4 Power Output segment analysis 2020 - 2024

Historic Market Size - Power Output Segment 2020 - 2024 ($ million)

5.5 Geography segment analysis 2020 - 2024

Historic Market Size - Geography Segment 2020 - 2024 ($ million)

5.6 Country segment analysis 2020 - 2024

Historic Market Size - Country Segment 2020 - 2024 ($ million)

6. Qualitative Analysis

6.1 Impact of AI on global lithium-ion battery market

6.2 Impact of geopolitical conflicts on global lithium-ion battery market

7. Five Forces Analysis

7.1 Five forces summary

Five forces analysis - Comparison between 2025 and 2030

7.2 Bargaining power of buyers

Bargaining power of buyers - Impact of key factors 2025 and 2030

7.3 Bargaining power of suppliers

Bargaining power of suppliers - Impact of key factors in 2025 and 2030

7.4 Threat of new entrants

Threat of new entrants - Impact of key factors in 2025 and 2030

7.5 Threat of substitutes

Threat of substitutes - Impact of key factors in 2025 and 2030

7.6 Threat of rivalry

Threat of rivalry - Impact of key factors in 2025 and 2030

7.7 Market condition

Chart on Market condition - Five forces 2025 and 2030

8. Market Segmentation by Type

8.1 Market segments

Chart on Type - Market share 2025-2030 (%)
Data Table on Type - Market share 2025-2030 (%)

8.2 Comparison by Type

Chart on Comparison by Type
Data Table on Comparison by Type

8.3 Lithium nickel manganese cobalt - Market size and forecast 2025-2030

Chart on Lithium nickel manganese cobalt - Market size and forecast 2025-2030 ($ million)
Data Table on Lithium nickel manganese cobalt - Market size and forecast 2025-2030 ($ million)
Chart on Lithium nickel manganese cobalt - Year-over-year growth 2025-2030 (%)
Data Table on Lithium nickel manganese cobalt - Year-over-year growth 2025-2030 (%)

8.4 Lithium titanate - Market size and forecast 2025-2030

Chart on Lithium titanate - Market size and forecast 2025-2030 ($ million)
Data Table on Lithium titanate - Market size and forecast 2025-2030 ($ million)
Chart on Lithium titanate - Year-over-year growth 2025-2030 (%)
Data Table on Lithium titanate - Year-over-year growth 2025-2030 (%)

8.5 Lithium iron phosphate - Market size and forecast 2025-2030

Chart on Lithium iron phosphate - Market size and forecast 2025-2030 ($ million)
Data Table on Lithium iron phosphate - Market size and forecast 2025-2030 ($ million)
Chart on Lithium iron phosphate - Year-over-year growth 2025-2030 (%)
Data Table on Lithium iron phosphate - Year-over-year growth 2025-2030 (%)

8.6 Lithium cobalt oxide - Market size and forecast 2025-2030

Chart on Lithium cobalt oxide - Market size and forecast 2025-2030 ($ million)
Data Table on Lithium cobalt oxide - Market size and forecast 2025-2030 ($ million)
Chart on Lithium cobalt oxide - Year-over-year growth 2025-2030 (%)
Data Table on Lithium cobalt oxide - Year-over-year growth 2025-2030 (%)

8.7 Market opportunity by Type

Market opportunity by Type ($ million)
Data Table on Market opportunity by Type ($ million)

9. Market Segmentation by Application

9.1 Market segments

Chart on Application - Market share 2025-2030 (%)
Data Table on Application - Market share 2025-2030 (%)

9.2 Comparison by Application

Chart on Comparison by Application
Data Table on Comparison by Application

9.3 Automotive - Market size and forecast 2025-2030

Chart on Automotive - Market size and forecast 2025-2030 ($ million)
Data Table on Automotive - Market size and forecast 2025-2030 ($ million)
Chart on Automotive - Year-over-year growth 2025-2030 (%)
Data Table on Automotive - Year-over-year growth 2025-2030 (%)

9.4 Consumer electronics - Market size and forecast 2025-2030

Chart on Consumer electronics - Market size and forecast 2025-2030 ($ million)
Data Table on Consumer electronics - Market size and forecast 2025-2030 ($ million)
Chart on Consumer electronics - Year-over-year growth 2025-2030 (%)
Data Table on Consumer electronics - Year-over-year growth 2025-2030 (%)

9.5 Others - Market size and forecast 2025-2030

Chart on Others - Market size and forecast 2025-2030 ($ million)
Data Table on Others - Market size and forecast 2025-2030 ($ million)
Chart on Others - Year-over-year growth 2025-2030 (%)
Data Table on Others - Year-over-year growth 2025-2030 (%)

9.6 Market opportunity by Application

Market opportunity by Application ($ million)
Data Table on Market opportunity by Application ($ million)

10. Market Segmentation by Power Output

10.1 Market segments

Chart on Power Output - Market share 2025-2030 (%)
Data Table on Power Output - Market share 2025-2030 (%)

10.2 Comparison by Power Output

Chart on Comparison by Power Output
Data Table on Comparison by Power Output

10.3 High - Market size and forecast 2025-2030

Chart on High - Market size and forecast 2025-2030 ($ million)
Data Table on High - Market size and forecast 2025-2030 ($ million)
Chart on High - Year-over-year growth 2025-2030 (%)
Data Table on High - Year-over-year growth 2025-2030 (%)

10.4 Medium - Market size and forecast 2025-2030

Chart on Medium - Market size and forecast 2025-2030 ($ million)
Data Table on Medium - Market size and forecast 2025-2030 ($ million)
Chart on Medium - Year-over-year growth 2025-2030 (%)
Data Table on Medium - Year-over-year growth 2025-2030 (%)

10.5 Low - Market size and forecast 2025-2030

Chart on Low - Market size and forecast 2025-2030 ($ million)
Data Table on Low - Market size and forecast 2025-2030 ($ million)
Chart on Low - Year-over-year growth 2025-2030 (%)
Data Table on Low - Year-over-year growth 2025-2030 (%)

10.6 Market opportunity by Power Output

Market opportunity by Power Output ($ million)
Data Table on Market opportunity by Power Output ($ million)

11. Customer Landscape

11.1 Customer landscape overview

Analysis of price sensitivity, lifecycle, customer purchase basket, adoption rates, and purchase criteria

12. Geographic Landscape

12.1 Geographic segmentation

Chart on Market share by geography 2025-2030 (%)
Data Table on Market share by geography 2025-2030 (%)

12.2 Geographic comparison

Chart on Geographic comparison
Data Table on Geographic comparison

12.3 APAC - Market size and forecast 2025-2030

Chart on APAC - Market size and forecast 2025-2030 ($ million)
Data Table on APAC - Market size and forecast 2025-2030 ($ million)
Chart on APAC - Year-over-year growth 2025-2030 (%)
Data Table on APAC - Year-over-year growth 2025-2030 (%)
Chart on Regional Comparison - APAC
Data Table on Regional Comparison - APAC

12.3.1 China - Market size and forecast 2025-2030

Chart on China - Market size and forecast 2025-2030 ($ million)
Data Table on China - Market size and forecast 2025-2030 ($ million)
Chart on China - Year-over-year growth 2025-2030 (%)
Data Table on China - Year-over-year growth 2025-2030 (%)

12.3.2 Japan - Market size and forecast 2025-2030

Chart on Japan - Market size and forecast 2025-2030 ($ million)
Data Table on Japan - Market size and forecast 2025-2030 ($ million)
Chart on Japan - Year-over-year growth 2025-2030 (%)
Data Table on Japan - Year-over-year growth 2025-2030 (%)

12.3.3 South Korea - Market size and forecast 2025-2030

Chart on South Korea - Market size and forecast 2025-2030 ($ million)
Data Table on South Korea - Market size and forecast 2025-2030 ($ million)
Chart on South Korea - Year-over-year growth 2025-2030 (%)
Data Table on South Korea - Year-over-year growth 2025-2030 (%)

12.3.4 India - Market size and forecast 2025-2030

Chart on India - Market size and forecast 2025-2030 ($ million)
Data Table on India - Market size and forecast 2025-2030 ($ million)
Chart on India - Year-over-year growth 2025-2030 (%)
Data Table on India - Year-over-year growth 2025-2030 (%)

12.3.5 Taiwan - Market size and forecast 2025-2030

Chart on Taiwan - Market size and forecast 2025-2030 ($ million)
Data Table on Taiwan - Market size and forecast 2025-2030 ($ million)
Chart on Taiwan - Year-over-year growth 2025-2030 (%)
Data Table on Taiwan - Year-over-year growth 2025-2030 (%)

12.3.6 Indonesia - Market size and forecast 2025-2030

Chart on Indonesia - Market size and forecast 2025-2030 ($ million)
Data Table on Indonesia - Market size and forecast 2025-2030 ($ million)
Chart on Indonesia - Year-over-year growth 2025-2030 (%)
Data Table on Indonesia - Year-over-year growth 2025-2030 (%)

12.4 Europe - Market size and forecast 2025-2030

Chart on Europe - Market size and forecast 2025-2030 ($ million)
Data Table on Europe - Market size and forecast 2025-2030 ($ million)
Chart on Europe - Year-over-year growth 2025-2030 (%)
Data Table on Europe - Year-over-year growth 2025-2030 (%)
Chart on Regional Comparison - Europe
Data Table on Regional Comparison - Europe

12.4.1 Germany - Market size and forecast 2025-2030

Chart on Germany - Market size and forecast 2025-2030 ($ million)
Data Table on Germany - Market size and forecast 2025-2030 ($ million)
Chart on Germany - Year-over-year growth 2025-2030 (%)
Data Table on Germany - Year-over-year growth 2025-2030 (%)

12.4.2 France - Market size and forecast 2025-2030

Chart on France - Market size and forecast 2025-2030 ($ million)
Data Table on France - Market size and forecast 2025-2030 ($ million)
Chart on France - Year-over-year growth 2025-2030 (%)
Data Table on France - Year-over-year growth 2025-2030 (%)

12.4.3 Poland - Market size and forecast 2025-2030

Chart on Poland - Market size and forecast 2025-2030 ($ million)
Data Table on Poland - Market size and forecast 2025-2030 ($ million)
Chart on Poland - Year-over-year growth 2025-2030 (%)
Data Table on Poland - Year-over-year growth 2025-2030 (%)

12.4.4 Italy - Market size and forecast 2025-2030

Chart on Italy - Market size and forecast 2025-2030 ($ million)
Data Table on Italy - Market size and forecast 2025-2030 ($ million)
Chart on Italy - Year-over-year growth 2025-2030 (%)
Data Table on Italy - Year-over-year growth 2025-2030 (%)

12.4.5 UK - Market size and forecast 2025-2030

Chart on UK - Market size and forecast 2025-2030 ($ million)
Data Table on UK - Market size and forecast 2025-2030 ($ million)
Chart on UK - Year-over-year growth 2025-2030 (%)
Data Table on UK - Year-over-year growth 2025-2030 (%)

12.4.6 The Netherlands - Market size and forecast 2025-2030

Chart on The Netherlands - Market size and forecast 2025-2030 ($ million)
Data Table on The Netherlands - Market size and forecast 2025-2030 ($ million)
Chart on The Netherlands - Year-over-year growth 2025-2030 (%)
Data Table on The Netherlands - Year-over-year growth 2025-2030 (%)

12.5 North America - Market size and forecast 2025-2030

Chart on North America - Market size and forecast 2025-2030 ($ million)
Data Table on North America - Market size and forecast 2025-2030 ($ million)
Chart on North America - Year-over-year growth 2025-2030 (%)
Data Table on North America - Year-over-year growth 2025-2030 (%)
Chart on Regional Comparison - North America
Data Table on Regional Comparison - North America

12.5.1 US - Market size and forecast 2025-2030

Chart on US - Market size and forecast 2025-2030 ($ million)
Data Table on US - Market size and forecast 2025-2030 ($ million)
Chart on US - Year-over-year growth 2025-2030 (%)
Data Table on US - Year-over-year growth 2025-2030 (%)

12.5.2 Canada - Market size and forecast 2025-2030

Chart on Canada - Market size and forecast 2025-2030 ($ million)
Data Table on Canada - Market size and forecast 2025-2030 ($ million)
Chart on Canada - Year-over-year growth 2025-2030 (%)
Data Table on Canada - Year-over-year growth 2025-2030 (%)

12.5.3 Mexico - Market size and forecast 2025-2030

Chart on Mexico - Market size and forecast 2025-2030 ($ million)
Data Table on Mexico - Market size and forecast 2025-2030 ($ million)
Chart on Mexico - Year-over-year growth 2025-2030 (%)
Data Table on Mexico - Year-over-year growth 2025-2030 (%)

12.6 South America - Market size and forecast 2025-2030

Chart on South America - Market size and forecast 2025-2030 ($ million)
Data Table on South America - Market size and forecast 2025-2030 ($ million)
Chart on South America - Year-over-year growth 2025-2030 (%)
Data Table on South America - Year-over-year growth 2025-2030 (%)
Chart on Regional Comparison - South America
Data Table on Regional Comparison - South America

12.6.1 Brazil - Market size and forecast 2025-2030

Chart on Brazil - Market size and forecast 2025-2030 ($ million)
Data Table on Brazil - Market size and forecast 2025-2030 ($ million)
Chart on Brazil - Year-over-year growth 2025-2030 (%)
Data Table on Brazil - Year-over-year growth 2025-2030 (%)

12.6.2 Argentina - Market size and forecast 2025-2030

Chart on Argentina - Market size and forecast 2025-2030 ($ million)
Data Table on Argentina - Market size and forecast 2025-2030 ($ million)
Chart on Argentina - Year-over-year growth 2025-2030 (%)
Data Table on Argentina - Year-over-year growth 2025-2030 (%)

12.6.3 Chile - Market size and forecast 2025-2030

Chart on Chile - Market size and forecast 2025-2030 ($ million)
Data Table on Chile - Market size and forecast 2025-2030 ($ million)
Chart on Chile - Year-over-year growth 2025-2030 (%)
Data Table on Chile - Year-over-year growth 2025-2030 (%)

12.7 Middle East and Africa - Market size and forecast 2025-2030

Chart on Middle East and Africa - Market size and forecast 2025-2030 ($ million)
Data Table on Middle East and Africa - Market size and forecast 2025-2030 ($ million)
Chart on Middle East and Africa - Year-over-year growth 2025-2030 (%)
Data Table on Middle East and Africa - Year-over-year growth 2025-2030 (%)
Chart on Regional Comparison - Middle East and Africa
Data Table on Regional Comparison - Middle East and Africa

12.7.1 South Africa - Market size and forecast 2025-2030

Chart on South Africa - Market size and forecast 2025-2030 ($ million)
Data Table on South Africa - Market size and forecast 2025-2030 ($ million)
Chart on South Africa - Year-over-year growth 2025-2030 (%)
Data Table on South Africa - Year-over-year growth 2025-2030 (%)

12.7.2 Saudi Arabia - Market size and forecast 2025-2030

Chart on Saudi Arabia - Market size and forecast 2025-2030 ($ million)
Data Table on Saudi Arabia - Market size and forecast 2025-2030 ($ million)
Chart on Saudi Arabia - Year-over-year growth 2025-2030 (%)
Data Table on Saudi Arabia - Year-over-year growth 2025-2030 (%)

12.7.3 UAE - Market size and forecast 2025-2030

Chart on UAE - Market size and forecast 2025-2030 ($ million)
Data Table on UAE - Market size and forecast 2025-2030 ($ million)
Chart on UAE - Year-over-year growth 2025-2030 (%)
Data Table on UAE - Year-over-year growth 2025-2030 (%)

12.7.4 Israel - Market size and forecast 2025-2030

Chart on Israel - Market size and forecast 2025-2030 ($ million)
Data Table on Israel - Market size and forecast 2025-2030 ($ million)
Chart on Israel - Year-over-year growth 2025-2030 (%)
Data Table on Israel - Year-over-year growth 2025-2030 (%)

12.7.5 Turkey - Market size and forecast 2025-2030

Chart on Turkey - Market size and forecast 2025-2030 ($ million)
Data Table on Turkey - Market size and forecast 2025-2030 ($ million)
Chart on Turkey - Year-over-year growth 2025-2030 (%)
Data Table on Turkey - Year-over-year growth 2025-2030 (%)

12.8 Market opportunity by geography

Market opportunity by geography ($ million)
Data Tables on Market opportunity by geography ($ million)

13. Drivers, Challenges, and Opportunity

13.1 Market drivers

Accelerating electric vehicle adoption and infrastructure expansion
Surge in stationary energy storage systems for grid stability
Technological innovation and material efficiency

13.2 Market challenges

Geopolitical fragmentation and critical mineral supply chain vulnerabilities
Evolving regulatory compliance and sustainability mandates
Market overcapacity and profitability constraints

13.3 Impact of drivers and challenges

Impact of drivers and challenges in 2025 and 2030

13.4 Market opportunities

Pervasive transition toward lithium iron phosphate (LFP) chemistries
Institutionalization of the battery circular economy
Integration of AI in manufacturing and grid management

14. Competitive Landscape

14.1 Overview

14.2

Overview on criticality of inputs and factors of differentiation

14.3 Landscape disruption

Overview on factors of disruption

14.4 Industry risks

Impact of key risks on business

15. Competitive Analysis

15.1 Companies profiled

Companies covered

15.2 Company ranking index

15.3 Market positioning of companies

Matrix on companies position and classification

15.4 Analog Devices Inc.

Analog Devices Inc. - Overview
Analog Devices Inc. - Business segments
Analog Devices Inc. - Key offerings
Analog Devices Inc. - Segment focus
SWOT

15.5 AVL List GmbH

AVL List GmbH - Overview
AVL List GmbH - Product / Service
AVL List GmbH - Key offerings
SWOT

15.6 Elithion Inc.

Elithion Inc. - Overview
Elithion Inc. - Product / Service
Elithion Inc. - Key offerings
SWOT

15.7 Ewert Energy Systems Inc.

Ewert Energy Systems Inc. - Overview
Ewert Energy Systems Inc. - Product / Service
Ewert Energy Systems Inc. - Key offerings
SWOT

15.8 Flash Battery Srl

Flash Battery Srl - Overview
Flash Battery Srl - Product / Service
Flash Battery Srl - Key offerings
SWOT

15.9 Gentherm Inc.

Gentherm Inc. - Overview
Gentherm Inc. - Business segments
Gentherm Inc. - Key offerings
Gentherm Inc. - Segment focus
SWOT

15.10 Infineon Technologies AG

Infineon Technologies AG - Overview
Infineon Technologies AG - Business segments
Infineon Technologies AG - Key news
Infineon Technologies AG - Key offerings
Infineon Technologies AG - Segment focus
SWOT

15.11 Johnson Matthey Plc

Johnson Matthey Plc - Overview
Johnson Matthey Plc - Business segments
Johnson Matthey Plc - Key offerings
Johnson Matthey Plc - Segment focus
SWOT

15.12 Panasonic Holdings Corp.

Panasonic Holdings Corp. - Overview
Panasonic Holdings Corp. - Business segments
Panasonic Holdings Corp. - Key news
Panasonic Holdings Corp. - Key offerings
Panasonic Holdings Corp. - Segment focus
SWOT

15.13 PowerTech Systems

PowerTech Systems - Overview
PowerTech Systems - Product / Service
PowerTech Systems - Key offerings
SWOT

15.14 Renesas Electronics Corp.

Renesas Electronics Corp. - Overview
Renesas Electronics Corp. - Business segments
Renesas Electronics Corp. - Key offerings
Renesas Electronics Corp. - Segment focus
SWOT

15.15 STAFL Systems LLC

STAFL Systems LLC - Overview
STAFL Systems LLC - Product / Service
STAFL Systems LLC - Key offerings
SWOT

15.16 Texas Instruments Inc.

Texas Instruments Inc. - Overview
Texas Instruments Inc. - Business segments
Texas Instruments Inc. - Key offerings
Texas Instruments Inc. - Segment focus
SWOT

15.17 Toshiba Corp.

Toshiba Corp. - Overview
Toshiba Corp. - Product / Service
Toshiba Corp. - Key offerings
SWOT

15.18 Victron Energy BV

Victron Energy BV - Overview
Victron Energy BV - Product / Service
Victron Energy BV - Key offerings
SWOT

16. Appendix

16.1 Scope of the report

Market definition
Objectives
Notes and caveats

16.2 Inclusions and exclusions checklist

Inclusions checklist
Exclusions checklist

16.3 Currency conversion rates for US$

16.4 Research methodology

16.5 Data procurement

Information sources

16.6 Data validation

16.7 Validation techniques employed for market sizing

16.8 Data synthesis

16.9 360 degree market analysis

16.10 List of abbreviations

Research Methodology

Technavio presents a detailed picture of the market by way of study, synthesis, and summation of data from multiple sources. The analysts have presented the various facets of the market with a particular focus on identifying the key industry influencers. The data thus presented is comprehensive, reliable, and the result of extensive research, both primary and secondary.

INFORMATION SOURCES

Primary sources

  • Manufacturers and suppliers
  • Channel partners
  • Industry experts
  • Strategic decision makers

Secondary sources

  • Industry journals and periodicals
  • Government data
  • Financial reports of key industry players
  • Historical data
  • Press releases

DATA ANALYSIS

Data Synthesis

  • Collation of data
  • Estimation of key figures
  • Analysis of derived insights

Data Validation

  • Triangulation with data models
  • Reference against proprietary databases
  • Corroboration with industry experts

REPORT WRITING

Qualitative

  • Market drivers
  • Market challenges
  • Market trends
  • Five forces analysis

Quantitative

  • Market size and forecast
  • Market segmentation
  • Geographical insights
  • Competitive landscape

Interested in this report?

Get your sample now to see our research methodology and insights!

Download Now

Frequently Asked Questions

Lithium-ion Battery market growth will increase by USD 580185.7 million during 2026-2030.

The Lithium-ion Battery market is expected to grow at a CAGR of 36.2% during 2026-2030.

Lithium-ion Battery market is segmented by Type (Lithium nickel manganese cobalt, Lithium titanate, Lithium iron phosphate, Lithium cobalt oxide) Application (Automotive, Consumer electronics, Others) Power output (High, Medium, Low)

Analog Devices Inc., AVL List GmbH, BMS Powersafe, Elithion Inc., Ewert Energy Systems Inc., Flash Battery Srl, Gentherm Inc., Infineon Technologies AG, Johnson Matthey Plc, Kurui New Energy Co. Ltd., Lithium Balance AS, LithiumHub, Nuvation Energy, Panasonic Holdings Corp., PowerTech Systems, Renesas Electronics Corp., STAFL Systems LLC, Texas Instruments Inc., Toshiba Corp., Victron Energy BV are a few of the key vendors in the Lithium-ion Battery market.

APAC will register the highest growth rate of 50.5% among the other regions. Therefore, the Lithium-ion Battery market in APAC is expected to garner significant business opportunities for the vendors during the forecast period.

China, Japan, South Korea, India, Taiwan, Indonesia, Germany, France, Poland, Italy, UK, The Netherlands, US, Canada, Mexico, Brazil, Argentina, Chile, South Africa, Saudi Arabia, UAE, Israel, Turkey

  • Accelerating electric vehicle adoption and infrastructure expansion is the driving factor this market.

The Lithium-ion Battery market vendors should focus on grabbing business opportunities from the Type segment as it accounted for the largest market share in the base year.
RIA - Research AI Assistant
Ask RIA