Marine Battery Market Analysis, Size, and Forecast 2026-2030: Europe (Germany, UK, and France), North America (US, Canada, and Mexico), APAC (China, Japan, and South Korea), Middle East and Africa (Saudi Arabia, UAE, and Turkey), South America (Brazil, Argentina, and Chile), and Rest of World (ROW)

Marine Battery Market Analysis, Size, and Forecast 2026-2030:
Europe (Germany, UK, and France), North America (US, Canada, and Mexico), APAC (China, Japan, and South Korea), Middle East and Africa (Saudi Arabia, UAE, and Turkey), South America (Brazil, Argentina, and Chile), and Rest of World (ROW)

Published: Oct 2026 289 Pages SKU: IRTNTR73923

Market Overview at a Glance

$585.65 Mn
Market Opportunity
14.8%
CAGR 2025 - 2030
53.6%
Europe Growth
$477.60 Mn
Commercial segment 2024

Marine Battery Market Size 2026-2030

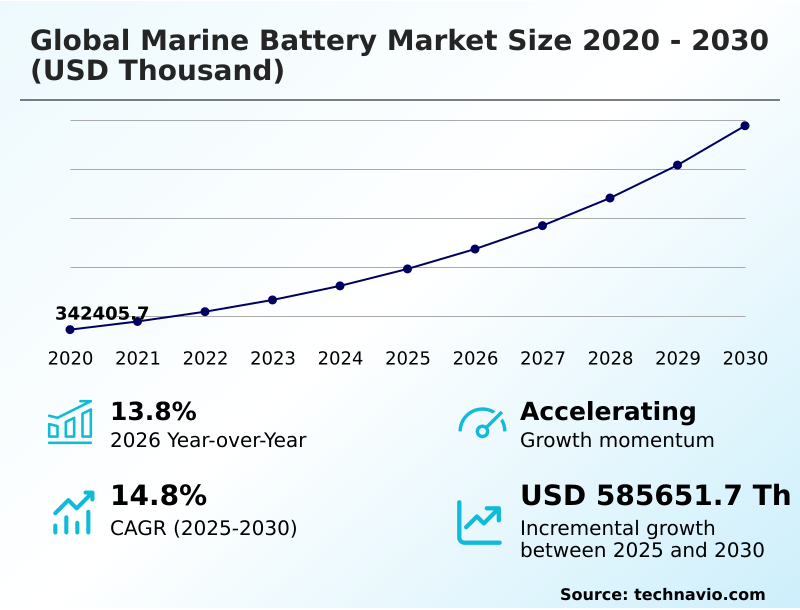
The marine battery market size is valued to increase by USD 585.65 million, at a CAGR of 14.8% from 2025 to 2030. Decarbonization mandates and global maritime emission rules will drive the marine battery market.

Major Market Trends & Insights

  • Europe dominated the market and accounted for a 53.6% growth during the forecast period.
  • By Application - Commercial segment was valued at USD 477.60 million in 2024
  • By Battery Type - Lithium-ion segment accounted for the largest market revenue share in 2024

Market Size & Forecast

  • Market Opportunities:
  • Market Future Opportunities: USD 585.65 million
  • CAGR from 2025 to 2030 : 14.8%

Market Summary

  • The Marine Battery Market operates as a critical enabler of maritime electrification, driven by the immediate necessity to transition commercial and defense fleets toward sustainable propulsion frameworks. Shipowners actively prioritize heavy fuel oil displacement to align with stringent international environmental frameworks, deploying high-capacity energy storage systems across extensive fleet retrofit projects.
  • This operational shift directly addresses the critical zero emission berth requirement enforced across major international ports. Consequently, vessels utilizing advanced energy storage achieve up to a 20% improvement in fuel efficiency compared to traditional diesel-mechanical systems. Decarbonization mandates serve as the primary driver, compelling operators to adopt marine gas oil alternatives to ensure greenhouse gas emission reduction.
  • Conversely, high capital expenditures and complex structural modification requirements present significant commercial challenges, delaying widespread adoption among cost-sensitive operators. Specialized maritime engineering firms continue to refine thermal management and cell integration technologies to overcome these barriers. Ultimately, the rapid expansion of localized port charging infrastructure further solidifies the economic viability of fully electric coastal ferry operations.

What will be the Size of the Marine Battery Market during the forecast period?
Get Key Insights on Market Forecast (PDF) Get Free Sample

How is the Marine Battery Market Segmented?

The marine battery industry research report provides comprehensive data (region-wise segment analysis), with forecasts and estimates in "USD thousand" for the period 2026-2030, as well as historical data from 2020-2024 for the following segments.

  • Application
    • Commercial
    • Defense
  • Battery type
    • Lithium-ion
    • Lead-acid
    • Nickel-based
    • Others
  • Propulsion
    • Conventional
    • Hybrid
    • Fully electric
  • Geography
    • Europe
      • Germany
      • UK
      • France
      • The Netherlands
      • Italy
      • Spain
    • North America
      • US
      • Canada
      • Mexico
    • APAC
      • China
      • Japan
      • South Korea
      • India
      • Australia
      • Indonesia
    • Middle East and Africa
      • Saudi Arabia
      • UAE
      • Turkey
      • South Africa
      • Israel
    • South America
      • Brazil
      • Argentina
      • Chile

By Application Insights

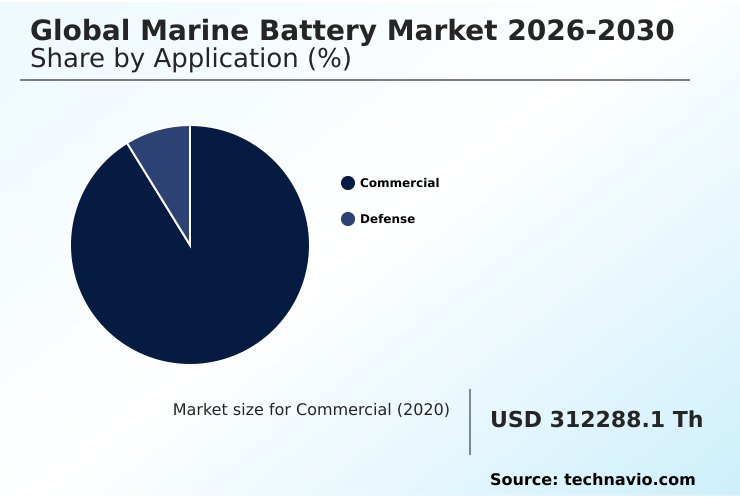
The commercial segment is estimated to witness significant growth during the forecast period.

The commercial segment acts as the primary catalyst for maritime electrification, driven by the rapid transitioning of passenger ferries, tugboats, and offshore support vessels toward sustainable power platforms.

Commercial vessel operators face tightening maritime decarbonization mandates from international governing bodies, necessitating an immediate shift from traditional heavy fuel oil to advanced lithium ion marine battery solutions.

High-capacity energy storage architectures, specifically leveraging lithium iron phosphate chemistry, are extensively deployed to enable zero emission port operation and dynamic peak shaving load optimization.

Integrating these advanced power units allows fleet managers to lower operational maintenance expenses by approximately 15% compared to legacy diesel configurations.

Effective battery management system integration ensures commercial shipping electrification progresses rapidly, delivering reliable power while adhering to strict environmental compliance targets across international maritime routes.
Get Free Sample

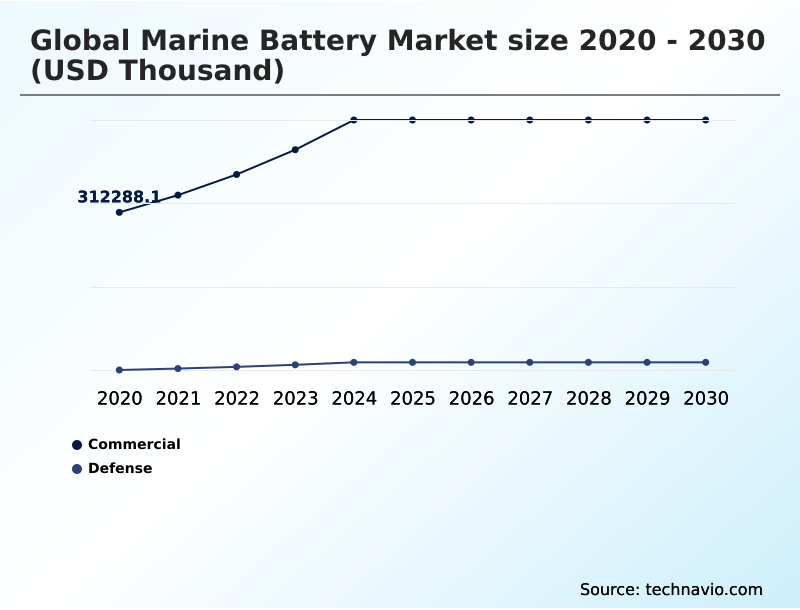
The Commercial segment was valued at USD 477.60 million in 2024 and showed a gradual increase during the forecast period.
Get Free Sample

Regional Analysis

Europe is estimated to contribute 53.6% to the growth of the global market during the forecast period.Technavio’s analysts have elaborately explained the regional trends and drivers that shape the market during the forecast period.
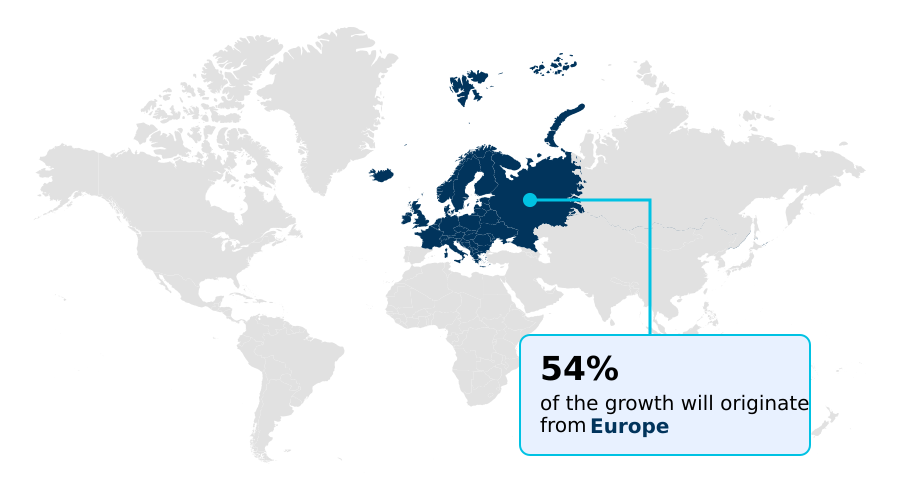
See How Marine Battery Market Demand is Rising in Europe Get Free Sample

Regional dynamics within the Marine Battery landscape reflect divergent regulatory pressures and charging infrastructure maturity levels across different territories.

Europe leads the transition by aggressively deploying low emission propulsion platforms across extensive short sea shipping routes, achieving a 30% higher regional penetration rate for fully electric passenger ferries compared to North America.

Fleet operators in Europe prioritize lifecycle cost reduction through optimized offshore support vessel power architectures, effectively utilizing government incentives to offset initial capital barriers.

Conversely, operators in North America heavily leverage energy storage primarily for uninterruptible power supply functions and peak shaving applications. The ongoing merchant fleet replacement cycle in both regions necessitates complex hull weight distribution recalculation to accommodate heavy battery racks.

Consequently, European shipyards have improved their retrofitting efficiency by 15% over APAC facilities, establishing a highly streamlined supply chain that accelerates the delivery of certified, zero-emission maritime power solutions to environmentally conscious shipowners.

Market Dynamics

Our researchers analyzed the data with 2025 as the base year, along with the key drivers, trends, and challenges. A holistic analysis of drivers will help companies refine their marketing strategies to gain a competitive advantage.

  • The transition toward sustainable maritime operations relies heavily on the deployment of high capacity marine energy storage architectures across commercial and defense fleets. Modern fleet managers recognize that securing an advanced lithium ion marine battery significantly elevates operational reliability while strictly adhering to evolving environmental compliance frameworks.
  • As international shipping lanes become subject to aggressive decarbonization targets, the demand for a comprehensive commercial maritime electrification retrofit solution has expanded exponentially. Engineering teams report that vessels equipped with modernized energy storage experience a 20% higher operational efficiency ratio compared to legacy diesel-dependent fleets, drastically reducing localized harbor pollution and acoustic signatures.
  • The successful execution of hybrid marine propulsion system integration requires meticulous planning involving thermal management, weight distribution, and power grid synchronization to ensure maximum lifecycle durability. These sophisticated engineering practices have paved the way for the widespread commercialization of the zero emission electric passenger ferry, which operates seamlessly within sensitive coastal archipelagos and urban waterways.
  • By prioritizing robust safety certifications and modular pack designs, system integrators allow vessel owners to mitigate long-term fuel volatility risks and lower routine maintenance expenditures. This strategic pivot toward electrification not only satisfies stringent regulatory mandates but also establishes a highly resilient, future-proof maritime transportation infrastructure capable of supporting the next generation of environmentally conscious commercial shipping networks.
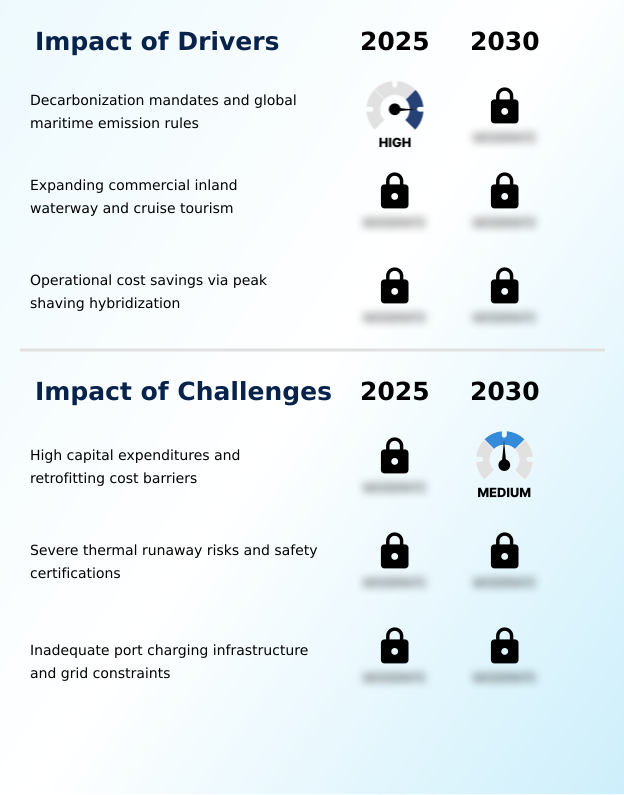
What are the key market drivers leading to the rise in the adoption of Marine Battery Industry?

  • Decarbonization mandates and stringent global maritime emission rules serve as the primary drivers propelling the adoption of advanced marine energy storage systems.

  • Stringent international decarbonization mandates act as the primary catalyst propelling the global maritime energy transition and accelerating the deployment of heavy-duty energy storage systems.
  • Fleet operators must integrate a highly certified marine grade battery pack to strictly adhere to new emission control area regulations, dramatically reducing harbor pollution.
  • This regulatory pressure has driven operators to leverage the nickel manganese cobalt formulation, which improves auxiliary navigation power backup efficiency by up to 18% compared to legacy lead-acid alternatives.
  • Expanding rapid charging infrastructure capability at major commercial ports ensures reliable engine cranking power requirement fulfillment, allowing vessels to shut down diesel generators entirely while berthed.
  • Consequently, ships utilizing these advanced storage architectures experience a 25% reduction in localized fuel consumption, transforming regulatory compliance into a distinct operational cost advantage.

What are the market trends shaping the Marine Battery Industry?

  • The adoption of lithium iron phosphate battery chemistry has emerged as a prominent technological trend within the maritime sector. This transition enhances thermal stability and extends the operational lifecycle of marine energy storage systems.

  • The rapid commercial adoption of modular containerized energy storage represents a transformative technological trend reshaping the Marine Battery landscape. Fleet operators are migrating toward these self-contained units to expedite shipyard installations, reducing vessel dry docking downtime by approximately 20% during complex retrofitting procedures.
  • Continuous advancements in electrochemical cell manufacturing have vastly improved the gravimetric energy density metric, allowing naval architects to maximize cargo capacity without compromising high cycle life durability. This structural shift is primarily driven by the need to optimize short sea shipping route operations while adhering to strict environmental mandates.
  • Furthermore, the integration of advanced thermal runaway containment encasement and a standardized shore power charging interface has enhanced overall system safety ratings by 15%. These technological innovations empower commercial shipowners to seamlessly execute zero-emission coastal transits, significantly lowering routine maintenance overhead and ensuring long-term operational resilience.

What challenges does the Marine Battery Industry face during its growth?

  • High capital expenditures and complex retrofitting cost barriers constitute significant challenges that constrain the rapid expansion of the maritime energy storage industry.

  • The widespread execution of heavy fuel oil displacement strategies faces significant commercial headwinds due to the massive upfront capital expenditures required for maritime energy storage integration. Retrofitting legacy commercial vessels extends vessel dry docking downtime by an average of 15%, heavily inflating shipyard labor expenses and disrupting lucrative charter schedules.
  • Achieving meaningful greenhouse gas emission reduction is further constrained by the severe lack of standardized port charging infrastructure across developing international trade routes. The complexities of executing seamless smart grid charging integration often require complete overhauls of onboard electrical distribution networks, elevating initial integration costs by 20%.
  • Until structural manufacturing expenses decrease and charging accessibility improves, these formidable financial and engineering barriers will continue to delay comprehensive compliance with evolving maritime decarbonization mandates across bulk cargo fleets.

Exclusive Technavio Analysis on Customer Landscape

The marine battery market forecasting report includes the adoption lifecycle of the market, covering from the innovator’s stage to the laggard’s stage. It focuses on adoption rates in different regions based on penetration. Furthermore, the marine battery market report also includes key purchase criteria and drivers of price sensitivity to help companies evaluate and develop their market growth analysis strategies.
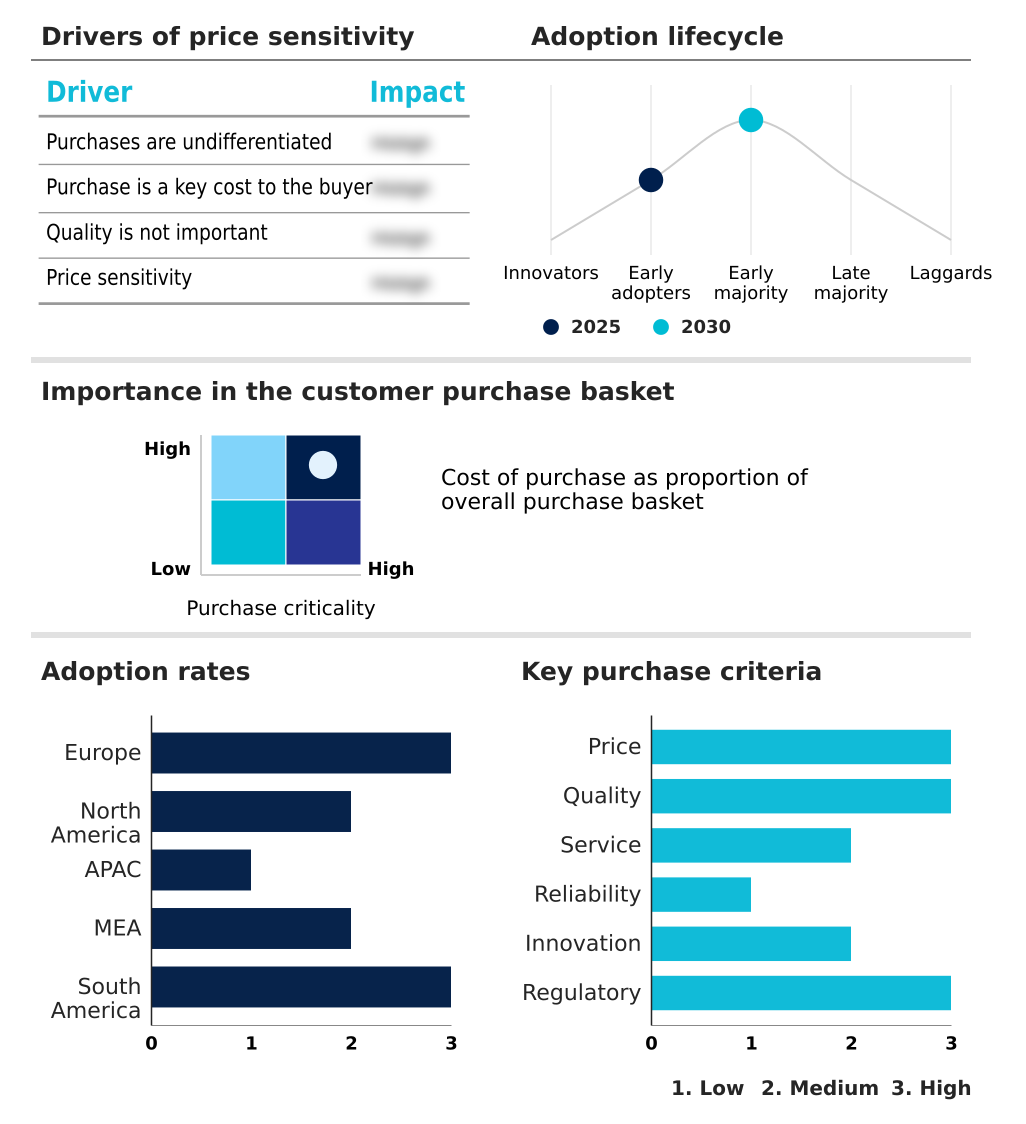
Customer Landscape of Marine Battery Industry

Competitive Landscape

Companies are implementing various strategies, such as strategic alliances, marine battery market forecast, partnerships, mergers and acquisitions, geographical expansion, and product/service launches, to enhance their presence in the industry.

ABB Ltd. - The organization provides advanced lithium-ion energy storage systems and marine battery architectures engineered to optimize vessel electrification, enhance operational efficiency, and support sustainable hybrid maritime propulsion solutions.

The industry research and growth report includes detailed analyses of the competitive landscape of the market and information about key companies, including:

  • ABB Ltd.
  • CLARIOS LLC
  • Contemporary Amperex Ltd.
  • Corvus Energy
  • East Penn Manufacture Co. Inc.
  • Echandia Marine AB
  • EnerSys Inc.
  • EST Floattech BV
  • Exide Technologies
  • GS Yuasa International Ltd.
  • Leclanche SA
  • Lithion Battery Inc.
  • Mastervolt International B.V.
  • PowerTech Systems
  • Saft Groupe SAS
  • Siemens Energy AG
  • The Furukawa Battery Co. Ltd.
  • Torqeedo GmbH
  • Victron Energy BV
  • Wartsila Corp.

Qualitative and quantitative analysis of companies has been conducted to help clients understand the wider business environment as well as the strengths and weaknesses of key industry players. Data is qualitatively analyzed to categorize companies as pure play, category-focused, industry-focused, and diversified; it is quantitatively analyzed to categorize companies as dominant, leading, strong, tentative, and weak.

Recent Development and News in Marine battery market

  • In the Renewable Electricity industry, the aggressive deployment of automated high-voltage onshore power supply networks has expanded port charging infrastructure capabilities, directly impacting Marine Battery demand by enabling commercial fleets to achieve 100% zero-emission berth compliance.
  • Stringent environmental regulations enforcing greenhouse gas intensity limits have established new green shipping corridors, compelling maritime operators to integrate high-density energy storage architectures that improve vessel energy efficiency by up to 25% during coastal transits.
  • Advancements in modular containerized energy storage manufacturing have streamlined rapid deployment capabilities for offshore wind service vessels, accelerating Marine Battery adoption by reducing shipyard installation timelines by nearly 20% across hybrid retrofit projects.
  • The standardization of smart grid charging integration protocols across international terminals has bolstered international maritime organization compliance strategies, driving Marine Battery market expansion by ensuring seamless shore-to-ship power transfer and lowering auxiliary fuel consumption by 15%.

Dive into Technavio’s robust research methodology, blending expert interviews, extensive data synthesis, and validated models for unparalleled Marine Battery Market insights. See full methodology.

Market Scope
Page number 289
Base year 2025
Historic period 2020-2024
Forecast period 2026-2030
Growth momentum & CAGR Accelerate at a CAGR of 14.8%
Market growth 2026-2030 USD 585651.7 thousand
Market structure Fragmented
YoY growth 2025-2026(%) 13.8%
Key countries Germany, UK, France, The Netherlands, Italy, Spain, US, Canada, Mexico, China, Japan, South Korea, India, Australia, Indonesia, Saudi Arabia, UAE, Turkey, South Africa, Israel, Brazil, Argentina and Chile
Competitive landscape Leading Companies, Market Positioning of Companies, Competitive Strategies, and Industry Risks

Request Free Sample

Research Analyst Overview

  • The Marine Battery ecosystem is experiencing a structural evolution as commercial shipowners accelerate the deployment of advanced hybrid electric propulsion architecture systems to meet stringent decarbonization mandates. Fleet executives are increasingly aligning capital budgeting strategies with inland waterway vessel hybridization to mitigate volatile fuel expenses and ensure long-term regulatory compliance.
  • The integration of highly efficient liquid cooling thermal management systems has become a critical operational requirement, yielding a 25% improvement in thermal stability and cycle life retention compared to legacy air-cooled configurations. This technological advancement directly facilitates harbor tugboat electrification, allowing operators to execute zero-emission port maneuvers while maintaining maximum bollard pull capabilities.
  • Furthermore, incorporating energy storage for spinning reserve power support enables dynamic positioning energy optimization, drastically reducing diesel generator runtime during offshore operations. Achieving strict maritime safety certification compliance remains a paramount boardroom priority, dictating rigorous vendor selection protocols and structural engineering assessments.
  • Ultimately, deploying these advanced power management solutions empowers maritime operators to significantly lower operational lifecycle costs while establishing resilient, environmentally sustainable shipping profiles.

What are the Key Data Covered in this Marine Battery Market Research and Growth Report?

  • What is the expected growth of the Marine Battery Market between 2026 and 2030?

    • USD 585.65 million, at a CAGR of 14.8%

  • What segmentation does the market report cover?

    • The report is segmented by Application (Commercial, and Defense), Battery Type (Lithium-ion, Lead-acid, Nickel-based, and Others), Propulsion (Conventional, Hybrid, and Fully electric) and Geography (Europe, North America, APAC, Middle East and Africa, South America)

  • Which regions are analyzed in the report?

    • Europe, North America, APAC, Middle East and Africa and South America

  • What are the key growth drivers and market challenges?

    • Decarbonization mandates and global maritime emission rules, High capital expenditures and retrofitting cost barriers

  • Who are the major players in the Marine Battery Market?

    • ABB Ltd., CLARIOS LLC, Contemporary Amperex Ltd., Corvus Energy, East Penn Manufacture Co. Inc., Echandia Marine AB, EnerSys Inc., EST Floattech BV, Exide Technologies, GS Yuasa International Ltd., Leclanche SA, Lithion Battery Inc., Mastervolt International B.V., PowerTech Systems, Saft Groupe SAS, Siemens Energy AG, The Furukawa Battery Co. Ltd., Torqeedo GmbH, Victron Energy BV and Wartsila Corp.

Market Research Insights

  • The Marine Battery landscape is rapidly transforming as vessel operators integrate advanced energy storage to ensure coastal ecosystem preservation and regulatory compliance. Modernizing the shipboard power distribution grid enables operators to reduce auxiliary fuel consumption by up to 18% during harbor transits.
  • Implementing a highly responsive battery fire suppression system has improved overall thermal safety ratings by 25%, boosting operator confidence in hybrid propulsion architectures. However, complex naval architecture structural modification requirements often extend initial dry-docking schedules by 10% compared to standard maintenance overhauls.
  • These critical operational enhancements drive long-term cost reductions and elevate fleet reliability, establishing advanced maritime energy storage as a fundamental component of modern, sustainable commercial shipping strategies.

We can help! Our analysts can customize this marine battery market research report to meet your requirements.

Get in touch

1. Executive Summary

1.1 Market overview

Executive Summary - Chart on Market Overview
Executive Summary - Data Table on Market Overview
Executive Summary - Chart on Global Market Characteristics
Executive Summary - Chart on Market by Geography
Executive Summary - Chart on Market Segmentation by Application
Executive Summary - Chart on Market Segmentation by Battery Type
Executive Summary - Chart on Market Segmentation by Propulsion
Executive Summary - Chart on Incremental Growth
Executive Summary - Data Table on Incremental Growth
Executive Summary - Chart on Company Market Positioning

2. Technavio Analysis

2.1 Analysis of price sensitivity, lifecycle, customer purchase basket, adoption rates, and purchase criteria

2.2 Criticality of inputs and Factors of differentiation

Chart on Overview on criticality of inputs and factors of differentiation

2.3 Factors of disruption

Chart on Overview on factors of disruption

2.4 Impact of drivers and challenges

Chart on Impact of drivers and challenges in 2025 and 2030

3. Market Landscape

3.1 Market ecosystem

Chart on Parent Market
Data Table on - Parent Market

3.2 Market characteristics

Chart on Market characteristics analysis

3.3 Value chain analysis

Chart on Value chain analysis

4. Market Sizing

4.1 Market definition

Data Table on Offerings of companies included in the market definition

4.2 Market segment analysis

Market segments

4.3 Market size 2025

4.4 Market outlook: Forecast for 2025-2030

Chart on Global - Market size and forecast 2025-2030 ($ thousand)
Data Table on Global - Market size and forecast 2025-2030 ($ thousand)
Chart on Global Market: Year-over-year growth 2025-2030 (%)
Data Table on Global Market: Year-over-year growth 2025-2030 (%)

5. Historic Market Size

5.1 Global Marine Battery Market 2020 - 2024

Historic Market Size - Data Table on Global Marine Battery Market 2020 - 2024 ($ thousand)

5.2 Application segment analysis 2020 - 2024

Historic Market Size - Application Segment 2020 - 2024 ($ thousand)

5.3 Battery Type segment analysis 2020 - 2024

Historic Market Size - Battery Type Segment 2020 - 2024 ($ thousand)

5.4 Propulsion segment analysis 2020 - 2024

Historic Market Size - Propulsion Segment 2020 - 2024 ($ thousand)

5.5 Geography segment analysis 2020 - 2024

Historic Market Size - Geography Segment 2020 - 2024 ($ thousand)

5.6 Country segment analysis 2020 - 2024

Historic Market Size - Country Segment 2020 - 2024 ($ thousand)

6. Qualitative Analysis

6.1 Impact of AI on global marine battery market

6.2 Impact of geopolitical conflicts on global marine battery market

7. Five Forces Analysis

7.1 Five forces summary

Five forces analysis - Comparison between 2025 and 2030

7.2 Bargaining power of buyers

Bargaining power of buyers - Impact of key factors 2025 and 2030

7.3 Bargaining power of suppliers

Bargaining power of suppliers - Impact of key factors in 2025 and 2030

7.4 Threat of new entrants

Threat of new entrants - Impact of key factors in 2025 and 2030

7.5 Threat of substitutes

Threat of substitutes - Impact of key factors in 2025 and 2030

7.6 Threat of rivalry

Threat of rivalry - Impact of key factors in 2025 and 2030

7.7 Market condition

Chart on Market condition - Five forces 2025 and 2030

8. Market Segmentation by Application

8.1 Market segments

Chart on Application - Market share 2025-2030 (%)
Data Table on Application - Market share 2025-2030 (%)

8.2 Comparison by Application

Chart on Comparison by Application
Data Table on Comparison by Application

8.3 Commercial - Market size and forecast 2025-2030

Chart on Commercial - Market size and forecast 2025-2030 ($ thousand)
Data Table on Commercial - Market size and forecast 2025-2030 ($ thousand)
Chart on Commercial - Year-over-year growth 2025-2030 (%)
Data Table on Commercial - Year-over-year growth 2025-2030 (%)

8.4 Defense - Market size and forecast 2025-2030

Chart on Defense - Market size and forecast 2025-2030 ($ thousand)
Data Table on Defense - Market size and forecast 2025-2030 ($ thousand)
Chart on Defense - Year-over-year growth 2025-2030 (%)
Data Table on Defense - Year-over-year growth 2025-2030 (%)

8.5 Market opportunity by Application

Market opportunity by Application ($ thousand)
Data Table on Market opportunity by Application ($ thousand)

9. Market Segmentation by Battery Type

9.1 Market segments

Chart on Battery Type - Market share 2025-2030 (%)
Data Table on Battery Type - Market share 2025-2030 (%)

9.2 Comparison by Battery Type

Chart on Comparison by Battery Type
Data Table on Comparison by Battery Type

9.3 Lithium-ion - Market size and forecast 2025-2030

Chart on Lithium-ion - Market size and forecast 2025-2030 ($ thousand)
Data Table on Lithium-ion - Market size and forecast 2025-2030 ($ thousand)
Chart on Lithium-ion - Year-over-year growth 2025-2030 (%)
Data Table on Lithium-ion - Year-over-year growth 2025-2030 (%)

9.4 Lead-acid - Market size and forecast 2025-2030

Chart on Lead-acid - Market size and forecast 2025-2030 ($ thousand)
Data Table on Lead-acid - Market size and forecast 2025-2030 ($ thousand)
Chart on Lead-acid - Year-over-year growth 2025-2030 (%)
Data Table on Lead-acid - Year-over-year growth 2025-2030 (%)

9.5 Nickel-based - Market size and forecast 2025-2030

Chart on Nickel-based - Market size and forecast 2025-2030 ($ thousand)
Data Table on Nickel-based - Market size and forecast 2025-2030 ($ thousand)
Chart on Nickel-based - Year-over-year growth 2025-2030 (%)
Data Table on Nickel-based - Year-over-year growth 2025-2030 (%)

9.6 Others - Market size and forecast 2025-2030

Chart on Others - Market size and forecast 2025-2030 ($ thousand)
Data Table on Others - Market size and forecast 2025-2030 ($ thousand)
Chart on Others - Year-over-year growth 2025-2030 (%)
Data Table on Others - Year-over-year growth 2025-2030 (%)

9.7 Market opportunity by Battery Type

Market opportunity by Battery Type ($ thousand)
Data Table on Market opportunity by Battery Type ($ thousand)

10. Market Segmentation by Propulsion

10.1 Market segments

Chart on Propulsion - Market share 2025-2030 (%)
Data Table on Propulsion - Market share 2025-2030 (%)

10.2 Comparison by Propulsion

Chart on Comparison by Propulsion
Data Table on Comparison by Propulsion

10.3 Conventional - Market size and forecast 2025-2030

Chart on Conventional - Market size and forecast 2025-2030 ($ thousand)
Data Table on Conventional - Market size and forecast 2025-2030 ($ thousand)
Chart on Conventional - Year-over-year growth 2025-2030 (%)
Data Table on Conventional - Year-over-year growth 2025-2030 (%)

10.4 Hybrid - Market size and forecast 2025-2030

Chart on Hybrid - Market size and forecast 2025-2030 ($ thousand)
Data Table on Hybrid - Market size and forecast 2025-2030 ($ thousand)
Chart on Hybrid - Year-over-year growth 2025-2030 (%)
Data Table on Hybrid - Year-over-year growth 2025-2030 (%)

10.5 Fully electric - Market size and forecast 2025-2030

Chart on Fully electric - Market size and forecast 2025-2030 ($ thousand)
Data Table on Fully electric - Market size and forecast 2025-2030 ($ thousand)
Chart on Fully electric - Year-over-year growth 2025-2030 (%)
Data Table on Fully electric - Year-over-year growth 2025-2030 (%)

10.6 Market opportunity by Propulsion

Market opportunity by Propulsion ($ thousand)
Data Table on Market opportunity by Propulsion ($ thousand)

11. Customer Landscape

11.1 Customer landscape overview

Analysis of price sensitivity, lifecycle, customer purchase basket, adoption rates, and purchase criteria

12. Geographic Landscape

12.1 Geographic segmentation

Chart on Market share by geography 2025-2030 (%)
Data Table on Market share by geography 2025-2030 (%)

12.2 Geographic comparison

Chart on Geographic comparison
Data Table on Geographic comparison

12.3 Europe - Market size and forecast 2025-2030

Chart on Europe - Market size and forecast 2025-2030 ($ thousand)
Data Table on Europe - Market size and forecast 2025-2030 ($ thousand)
Chart on Europe - Year-over-year growth 2025-2030 (%)
Data Table on Europe - Year-over-year growth 2025-2030 (%)
Chart on Regional Comparison - Europe
Data Table on Regional Comparison - Europe

12.3.1 Germany - Market size and forecast 2025-2030

Chart on Germany - Market size and forecast 2025-2030 ($ thousand)
Data Table on Germany - Market size and forecast 2025-2030 ($ thousand)
Chart on Germany - Year-over-year growth 2025-2030 (%)
Data Table on Germany - Year-over-year growth 2025-2030 (%)

12.3.2 UK - Market size and forecast 2025-2030

Chart on UK - Market size and forecast 2025-2030 ($ thousand)
Data Table on UK - Market size and forecast 2025-2030 ($ thousand)
Chart on UK - Year-over-year growth 2025-2030 (%)
Data Table on UK - Year-over-year growth 2025-2030 (%)

12.3.3 France - Market size and forecast 2025-2030

Chart on France - Market size and forecast 2025-2030 ($ thousand)
Data Table on France - Market size and forecast 2025-2030 ($ thousand)
Chart on France - Year-over-year growth 2025-2030 (%)
Data Table on France - Year-over-year growth 2025-2030 (%)

12.3.4 The Netherlands - Market size and forecast 2025-2030

Chart on The Netherlands - Market size and forecast 2025-2030 ($ thousand)
Data Table on The Netherlands - Market size and forecast 2025-2030 ($ thousand)
Chart on The Netherlands - Year-over-year growth 2025-2030 (%)
Data Table on The Netherlands - Year-over-year growth 2025-2030 (%)

12.3.5 Italy - Market size and forecast 2025-2030

Chart on Italy - Market size and forecast 2025-2030 ($ thousand)
Data Table on Italy - Market size and forecast 2025-2030 ($ thousand)
Chart on Italy - Year-over-year growth 2025-2030 (%)
Data Table on Italy - Year-over-year growth 2025-2030 (%)

12.3.6 Spain - Market size and forecast 2025-2030

Chart on Spain - Market size and forecast 2025-2030 ($ thousand)
Data Table on Spain - Market size and forecast 2025-2030 ($ thousand)
Chart on Spain - Year-over-year growth 2025-2030 (%)
Data Table on Spain - Year-over-year growth 2025-2030 (%)

12.4 North America - Market size and forecast 2025-2030

Chart on North America - Market size and forecast 2025-2030 ($ thousand)
Data Table on North America - Market size and forecast 2025-2030 ($ thousand)
Chart on North America - Year-over-year growth 2025-2030 (%)
Data Table on North America - Year-over-year growth 2025-2030 (%)
Chart on Regional Comparison - North America
Data Table on Regional Comparison - North America

12.4.1 US - Market size and forecast 2025-2030

Chart on US - Market size and forecast 2025-2030 ($ thousand)
Data Table on US - Market size and forecast 2025-2030 ($ thousand)
Chart on US - Year-over-year growth 2025-2030 (%)
Data Table on US - Year-over-year growth 2025-2030 (%)

12.4.2 Canada - Market size and forecast 2025-2030

Chart on Canada - Market size and forecast 2025-2030 ($ thousand)
Data Table on Canada - Market size and forecast 2025-2030 ($ thousand)
Chart on Canada - Year-over-year growth 2025-2030 (%)
Data Table on Canada - Year-over-year growth 2025-2030 (%)

12.4.3 Mexico - Market size and forecast 2025-2030

Chart on Mexico - Market size and forecast 2025-2030 ($ thousand)
Data Table on Mexico - Market size and forecast 2025-2030 ($ thousand)
Chart on Mexico - Year-over-year growth 2025-2030 (%)
Data Table on Mexico - Year-over-year growth 2025-2030 (%)

12.5 APAC - Market size and forecast 2025-2030

Chart on APAC - Market size and forecast 2025-2030 ($ thousand)
Data Table on APAC - Market size and forecast 2025-2030 ($ thousand)
Chart on APAC - Year-over-year growth 2025-2030 (%)
Data Table on APAC - Year-over-year growth 2025-2030 (%)
Chart on Regional Comparison - APAC
Data Table on Regional Comparison - APAC

12.5.1 China - Market size and forecast 2025-2030

Chart on China - Market size and forecast 2025-2030 ($ thousand)
Data Table on China - Market size and forecast 2025-2030 ($ thousand)
Chart on China - Year-over-year growth 2025-2030 (%)
Data Table on China - Year-over-year growth 2025-2030 (%)

12.5.2 Japan - Market size and forecast 2025-2030

Chart on Japan - Market size and forecast 2025-2030 ($ thousand)
Data Table on Japan - Market size and forecast 2025-2030 ($ thousand)
Chart on Japan - Year-over-year growth 2025-2030 (%)
Data Table on Japan - Year-over-year growth 2025-2030 (%)

12.5.3 South Korea - Market size and forecast 2025-2030

Chart on South Korea - Market size and forecast 2025-2030 ($ thousand)
Data Table on South Korea - Market size and forecast 2025-2030 ($ thousand)
Chart on South Korea - Year-over-year growth 2025-2030 (%)
Data Table on South Korea - Year-over-year growth 2025-2030 (%)

12.5.4 India - Market size and forecast 2025-2030

Chart on India - Market size and forecast 2025-2030 ($ thousand)
Data Table on India - Market size and forecast 2025-2030 ($ thousand)
Chart on India - Year-over-year growth 2025-2030 (%)
Data Table on India - Year-over-year growth 2025-2030 (%)

12.5.5 Australia - Market size and forecast 2025-2030

Chart on Australia - Market size and forecast 2025-2030 ($ thousand)
Data Table on Australia - Market size and forecast 2025-2030 ($ thousand)
Chart on Australia - Year-over-year growth 2025-2030 (%)
Data Table on Australia - Year-over-year growth 2025-2030 (%)

12.5.6 Indonesia - Market size and forecast 2025-2030

Chart on Indonesia - Market size and forecast 2025-2030 ($ thousand)
Data Table on Indonesia - Market size and forecast 2025-2030 ($ thousand)
Chart on Indonesia - Year-over-year growth 2025-2030 (%)
Data Table on Indonesia - Year-over-year growth 2025-2030 (%)

12.6 Middle East and Africa - Market size and forecast 2025-2030

Chart on Middle East and Africa - Market size and forecast 2025-2030 ($ thousand)
Data Table on Middle East and Africa - Market size and forecast 2025-2030 ($ thousand)
Chart on Middle East and Africa - Year-over-year growth 2025-2030 (%)
Data Table on Middle East and Africa - Year-over-year growth 2025-2030 (%)
Chart on Regional Comparison - Middle East and Africa
Data Table on Regional Comparison - Middle East and Africa

12.6.1 Saudi Arabia - Market size and forecast 2025-2030

Chart on Saudi Arabia - Market size and forecast 2025-2030 ($ thousand)
Data Table on Saudi Arabia - Market size and forecast 2025-2030 ($ thousand)
Chart on Saudi Arabia - Year-over-year growth 2025-2030 (%)
Data Table on Saudi Arabia - Year-over-year growth 2025-2030 (%)

12.6.2 UAE - Market size and forecast 2025-2030

Chart on UAE - Market size and forecast 2025-2030 ($ thousand)
Data Table on UAE - Market size and forecast 2025-2030 ($ thousand)
Chart on UAE - Year-over-year growth 2025-2030 (%)
Data Table on UAE - Year-over-year growth 2025-2030 (%)

12.6.3 Turkey - Market size and forecast 2025-2030

Chart on Turkey - Market size and forecast 2025-2030 ($ thousand)
Data Table on Turkey - Market size and forecast 2025-2030 ($ thousand)
Chart on Turkey - Year-over-year growth 2025-2030 (%)
Data Table on Turkey - Year-over-year growth 2025-2030 (%)

12.6.4 South Africa - Market size and forecast 2025-2030

Chart on South Africa - Market size and forecast 2025-2030 ($ thousand)
Data Table on South Africa - Market size and forecast 2025-2030 ($ thousand)
Chart on South Africa - Year-over-year growth 2025-2030 (%)
Data Table on South Africa - Year-over-year growth 2025-2030 (%)

12.6.5 Israel - Market size and forecast 2025-2030

Chart on Israel - Market size and forecast 2025-2030 ($ thousand)
Data Table on Israel - Market size and forecast 2025-2030 ($ thousand)
Chart on Israel - Year-over-year growth 2025-2030 (%)
Data Table on Israel - Year-over-year growth 2025-2030 (%)

12.7 South America - Market size and forecast 2025-2030

Chart on South America - Market size and forecast 2025-2030 ($ thousand)
Data Table on South America - Market size and forecast 2025-2030 ($ thousand)
Chart on South America - Year-over-year growth 2025-2030 (%)
Data Table on South America - Year-over-year growth 2025-2030 (%)
Chart on Regional Comparison - South America
Data Table on Regional Comparison - South America

12.7.1 Brazil - Market size and forecast 2025-2030

Chart on Brazil - Market size and forecast 2025-2030 ($ thousand)
Data Table on Brazil - Market size and forecast 2025-2030 ($ thousand)
Chart on Brazil - Year-over-year growth 2025-2030 (%)
Data Table on Brazil - Year-over-year growth 2025-2030 (%)

12.7.2 Argentina - Market size and forecast 2025-2030

Chart on Argentina - Market size and forecast 2025-2030 ($ thousand)
Data Table on Argentina - Market size and forecast 2025-2030 ($ thousand)
Chart on Argentina - Year-over-year growth 2025-2030 (%)
Data Table on Argentina - Year-over-year growth 2025-2030 (%)

12.7.3 Chile - Market size and forecast 2025-2030

Chart on Chile - Market size and forecast 2025-2030 ($ thousand)
Data Table on Chile - Market size and forecast 2025-2030 ($ thousand)
Chart on Chile - Year-over-year growth 2025-2030 (%)
Data Table on Chile - Year-over-year growth 2025-2030 (%)

12.8 Market opportunity by geography

Market opportunity by geography ($ thousand)
Data Tables on Market opportunity by geography ($ thousand)

13. Drivers, Challenges, and Opportunity

13.1 Market drivers

Decarbonization mandates and global maritime emission rules
Expanding commercial inland waterway and cruise tourism
Operational cost savings via peak shaving hybridization

13.2 Market challenges

High capital expenditures and retrofitting cost barriers
Severe thermal runaway risks and safety certifications
Inadequate port charging infrastructure and grid constraints

13.3 Impact of drivers and challenges

Impact of drivers and challenges in 2025 and 2030

13.4 Market opportunities

Adoption of lithium iron phosphate battery chemistry
Development of modular containerized marine battery systems
Integration of cloud AI digital battery passports

14. Competitive Landscape

14.1 Overview

14.2

Overview on criticality of inputs and factors of differentiation

14.3 Landscape disruption

Overview on factors of disruption

14.4 Industry risks

Impact of key risks on business

15. Competitive Analysis

15.1 Companies profiled

Companies covered

15.2 Company ranking index

15.3 Market positioning of companies

Matrix on companies position and classification

15.4 ABB Ltd.

ABB Ltd. - Overview
ABB Ltd. - Business segments
ABB Ltd. - Key news
ABB Ltd. - Key offerings
ABB Ltd. - Segment focus
SWOT

15.5 CLARIOS LLC

CLARIOS LLC - Overview
CLARIOS LLC - Product / Service
CLARIOS LLC - Key offerings
SWOT

15.6 Contemporary Amperex Ltd.

Contemporary Amperex Ltd. - Overview
Contemporary Amperex Ltd. - Business segments
Contemporary Amperex Ltd. - Key offerings
Contemporary Amperex Ltd. - Segment focus
SWOT

15.7 East Penn Manufacture Co. Inc.

East Penn Manufacture Co. Inc. - Overview
East Penn Manufacture Co. Inc. - Product / Service
East Penn Manufacture Co. Inc. - Key offerings
SWOT

15.8 EnerSys Inc.

EnerSys Inc. - Overview
EnerSys Inc. - Business segments
EnerSys Inc. - Key news
EnerSys Inc. - Key offerings
EnerSys Inc. - Segment focus
SWOT

15.9 Exide Technologies

Exide Technologies - Overview
Exide Technologies - Product / Service
Exide Technologies - Key offerings
SWOT

15.10 GS Yuasa International Ltd.

GS Yuasa International Ltd. - Overview
GS Yuasa International Ltd. - Product / Service
GS Yuasa International Ltd. - Key offerings
SWOT

15.11 Leclanche SA

Leclanche SA - Overview
Leclanche SA - Business segments
Leclanche SA - Key offerings
Leclanche SA - Segment focus
SWOT

15.12 Mastervolt International B.V.

Mastervolt International B.V. - Overview
Mastervolt International B.V. - Product / Service
Mastervolt International B.V. - Key offerings
SWOT

15.13 Saft Groupe SAS

Saft Groupe SAS - Overview
Saft Groupe SAS - Product / Service
Saft Groupe SAS - Key offerings
SWOT

15.14 Siemens Energy AG

Siemens Energy AG - Overview
Siemens Energy AG - Business segments
Siemens Energy AG - Key news
Siemens Energy AG - Key offerings
Siemens Energy AG - Segment focus
SWOT

15.15 The Furukawa Battery Co. Ltd.

The Furukawa Battery Co. Ltd. - Overview
The Furukawa Battery Co. Ltd. - Business segments
The Furukawa Battery Co. Ltd. - Key offerings
The Furukawa Battery Co. Ltd. - Segment focus
SWOT

15.16 Torqeedo GmbH

Torqeedo GmbH - Overview
Torqeedo GmbH - Product / Service
Torqeedo GmbH - Key offerings
SWOT

15.17 Victron Energy BV

Victron Energy BV - Overview
Victron Energy BV - Product / Service
Victron Energy BV - Key offerings
SWOT

15.18 Wartsila Corp.

Wartsila Corp. - Overview
Wartsila Corp. - Business segments
Wartsila Corp. - Key news
Wartsila Corp. - Key offerings
Wartsila Corp. - Segment focus
SWOT

16. Appendix

16.1 Scope of the report

Market definition
Objectives
Notes and caveats

16.2 Inclusions and exclusions checklist

Inclusions checklist
Exclusions checklist

16.3 Currency conversion rates for US$

16.4 Research methodology

16.5 Data procurement

Information sources

16.6 Data validation

16.7 Validation techniques employed for market sizing

16.8 Data synthesis

16.9 360 degree market analysis

16.10 List of abbreviations

Research Methodology

Technavio presents a detailed picture of the market by way of study, synthesis, and summation of data from multiple sources. The analysts have presented the various facets of the market with a particular focus on identifying the key industry influencers. The data thus presented is comprehensive, reliable, and the result of extensive research, both primary and secondary.

INFORMATION SOURCES

Primary sources

  • Manufacturers and suppliers
  • Channel partners
  • Industry experts
  • Strategic decision makers

Secondary sources

  • Industry journals and periodicals
  • Government data
  • Financial reports of key industry players
  • Historical data
  • Press releases

DATA ANALYSIS

Data Synthesis

  • Collation of data
  • Estimation of key figures
  • Analysis of derived insights

Data Validation

  • Triangulation with data models
  • Reference against proprietary databases
  • Corroboration with industry experts

REPORT WRITING

Qualitative

  • Market drivers
  • Market challenges
  • Market trends
  • Five forces analysis

Quantitative

  • Market size and forecast
  • Market segmentation
  • Geographical insights
  • Competitive landscape

Interested in this report?

Get your sample now to see our research methodology and insights!

Download Now

Frequently Asked Questions

Marine Battery market growth will increase by USD 585651.7 thousand thousand during 2026-2030.

The Marine Battery market is expected to grow at a CAGR of 14.8% during 2026-2030.

Marine Battery market is segmented by Application (Commercial, Defense) Battery type (Lithium-ion, Lead-acid, Nickel-based, Others) Propulsion (Conventional, Hybrid, Fully electric)

ABB Ltd., CLARIOS LLC, Contemporary Amperex Ltd., Corvus Energy, East Penn Manufacture Co. Inc., Echandia Marine AB, EnerSys Inc., EST Floattech BV, Exide Technologies, GS Yuasa International Ltd., Leclanche SA, Lithion Battery Inc., Mastervolt International B.V., PowerTech Systems, Saft Groupe SAS, Siemens Energy AG, The Furukawa Battery Co. Ltd., Torqeedo GmbH, Victron Energy BV, Wartsila Corp. are a few of the key vendors in the Marine Battery market.

Europe will register the highest growth rate of 53.6% among the other regions. Therefore, the Marine Battery market in Europe is expected to garner significant business opportunities for the vendors during the forecast period.

Germany, UK, France, The Netherlands, Italy, Spain, US, Canada, Mexico, China, Japan, South Korea, India, Australia, Indonesia, Saudi Arabia, UAE, Turkey, South Africa, Israel, Brazil, Argentina, Chile

  • Decarbonization mandates and global maritime emission rules is the driving factor this market.

The Marine Battery market vendors should focus on grabbing business opportunities from the Application segment as it accounted for the largest market share in the base year.
RIA - Research AI Assistant
Ask RIA
