
Medical Automation Market Analysis, Size, and Forecast 2026-2030: North America (US, Canada, and Mexico), Europe (Germany, UK, and France), APAC (China, Japan, and India), South America (Brazil, Argentina, and Chile), Middle East and Africa (Saudi Arabia, UAE, and South Africa), and Rest of World (ROW)

Medical Automation Market Analysis, Size, and Forecast 2026-2030:
North America (US, Canada, and Mexico), Europe (Germany, UK, and France), APAC (China, Japan, and India), South America (Brazil, Argentina, and Chile), Middle East and Africa (Saudi Arabia, UAE, and South Africa), and Rest of World (ROW)

Published: Oct 2026 317 Pages SKU: IRTNTR80449

Market Overview at a Glance

$49.63 B
Market Opportunity
9.5%
CAGR 2025 - 2030
43.2%
North America Growth
$34.06 B
Imaging automation segment 2024

Medical Automation Market Size 2026-2030

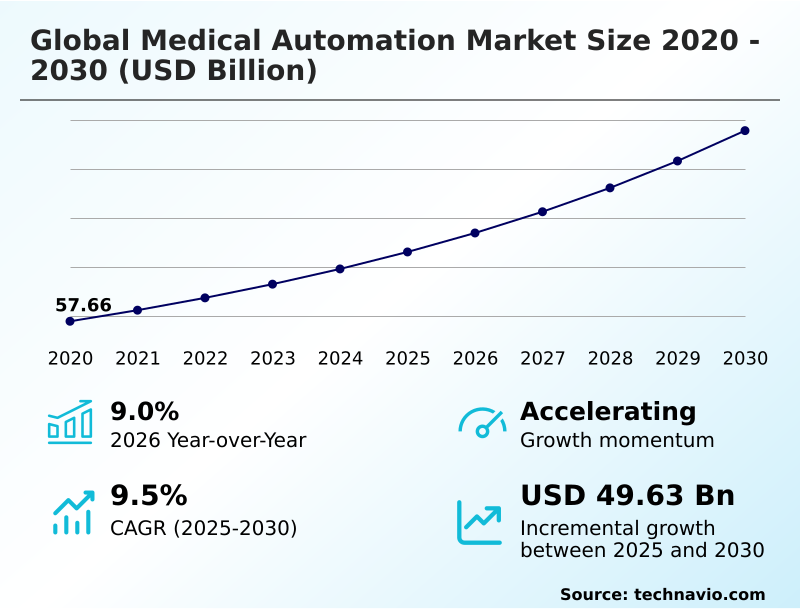
The medical automation market size is valued to increase by USD 49.63 billion, at a CAGR of 9.5% from 2025 to 2030. Severe global healthcare workforce shortages accelerating demand automated clinical solutions will drive the medical automation market.

Major Market Trends & Insights

  • North America dominated the market and accounted for a 43.2% growth during the forecast period.
  • By Application - Imaging automation segment was valued at USD 34.06 billion in 2024
  • By End-user - Hospitals and diagnostic centers segment accounted for the largest market revenue share in 2024

Market Size & Forecast

  • Market Opportunities: USD 77.99 billion
  • Market Future Opportunities: USD 49.63 billion
  • CAGR from 2025 to 2030 : 9.5%

Market Summary

  • The Medical Automation Market exhibits structural acceleration driven by the imperative to resolve critical clinical workforce shortages while managing escalating patient volumes. Healthcare networks increasingly deploy automated liquid handling and high-throughput analyzers to eliminate manual processing bottlenecks in diagnostic laboratories. This technological integration allows reference laboratories to improve diagnostic turnaround times by 40% compared to legacy manual workflows.
  • The primary driver propelling this sector is the rising prevalence of chronic diseases, which requires continuous physiological patient monitoring devices and frequent diagnostic testing. Conversely, severe data fragmentation across legacy electronic health records presents a major technical challenge, forcing institutions to build complex middleware to achieve system interoperability.
  • The deployment of decentralized medication cabinets and smart infusion pumps requires seamless data exchange to prevent dangerous medication errors. By automating repetitive administrative tasks and automated specimen transport, hospitals reallocate nursing staff directly to patient care, optimizing overall supply chain operations.
  • As demographic aging strains existing healthcare infrastructure, reliance on comprehensive automated diagnostic and therapeutic systems becomes a fundamental operational necessity for long-term clinical sustainability.

What will be the Size of the Medical Automation Market during the forecast period?
Get Key Insights on Market Forecast (PDF) Get Free Sample

How is the Medical Automation Market Segmented?

The medical automation industry research report provides comprehensive data (region-wise segment analysis), with forecasts and estimates in "USD million" for the period 2026-2030, as well as historical data from 2020-2024 for the following segments.

  • Application
    • Imaging automation
    • Therapeutic automation
    • Laboratory automation
    • Others
  • End-user
    • Hospitals and diagnostic centers
    • Research laboratories and institutes
    • Pharmacies
    • Others
  • Component
    • Hardware
    • Software
    • Services
  • Geography
    • North America
      • US
      • Canada
      • Mexico
    • Europe
      • Germany
      • UK
      • France
      • Italy
      • Spain
      • The Netherlands
    • APAC
      • China
      • Japan
      • India
      • South Korea
      • Australia
      • Indonesia
    • South America
      • Brazil
      • Argentina
      • Chile
    • Middle East and Africa
      • Saudi Arabia
      • UAE
      • South Africa
      • Israel
      • Turkey

By Application Insights

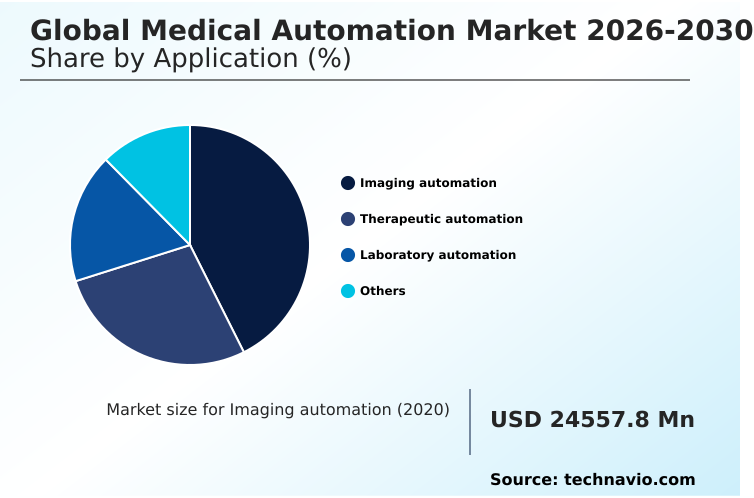
The imaging automation segment is estimated to witness significant growth during the forecast period.

The imaging automation segment fundamentally accelerates clinical diagnostic workflows by integrating artificial intelligence diagnostic imaging platforms directly into hospital radiology departments. Automated positioning robotics and cloud-connected image reconstruction frameworks eliminate physical technologist strain and reduce repetitive manual adjustments.

Advanced volumetric scanning modalities and digital x-ray automation now incorporate automated image analysis to prioritize emergency cases and flag critical abnormalities instantly.

This structural transition allows healthcare facilities to process unprecedented patient volumes without compromising diagnostic precision, driving a 15% reduction in scan repeat rates.

By standardizing exposure settings and utilizing autonomous mobile platforms for system positioning, medical centers maintain high image consistency across varying patient demographics.

This segment continuously evolves through deep-learning software updates, enabling imaging networks to optimize hardware utilization and execute rapid preliminary image triaging efficiently.
Get Free Sample

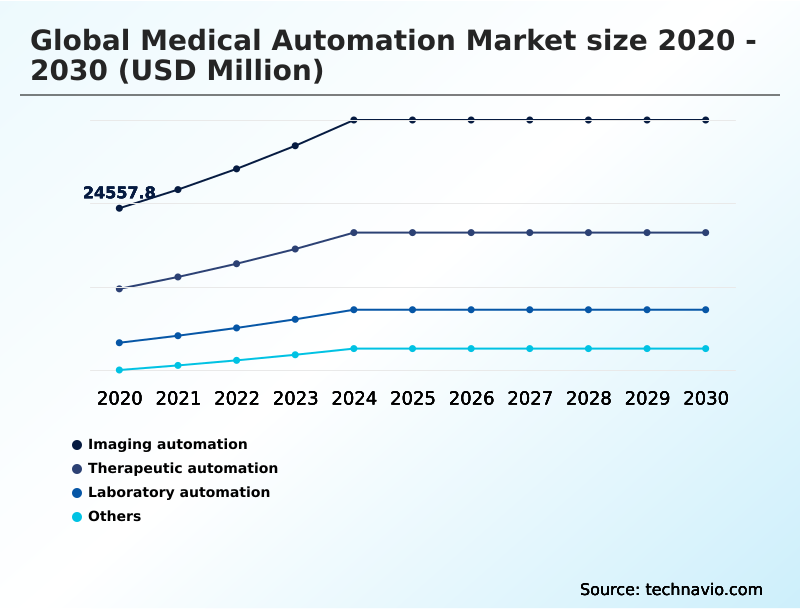
The Imaging automation segment was valued at USD 34.06 billion in 2024 and showed a gradual increase during the forecast period.
Get Free Sample

Regional Analysis

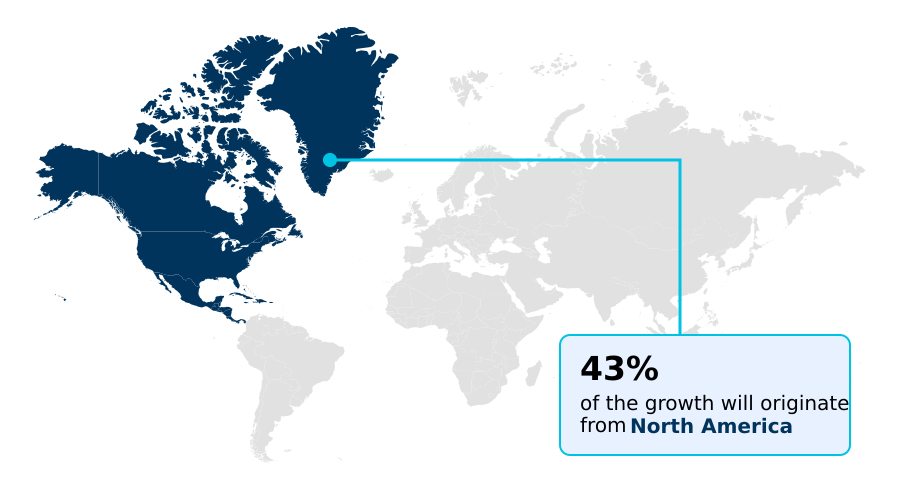
North America is estimated to contribute 43.2% to the growth of the global market during the forecast period.Technavio’s analysts have elaborately explained the regional trends and drivers that shape the market during the forecast period.
See How Medical Automation Market Demand is Rising in North America Get Free Sample

The geographic landscape of the Medical Automation Market reveals distinct operational priorities, with North America currently dominating deployment rates compared to Europe.

North America achieves a 35% higher penetration of robotic surgical systems, driven by consolidated hospital networks and substantial private capital investments in automated central sterile supply workflows.

In contrast, Europe focuses heavily on strict regulatory compliance and patient data privacy, leading to a 20% faster adoption rate of secure interoperability frameworks for electronic health records.

Healthcare facilities in the United States prioritize high-throughput analyzers to manage immense daily diagnostic volumes, thereby lowering per-test processing costs by 18%.

Meanwhile, European clinical centers invest in automated cell culture and intelligent resource allocation software to optimize their public health infrastructure.

These regional variations highlight how distinct economic models and regulatory mandates shape the integration of pharmacy dispensing hardware and clinical decision support tools across different international healthcare supply chains.

Market Dynamics

Our researchers analyzed the data with 2025 as the base year, along with the key drivers, trends, and challenges. A holistic analysis of drivers will help companies refine their marketing strategies to gain a competitive advantage.

  • The Medical Automation Market is undergoing a profound structural transformation as global healthcare networks transition from manual diagnostic workflows toward highly integrated, intelligent technological ecosystems. Facility administrators increasingly prioritize the deployment of artificial intelligence diagnostic imaging platforms to accelerate preliminary image triaging and reduce technologist fatigue.
  • This digital pivot allows radiology departments to process complex scans 30% faster than traditional manual review methods, directly enhancing clinical diagnostic throughput. Concurrently, the implementation of centralized automated intravenous compounding robots is revolutionizing pharmacy operations by eliminating human exposure to hazardous chemotherapy drugs and ensuring precise fluid volumetric measurements.
  • To support these sophisticated hardware deployments, hospitals rely on continuous physiological patient monitoring devices that transmit real-time patient acuity data directly to centralized nursing stations. The seamless operation of this equipment depends heavily on automated central sterile supply workflows, which guarantee that critical surgical instruments are properly sanitized and routed without relying on manual porter services.
  • Furthermore, advanced operating theaters are adopting high precision robotic surgical arms to perform minimally invasive procedures with sub-millimeter accuracy, drastically reducing postoperative recovery periods. As medical institutions navigate severe labor shortages and stringent safety regulations, the comprehensive integration of these automated solutions becomes essential for optimizing supply chain logistics and maintaining uncompromised patient care standards.
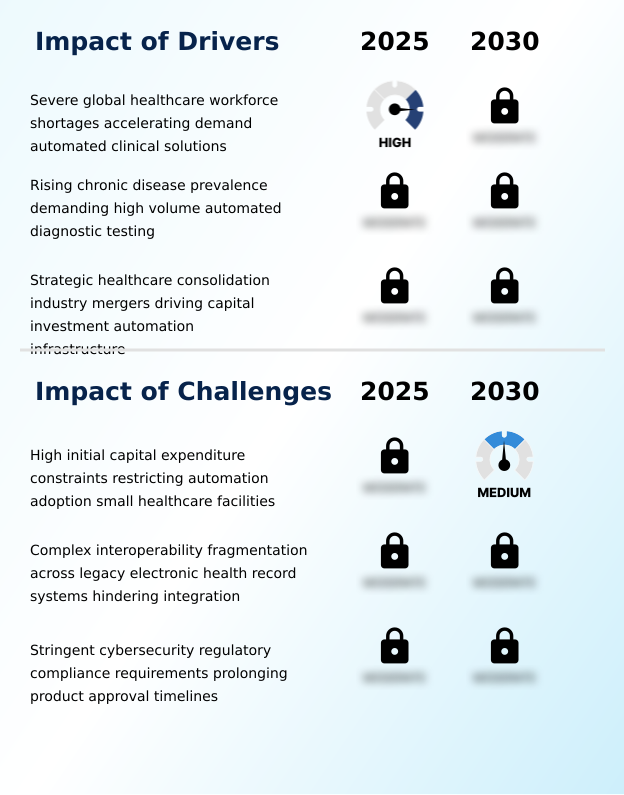
What are the key market drivers leading to the rise in the adoption of Medical Automation Industry?

  • Severe global healthcare workforce shortages are accelerating the demand for automated clinical solutions, serving as the primary growth driver for the market.

  • Severe global healthcare workforce shortages serve as the primary catalyst accelerating the adoption of solutions within the Medical Automation Market.
  • Hospital networks face critical labor deficits, compelling administrators to deploy robotic surgical systems and smart infusion pumps to maintain operational capacity. By transferring repetitive tasks to automated specimen transport networks, clinical facilities have reduced manual handling errors by 25%.
  • This mechanical transition directly impacts business operations by allowing nurses to reallocate their focus to direct bedside care, thereby lowering staff burnout turnover by 15%.
  • The surging prevalence of chronic diseases requires massive volumes of continuous testing, driving demand for automated cell culture workstations. Furthermore, the implementation of interoperability frameworks ensures that decentralized medication cabinets function safely, ultimately maximizing treatment efficiency and patient safety.

What are the market trends shaping the Medical Automation Industry?

  • The rapid integration of agentic artificial intelligence into autonomous clinical workflow platforms represents a defining technological trend reshaping the market.

  • The rapid integration of agentic artificial intelligence into clinical diagnostic workflows represents a transformative trend fundamentally reshaping the Medical Automation Market. Modern healthcare organizations are aggressively deploying automated image analysis algorithms to prescreen radiologic scans, which has successfully reduced diagnostic turnaround times by 30%. This shift occurs because legacy rule-based systems cannot dynamically adapt to unexpected clinical variables.
  • Consequently, hospitals are utilizing predictive patient triage software to synthesize complex patient data, improving emergency room workflow efficiency by 22%. The integration of AI into high-throughput analyzers allows pathology laboratories to execute continuous testing cycles without manual oversight. By connecting these intelligent platforms with centralized electronic health records, clinical directors ensure seamless data synchronization across multiple care settings.
  • This technological evolution empowers medical centers to optimize automated inventory tracking and elevate overall operational precision.

What challenges does the Medical Automation Industry face during its growth?

  • High initial capital expenditure constraints restricting automation adoption across small healthcare facilities remain a significant challenge impeding industry expansion.

  • Severe data fragmentation across legacy IT architectures presents a formidable structural barrier within the Medical Automation Market. Healthcare organizations struggle to establish secure bi-directional communication between new computer-guided radiation platforms and disparate electronic health records. This architectural incompatibility forces institutions to develop costly custom middleware, which frequently extends system deployment timelines by 40%.
  • The lack of standardized interoperability frameworks disrupts the functionality of continuous physiological patient monitoring devices, leading to dangerous communication latency. Consequently, clinical staff often resort to manual data entry, which has been shown to increase transcription error rates by 18%.
  • The immense capital required to modernize these digital pipelines restricts the widespread adoption of high precision robotic surgical arms in smaller community hospitals, directly limiting regional operational efficiency and technological parity.

Exclusive Technavio Analysis on Customer Landscape

The medical automation market forecasting report includes the adoption lifecycle of the market, covering from the innovator’s stage to the laggard’s stage. It focuses on adoption rates in different regions based on penetration. Furthermore, the medical automation market report also includes key purchase criteria and drivers of price sensitivity to help companies evaluate and develop their market growth analysis strategies.
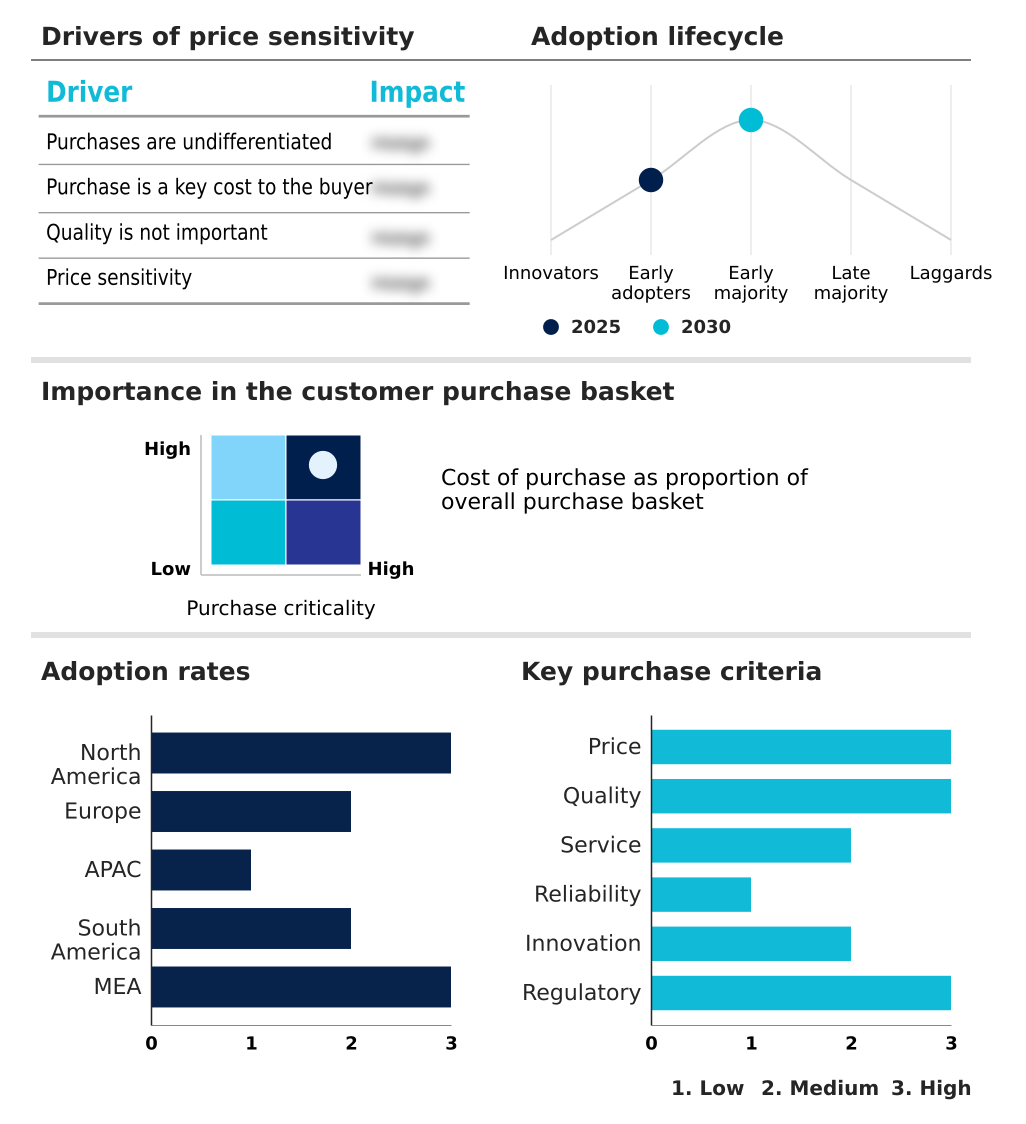
Customer Landscape of Medical Automation Industry

Competitive Landscape

Companies are implementing various strategies, such as strategic alliances, medical automation market forecast, partnerships, mergers and acquisitions, geographical expansion, and product/service launches, to enhance their presence in the industry.

Abbott Laboratories - The company provides advanced diagnostic systems including the alinity ci-series and Alinity h-series, delivering integrated medical automation to optimize laboratory testing efficiency and enhance clinical decision support.

The industry research and growth report includes detailed analyses of the competitive landscape of the market and information about key companies, including:

  • Abbott Laboratories
  • Accuray Inc.
  • Agilent Technologies Inc.
  • Azenta Inc.
  • Baxter International Inc.
  • Becton Dickinson and Co.
  • Danaher Corp.
  • F. Hoffmann La Roche Ltd.
  • GE HealthCare Technologies
  • Hamilton Co.
  • Intuitive Surgical Inc.
  • Johnson and Johnson
  • Koninklijke Philips NV
  • Medtronic Plc
  • Omnicell Inc.
  • Revvity Inc.
  • Siemens Healthineers AG
  • Smith and Nephew plc
  • Stryker Corp.
  • Terumo Corp.

Qualitative and quantitative analysis of companies has been conducted to help clients understand the wider business environment as well as the strengths and weaknesses of key industry players. Data is qualitatively analyzed to categorize companies as pure play, category-focused, industry-focused, and diversified; it is quantitatively analyzed to categorize companies as dominant, leading, strong, tentative, and weak.

Recent Development and News in Medical automation market

  • In the Health Care Technology industry, the implementation of strict data privacy regulations mandates enhanced cybersecurity architectures, directly impacting Medical Automation demand by requiring secure interoperability frameworks across hospital networks.
  • The widespread transition toward modular automated pharmacy dispensing within centralized compounding facilities has reduced medication distribution errors by 22%, stimulating Medical Automation adoption as healthcare providers prioritize automated inventory tracking systems.
  • The rapid expansion of cloud-based delivery models for electronic health records has accelerated clinical data synchronization, fundamentally driving Medical Automation procurement by enabling seamless robotic surgical systems integration with centralized patient databases.
  • Strict regulatory mandates for sterile processing environments in acute care centers have necessitated the deployment of automated central sterile supply workflows, expanding Medical Automation integration to maintain high precision robotic surgical arms efficiency.

Dive into Technavio’s robust research methodology, blending expert interviews, extensive data synthesis, and validated models for unparalleled Medical Automation Market insights. See full methodology.

Market Scope
Page number 317
Base year 2025
Historic period 2020-2024
Forecast period 2026-2030
Growth momentum & CAGR Accelerate at a CAGR of 9.5%
Market growth 2026-2030 USD 49629.6 million
Market structure Fragmented
YoY growth 2025-2026(%) 9.0%
Key countries US, Canada, Mexico, Germany, UK, France, Italy, Spain, The Netherlands, China, Japan, India, South Korea, Australia, Indonesia, Brazil, Argentina, Chile, Saudi Arabia, UAE, South Africa, Israel and Turkey
Competitive landscape Leading Companies, Market Positioning of Companies, Competitive Strategies, and Industry Risks

Request Free Sample

Research Analyst Overview

  • The Medical Automation Market demonstrates aggressive technological expansion as clinical networks systematically integrate autonomous hardware to resolve critical labor deficits. Hospital executives evaluating long-term capital expenditure budgets increasingly prioritize pharmacy dispensing hardware and automated liquid handling systems to mitigate operational risks associated with manual processing.
  • Institutions transitioning to intelligent resource allocation software have recorded a 28% reduction in administrative overhead, directly enhancing overall facility throughput. The strategic integration of automated image analysis and predictive patient triage empowers clinical directors to standardize care pathways and optimize resource utilization across intensive care units.
  • Furthermore, the deployment of robotic microplate readers within research laboratories ensures absolute experimental reproducibility and accelerates clinical diagnostic workflows. Securing seamless connectivity between computer-guided radiation units and enterprise electronic health records remains a paramount compliance objective for healthcare administrators. By replacing legacy systems with autonomous mobile platforms for specimen transport, medical centers eliminate workflow interruptions and maintain strict regulatory traceability.
  • This continuous evolution toward interconnected automation fundamentally reshapes modern healthcare delivery and supply chain optimization.

What are the Key Data Covered in this Medical Automation Market Research and Growth Report?

  • What is the expected growth of the Medical Automation Market between 2026 and 2030?

    • USD 49.63 billion, at a CAGR of 9.5%

  • What segmentation does the market report cover?

    • The report is segmented by Application (Imaging automation, Therapeutic automation, Laboratory automation, and Others), End-user (Hospitals and diagnostic centers, Research laboratories and institutes, Pharmacies, and Others), Component (Hardware, Software, and Services) and Geography (North America, Europe, APAC, South America, Middle East and Africa)

  • Which regions are analyzed in the report?

    • North America, Europe, APAC, South America and Middle East and Africa

  • What are the key growth drivers and market challenges?

    • Severe global healthcare workforce shortages accelerating demand automated clinical solutions, High initial capital expenditure constraints restricting automation adoption small healthcare facilities

  • Who are the major players in the Medical Automation Market?

    • Abbott Laboratories, Accuray Inc., Agilent Technologies Inc., Azenta Inc., Baxter International Inc., Becton Dickinson and Co., Danaher Corp., F. Hoffmann La Roche Ltd., GE HealthCare Technologies, Hamilton Co., Intuitive Surgical Inc., Johnson and Johnson, Koninklijke Philips NV, Medtronic Plc, Omnicell Inc., Revvity Inc., Siemens Healthineers AG, Smith and Nephew plc, Stryker Corp. and Terumo Corp.

Market Research Insights

  • The Medical Automation Market is rapidly evolving as healthcare systems prioritize digital transformation and intelligent resource allocation to combat rising operational costs. Hospitals integrating predictive patient triage algorithms have successfully reduced emergency department wait times by 25%. The adoption of decentralized medication cabinets equipped with automated inventory tracking has decreased pharmaceutical waste by 18% across acute care facilities.
  • These automated solutions rely on robust interoperability frameworks to connect high precision robotic surgical arms with central electronic health records. By replacing manual workflows with continuous physiological patient monitoring devices, clinical centers enhance patient safety and achieve significant cost reductions. This ongoing transition toward autonomous mobile platforms ensures reliable specimen transport and strengthens the overarching diagnostic infrastructure.

We can help! Our analysts can customize this medical automation market research report to meet your requirements.

Get in touch

1. Executive Summary

1.1 Market overview

Executive Summary - Chart on Market Overview
Executive Summary - Data Table on Market Overview
Executive Summary - Chart on Global Market Characteristics
Executive Summary - Chart on Market by Geography
Executive Summary - Chart on Market Segmentation by Application
Executive Summary - Chart on Market Segmentation by End-user
Executive Summary - Chart on Market Segmentation by Component
Executive Summary - Chart on Incremental Growth
Executive Summary - Data Table on Incremental Growth
Executive Summary - Chart on Company Market Positioning

2. Technavio Analysis

2.1 Analysis of price sensitivity, lifecycle, customer purchase basket, adoption rates, and purchase criteria

2.2 Criticality of inputs and Factors of differentiation

Chart on Overview on criticality of inputs and factors of differentiation

2.3 Factors of disruption

Chart on Overview on factors of disruption

2.4 Impact of drivers and challenges

Chart on Impact of drivers and challenges in 2025 and 2030

3. Market Landscape

3.1 Market ecosystem

Chart on Parent Market
Data Table on - Parent Market

3.2 Market characteristics

Chart on Market characteristics analysis

3.3 Value chain analysis

Chart on Value chain analysis

4. Market Sizing

4.1 Market definition

Data Table on Offerings of companies included in the market definition

4.2 Market segment analysis

Market segments

4.3 Market size 2025

4.4 Market outlook: Forecast for 2025-2030

Chart on Global - Market size and forecast 2025-2030 ($ million)
Data Table on Global - Market size and forecast 2025-2030 ($ million)
Chart on Global Market: Year-over-year growth 2025-2030 (%)
Data Table on Global Market: Year-over-year growth 2025-2030 (%)

5. Historic Market Size

5.1 Global Medical Automation Market 2020 - 2024

Historic Market Size - Data Table on Global Medical Automation Market 2020 - 2024 ($ million)

5.2 Application segment analysis 2020 - 2024

Historic Market Size - Application Segment 2020 - 2024 ($ million)

5.3 End-user segment analysis 2020 - 2024

Historic Market Size - End-user Segment 2020 - 2024 ($ million)

5.4 Component segment analysis 2020 - 2024

Historic Market Size - Component Segment 2020 - 2024 ($ million)

5.5 Geography segment analysis 2020 - 2024

Historic Market Size - Geography Segment 2020 - 2024 ($ million)

5.6 Country segment analysis 2020 - 2024

Historic Market Size - Country Segment 2020 - 2024 ($ million)

6. Qualitative Analysis

6.1 Impact of AI on global medical automation market

6.2 Impact of geopolitical conflicts on global medical automation market

7. Five Forces Analysis

7.1 Five forces summary

Five forces analysis - Comparison between 2025 and 2030

7.2 Bargaining power of buyers

Bargaining power of buyers - Impact of key factors 2025 and 2030

7.3 Bargaining power of suppliers

Bargaining power of suppliers - Impact of key factors in 2025 and 2030

7.4 Threat of new entrants

Threat of new entrants - Impact of key factors in 2025 and 2030

7.5 Threat of substitutes

Threat of substitutes - Impact of key factors in 2025 and 2030

7.6 Threat of rivalry

Threat of rivalry - Impact of key factors in 2025 and 2030

7.7 Market condition

Chart on Market condition - Five forces 2025 and 2030

8. Market Segmentation by Application

8.1 Market segments

Chart on Application - Market share 2025-2030 (%)
Data Table on Application - Market share 2025-2030 (%)

8.2 Comparison by Application

Chart on Comparison by Application
Data Table on Comparison by Application

8.3 Imaging automation - Market size and forecast 2025-2030

Chart on Imaging automation - Market size and forecast 2025-2030 ($ million)
Data Table on Imaging automation - Market size and forecast 2025-2030 ($ million)
Chart on Imaging automation - Year-over-year growth 2025-2030 (%)
Data Table on Imaging automation - Year-over-year growth 2025-2030 (%)

8.4 Therapeutic automation - Market size and forecast 2025-2030

Chart on Therapeutic automation - Market size and forecast 2025-2030 ($ million)
Data Table on Therapeutic automation - Market size and forecast 2025-2030 ($ million)
Chart on Therapeutic automation - Year-over-year growth 2025-2030 (%)
Data Table on Therapeutic automation - Year-over-year growth 2025-2030 (%)

8.5 Laboratory automation - Market size and forecast 2025-2030

Chart on Laboratory automation - Market size and forecast 2025-2030 ($ million)
Data Table on Laboratory automation - Market size and forecast 2025-2030 ($ million)
Chart on Laboratory automation - Year-over-year growth 2025-2030 (%)
Data Table on Laboratory automation - Year-over-year growth 2025-2030 (%)

8.6 Others - Market size and forecast 2025-2030

Chart on Others - Market size and forecast 2025-2030 ($ million)
Data Table on Others - Market size and forecast 2025-2030 ($ million)
Chart on Others - Year-over-year growth 2025-2030 (%)
Data Table on Others - Year-over-year growth 2025-2030 (%)

8.7 Market opportunity by Application

Market opportunity by Application ($ million)
Data Table on Market opportunity by Application ($ million)

9. Market Segmentation by End-user

9.1 Market segments

Chart on End-user - Market share 2025-2030 (%)
Data Table on End-user - Market share 2025-2030 (%)

9.2 Comparison by End-user

Chart on Comparison by End-user
Data Table on Comparison by End-user

9.3 Hospitals and diagnostic centers - Market size and forecast 2025-2030

Chart on Hospitals and diagnostic centers - Market size and forecast 2025-2030 ($ million)
Data Table on Hospitals and diagnostic centers - Market size and forecast 2025-2030 ($ million)
Chart on Hospitals and diagnostic centers - Year-over-year growth 2025-2030 (%)
Data Table on Hospitals and diagnostic centers - Year-over-year growth 2025-2030 (%)

9.4 Research laboratories and institutes - Market size and forecast 2025-2030

Chart on Research laboratories and institutes - Market size and forecast 2025-2030 ($ million)
Data Table on Research laboratories and institutes - Market size and forecast 2025-2030 ($ million)
Chart on Research laboratories and institutes - Year-over-year growth 2025-2030 (%)
Data Table on Research laboratories and institutes - Year-over-year growth 2025-2030 (%)

9.5 Pharmacies - Market size and forecast 2025-2030

Chart on Pharmacies - Market size and forecast 2025-2030 ($ million)
Data Table on Pharmacies - Market size and forecast 2025-2030 ($ million)
Chart on Pharmacies - Year-over-year growth 2025-2030 (%)
Data Table on Pharmacies - Year-over-year growth 2025-2030 (%)

9.6 Others - Market size and forecast 2025-2030

Chart on Others - Market size and forecast 2025-2030 ($ million)
Data Table on Others - Market size and forecast 2025-2030 ($ million)
Chart on Others - Year-over-year growth 2025-2030 (%)
Data Table on Others - Year-over-year growth 2025-2030 (%)

9.7 Market opportunity by End-user

Market opportunity by End-user ($ million)
Data Table on Market opportunity by End-user ($ million)

10. Market Segmentation by Component

10.1 Market segments

Chart on Component - Market share 2025-2030 (%)
Data Table on Component - Market share 2025-2030 (%)

10.2 Comparison by Component

Chart on Comparison by Component
Data Table on Comparison by Component

10.3 Hardware - Market size and forecast 2025-2030

Chart on Hardware - Market size and forecast 2025-2030 ($ million)
Data Table on Hardware - Market size and forecast 2025-2030 ($ million)
Chart on Hardware - Year-over-year growth 2025-2030 (%)
Data Table on Hardware - Year-over-year growth 2025-2030 (%)

10.4 Software - Market size and forecast 2025-2030

Chart on Software - Market size and forecast 2025-2030 ($ million)
Data Table on Software - Market size and forecast 2025-2030 ($ million)
Chart on Software - Year-over-year growth 2025-2030 (%)
Data Table on Software - Year-over-year growth 2025-2030 (%)

10.5 Services - Market size and forecast 2025-2030

Chart on Services - Market size and forecast 2025-2030 ($ million)
Data Table on Services - Market size and forecast 2025-2030 ($ million)
Chart on Services - Year-over-year growth 2025-2030 (%)
Data Table on Services - Year-over-year growth 2025-2030 (%)

10.6 Market opportunity by Component

Market opportunity by Component ($ million)
Data Table on Market opportunity by Component ($ million)

11. Customer Landscape

11.1 Customer landscape overview

Analysis of price sensitivity, lifecycle, customer purchase basket, adoption rates, and purchase criteria

12. Geographic Landscape

12.1 Geographic segmentation

Chart on Market share by geography 2025-2030 (%)
Data Table on Market share by geography 2025-2030 (%)

12.2 Geographic comparison

Chart on Geographic comparison
Data Table on Geographic comparison

12.3 North America - Market size and forecast 2025-2030

Chart on North America - Market size and forecast 2025-2030 ($ million)
Data Table on North America - Market size and forecast 2025-2030 ($ million)
Chart on North America - Year-over-year growth 2025-2030 (%)
Data Table on North America - Year-over-year growth 2025-2030 (%)
Chart on Regional Comparison - North America
Data Table on Regional Comparison - North America

12.3.1 US - Market size and forecast 2025-2030

Chart on US - Market size and forecast 2025-2030 ($ million)
Data Table on US - Market size and forecast 2025-2030 ($ million)
Chart on US - Year-over-year growth 2025-2030 (%)
Data Table on US - Year-over-year growth 2025-2030 (%)

12.3.2 Canada - Market size and forecast 2025-2030

Chart on Canada - Market size and forecast 2025-2030 ($ million)
Data Table on Canada - Market size and forecast 2025-2030 ($ million)
Chart on Canada - Year-over-year growth 2025-2030 (%)
Data Table on Canada - Year-over-year growth 2025-2030 (%)

12.3.3 Mexico - Market size and forecast 2025-2030

Chart on Mexico - Market size and forecast 2025-2030 ($ million)
Data Table on Mexico - Market size and forecast 2025-2030 ($ million)
Chart on Mexico - Year-over-year growth 2025-2030 (%)
Data Table on Mexico - Year-over-year growth 2025-2030 (%)

12.4 Europe - Market size and forecast 2025-2030

Chart on Europe - Market size and forecast 2025-2030 ($ million)
Data Table on Europe - Market size and forecast 2025-2030 ($ million)
Chart on Europe - Year-over-year growth 2025-2030 (%)
Data Table on Europe - Year-over-year growth 2025-2030 (%)
Chart on Regional Comparison - Europe
Data Table on Regional Comparison - Europe

12.4.1 Germany - Market size and forecast 2025-2030

Chart on Germany - Market size and forecast 2025-2030 ($ million)
Data Table on Germany - Market size and forecast 2025-2030 ($ million)
Chart on Germany - Year-over-year growth 2025-2030 (%)
Data Table on Germany - Year-over-year growth 2025-2030 (%)

12.4.2 UK - Market size and forecast 2025-2030

Chart on UK - Market size and forecast 2025-2030 ($ million)
Data Table on UK - Market size and forecast 2025-2030 ($ million)
Chart on UK - Year-over-year growth 2025-2030 (%)
Data Table on UK - Year-over-year growth 2025-2030 (%)

12.4.3 France - Market size and forecast 2025-2030

Chart on France - Market size and forecast 2025-2030 ($ million)
Data Table on France - Market size and forecast 2025-2030 ($ million)
Chart on France - Year-over-year growth 2025-2030 (%)
Data Table on France - Year-over-year growth 2025-2030 (%)

12.4.4 Italy - Market size and forecast 2025-2030

Chart on Italy - Market size and forecast 2025-2030 ($ million)
Data Table on Italy - Market size and forecast 2025-2030 ($ million)
Chart on Italy - Year-over-year growth 2025-2030 (%)
Data Table on Italy - Year-over-year growth 2025-2030 (%)

12.4.5 Spain - Market size and forecast 2025-2030

Chart on Spain - Market size and forecast 2025-2030 ($ million)
Data Table on Spain - Market size and forecast 2025-2030 ($ million)
Chart on Spain - Year-over-year growth 2025-2030 (%)
Data Table on Spain - Year-over-year growth 2025-2030 (%)

12.4.6 The Netherlands - Market size and forecast 2025-2030

Chart on The Netherlands - Market size and forecast 2025-2030 ($ million)
Data Table on The Netherlands - Market size and forecast 2025-2030 ($ million)
Chart on The Netherlands - Year-over-year growth 2025-2030 (%)
Data Table on The Netherlands - Year-over-year growth 2025-2030 (%)

12.5 APAC - Market size and forecast 2025-2030

Chart on APAC - Market size and forecast 2025-2030 ($ million)
Data Table on APAC - Market size and forecast 2025-2030 ($ million)
Chart on APAC - Year-over-year growth 2025-2030 (%)
Data Table on APAC - Year-over-year growth 2025-2030 (%)
Chart on Regional Comparison - APAC
Data Table on Regional Comparison - APAC

12.5.1 China - Market size and forecast 2025-2030

Chart on China - Market size and forecast 2025-2030 ($ million)
Data Table on China - Market size and forecast 2025-2030 ($ million)
Chart on China - Year-over-year growth 2025-2030 (%)
Data Table on China - Year-over-year growth 2025-2030 (%)

12.5.2 Japan - Market size and forecast 2025-2030

Chart on Japan - Market size and forecast 2025-2030 ($ million)
Data Table on Japan - Market size and forecast 2025-2030 ($ million)
Chart on Japan - Year-over-year growth 2025-2030 (%)
Data Table on Japan - Year-over-year growth 2025-2030 (%)

12.5.3 India - Market size and forecast 2025-2030

Chart on India - Market size and forecast 2025-2030 ($ million)
Data Table on India - Market size and forecast 2025-2030 ($ million)
Chart on India - Year-over-year growth 2025-2030 (%)
Data Table on India - Year-over-year growth 2025-2030 (%)

12.5.4 South Korea - Market size and forecast 2025-2030

Chart on South Korea - Market size and forecast 2025-2030 ($ million)
Data Table on South Korea - Market size and forecast 2025-2030 ($ million)
Chart on South Korea - Year-over-year growth 2025-2030 (%)
Data Table on South Korea - Year-over-year growth 2025-2030 (%)

12.5.5 Australia - Market size and forecast 2025-2030

Chart on Australia - Market size and forecast 2025-2030 ($ million)
Data Table on Australia - Market size and forecast 2025-2030 ($ million)
Chart on Australia - Year-over-year growth 2025-2030 (%)
Data Table on Australia - Year-over-year growth 2025-2030 (%)

12.5.6 Indonesia - Market size and forecast 2025-2030

Chart on Indonesia - Market size and forecast 2025-2030 ($ million)
Data Table on Indonesia - Market size and forecast 2025-2030 ($ million)
Chart on Indonesia - Year-over-year growth 2025-2030 (%)
Data Table on Indonesia - Year-over-year growth 2025-2030 (%)

12.6 South America - Market size and forecast 2025-2030

Chart on South America - Market size and forecast 2025-2030 ($ million)
Data Table on South America - Market size and forecast 2025-2030 ($ million)
Chart on South America - Year-over-year growth 2025-2030 (%)
Data Table on South America - Year-over-year growth 2025-2030 (%)
Chart on Regional Comparison - South America
Data Table on Regional Comparison - South America

12.6.1 Brazil - Market size and forecast 2025-2030

Chart on Brazil - Market size and forecast 2025-2030 ($ million)
Data Table on Brazil - Market size and forecast 2025-2030 ($ million)
Chart on Brazil - Year-over-year growth 2025-2030 (%)
Data Table on Brazil - Year-over-year growth 2025-2030 (%)

12.6.2 Argentina - Market size and forecast 2025-2030

Chart on Argentina - Market size and forecast 2025-2030 ($ million)
Data Table on Argentina - Market size and forecast 2025-2030 ($ million)
Chart on Argentina - Year-over-year growth 2025-2030 (%)
Data Table on Argentina - Year-over-year growth 2025-2030 (%)

12.6.3 Chile - Market size and forecast 2025-2030

Chart on Chile - Market size and forecast 2025-2030 ($ million)
Data Table on Chile - Market size and forecast 2025-2030 ($ million)
Chart on Chile - Year-over-year growth 2025-2030 (%)
Data Table on Chile - Year-over-year growth 2025-2030 (%)

12.7 Middle East and Africa - Market size and forecast 2025-2030

Chart on Middle East and Africa - Market size and forecast 2025-2030 ($ million)
Data Table on Middle East and Africa - Market size and forecast 2025-2030 ($ million)
Chart on Middle East and Africa - Year-over-year growth 2025-2030 (%)
Data Table on Middle East and Africa - Year-over-year growth 2025-2030 (%)
Chart on Regional Comparison - Middle East and Africa
Data Table on Regional Comparison - Middle East and Africa

12.7.1 Saudi Arabia - Market size and forecast 2025-2030

Chart on Saudi Arabia - Market size and forecast 2025-2030 ($ million)
Data Table on Saudi Arabia - Market size and forecast 2025-2030 ($ million)
Chart on Saudi Arabia - Year-over-year growth 2025-2030 (%)
Data Table on Saudi Arabia - Year-over-year growth 2025-2030 (%)

12.7.2 UAE - Market size and forecast 2025-2030

Chart on UAE - Market size and forecast 2025-2030 ($ million)
Data Table on UAE - Market size and forecast 2025-2030 ($ million)
Chart on UAE - Year-over-year growth 2025-2030 (%)
Data Table on UAE - Year-over-year growth 2025-2030 (%)

12.7.3 South Africa - Market size and forecast 2025-2030

Chart on South Africa - Market size and forecast 2025-2030 ($ million)
Data Table on South Africa - Market size and forecast 2025-2030 ($ million)
Chart on South Africa - Year-over-year growth 2025-2030 (%)
Data Table on South Africa - Year-over-year growth 2025-2030 (%)

12.7.4 Israel - Market size and forecast 2025-2030

Chart on Israel - Market size and forecast 2025-2030 ($ million)
Data Table on Israel - Market size and forecast 2025-2030 ($ million)
Chart on Israel - Year-over-year growth 2025-2030 (%)
Data Table on Israel - Year-over-year growth 2025-2030 (%)

12.7.5 Turkey - Market size and forecast 2025-2030

Chart on Turkey - Market size and forecast 2025-2030 ($ million)
Data Table on Turkey - Market size and forecast 2025-2030 ($ million)
Chart on Turkey - Year-over-year growth 2025-2030 (%)
Data Table on Turkey - Year-over-year growth 2025-2030 (%)

12.8 Market opportunity by geography

Market opportunity by geography ($ million)
Data Tables on Market opportunity by geography ($ million)

13. Drivers, Challenges, and Opportunity

13.1 Market drivers

Severe global healthcare workforce shortages accelerating demand automated clinical solutions
Rising chronic disease prevalence demanding high volume automated diagnostic testing
Strategic healthcare consolidation industry mergers driving capital investment automation infrastructure

13.2 Market challenges

High initial capital expenditure constraints restricting automation adoption small healthcare facilities
Complex interoperability fragmentation across legacy electronic health record systems hindering integration
Stringent cybersecurity regulatory compliance requirements prolonging product approval timelines

13.3 Impact of drivers and challenges

Impact of drivers and challenges in 2025 and 2030

13.4 Market opportunities

Rapid integration agentic AI autonomous clinical workflow platforms
Widespread transition toward modular automated pharmacy dispensing centralized compounding
Strategic portfolio separation conglomerates shedding assets focus differentiated automation

14. Competitive Landscape

14.1 Overview

14.2

Overview on criticality of inputs and factors of differentiation

14.3 Landscape disruption

Overview on factors of disruption

14.4 Industry risks

Impact of key risks on business

15. Competitive Analysis

15.1 Companies profiled

Companies covered

15.2 Company ranking index

15.3 Market positioning of companies

Matrix on companies position and classification

15.4 Abbott Laboratories

Abbott Laboratories - Overview
Abbott Laboratories - Business segments
Abbott Laboratories - Key news
Abbott Laboratories - Key offerings
Abbott Laboratories - Segment focus
SWOT

15.5 Agilent Technologies Inc.

Agilent Technologies Inc. - Overview
Agilent Technologies Inc. - Business segments
Agilent Technologies Inc. - Key news
Agilent Technologies Inc. - Key offerings
Agilent Technologies Inc. - Segment focus
SWOT

15.6 Azenta Inc.

Azenta Inc. - Overview
Azenta Inc. - Business segments
Azenta Inc. - Key offerings
Azenta Inc. - Segment focus
SWOT

15.7 Baxter International Inc.

Baxter International Inc. - Overview
Baxter International Inc. - Business segments
Baxter International Inc. - Key news
Baxter International Inc. - Key offerings
Baxter International Inc. - Segment focus
SWOT

15.8 Becton Dickinson and Co.

Becton Dickinson and Co. - Overview
Becton Dickinson and Co. - Business segments
Becton Dickinson and Co. - Key news
Becton Dickinson and Co. - Key offerings
Becton Dickinson and Co. - Segment focus
SWOT

15.9 Danaher Corp.

Danaher Corp. - Overview
Danaher Corp. - Business segments
Danaher Corp. - Key news
Danaher Corp. - Key offerings
Danaher Corp. - Segment focus
SWOT

15.10 F. Hoffmann La Roche Ltd.

F. Hoffmann La Roche Ltd. - Overview
F. Hoffmann La Roche Ltd. - Business segments
F. Hoffmann La Roche Ltd. - Key news
F. Hoffmann La Roche Ltd. - Key offerings
F. Hoffmann La Roche Ltd. - Segment focus
SWOT

15.11 GE HealthCare Technologies

GE HealthCare Technologies - Overview
GE HealthCare Technologies - Business segments
GE HealthCare Technologies - Key news
GE HealthCare Technologies - Key offerings
GE HealthCare Technologies - Segment focus
SWOT

15.12 Johnson and Johnson

Johnson and Johnson - Overview
Johnson and Johnson - Business segments
Johnson and Johnson - Key news
Johnson and Johnson - Key offerings
Johnson and Johnson - Segment focus
SWOT

15.13 Koninklijke Philips NV

Koninklijke Philips NV - Overview
Koninklijke Philips NV - Business segments
Koninklijke Philips NV - Key news
Koninklijke Philips NV - Key offerings
Koninklijke Philips NV - Segment focus
SWOT

15.14 Medtronic Plc

Medtronic Plc - Overview
Medtronic Plc - Business segments
Medtronic Plc - Key news
Medtronic Plc - Key offerings
Medtronic Plc - Segment focus
SWOT

15.15 Revvity Inc.

Revvity Inc. - Overview
Revvity Inc. - Business segments
Revvity Inc. - Key offerings
Revvity Inc. - Segment focus
SWOT

15.16 Siemens Healthineers AG

Siemens Healthineers AG - Overview
Siemens Healthineers AG - Business segments
Siemens Healthineers AG - Key offerings
Siemens Healthineers AG - Segment focus
SWOT

15.17 Smith and Nephew plc

Smith and Nephew plc - Overview
Smith and Nephew plc - Business segments
Smith and Nephew plc - Key offerings
Smith and Nephew plc - Segment focus
SWOT

15.18 Stryker Corp.

Stryker Corp. - Overview
Stryker Corp. - Business segments
Stryker Corp. - Key offerings
Stryker Corp. - Segment focus
SWOT

16. Appendix

16.1 Scope of the report

Market definition
Objectives
Notes and caveats

16.2 Inclusions and exclusions checklist

Inclusions checklist
Exclusions checklist

16.3 Currency conversion rates for US$

16.4 Research methodology

16.5 Data procurement

Information sources

16.6 Data validation

16.7 Validation techniques employed for market sizing

16.8 Data synthesis

16.9 360 degree market analysis

16.10 List of abbreviations

Research Methodology

Technavio presents a detailed picture of the market by way of study, synthesis, and summation of data from multiple sources. The analysts have presented the various facets of the market with a particular focus on identifying the key industry influencers. The data thus presented is comprehensive, reliable, and the result of extensive research, both primary and secondary.

INFORMATION SOURCES

Primary sources

  • Manufacturers and suppliers
  • Channel partners
  • Industry experts
  • Strategic decision makers

Secondary sources

  • Industry journals and periodicals
  • Government data
  • Financial reports of key industry players
  • Historical data
  • Press releases

DATA ANALYSIS

Data Synthesis

  • Collation of data
  • Estimation of key figures
  • Analysis of derived insights

Data Validation

  • Triangulation with data models
  • Reference against proprietary databases
  • Corroboration with industry experts

REPORT WRITING

Qualitative

  • Market drivers
  • Market challenges
  • Market trends
  • Five forces analysis

Quantitative

  • Market size and forecast
  • Market segmentation
  • Geographical insights
  • Competitive landscape

Interested in this report?

Get your sample now to see our research methodology and insights!

Download Now

Frequently Asked Questions

Medical Automation market growth will increase by USD 49629.6 million during 2026-2030.

The Medical Automation market is expected to grow at a CAGR of 9.5% during 2026-2030.

Medical Automation market is segmented by Application (Imaging automation, Therapeutic automation, Laboratory automation, Others) End-user (Hospitals and diagnostic centers, Research laboratories and institutes, Pharmacies, Others) Component (Hardware, Software, Services)

Abbott Laboratories, Accuray Inc., Agilent Technologies Inc., Azenta Inc., Baxter International Inc., Becton Dickinson and Co., Danaher Corp., F. Hoffmann La Roche Ltd., GE HealthCare Technologies, Hamilton Co., Intuitive Surgical Inc., Johnson and Johnson, Koninklijke Philips NV, Medtronic Plc, Omnicell Inc., Revvity Inc., Siemens Healthineers AG, Smith and Nephew plc, Stryker Corp., Terumo Corp. are a few of the key vendors in the Medical Automation market.

North America will register the highest growth rate of 43.2% among the other regions. Therefore, the Medical Automation market in North America is expected to garner significant business opportunities for the vendors during the forecast period.

US, Canada, Mexico, Germany, UK, France, Italy, Spain, The Netherlands, China, Japan, India, South Korea, Australia, Indonesia, Brazil, Argentina, Chile, Saudi Arabia, UAE, South Africa, Israel, Turkey

  • Severe global healthcare workforce shortages accelerating demand automated clinical solutions is the driving factor this market.

The Medical Automation market vendors should focus on grabbing business opportunities from the Application segment as it accounted for the largest market share in the base year.
RIA - Research AI Assistant
Ask RIA
