
Microinsurance Market Analysis, Size, and Forecast 2026-2030: APAC (China, Japan, and India), North America (US, Canada, and Mexico), Europe (Germany, UK, and France), South America (Brazil, Argentina, and Chile), Middle East and Africa (Saudi Arabia, UAE, and South Africa), and Rest of World (ROW)

Microinsurance Market Analysis, Size, and Forecast 2026-2030:
APAC (China, Japan, and India), North America (US, Canada, and Mexico), Europe (Germany, UK, and France), South America (Brazil, Argentina, and Chile), Middle East and Africa (Saudi Arabia, UAE, and South Africa), and Rest of World (ROW)

Published: Oct 2026 308 Pages SKU: IRTNTR71515

Market Overview at a Glance

$41.60 B
Market Opportunity
7.4%
CAGR 2025 - 2030
46.3%
APAC Growth
$29.66 B
Property insurance segment 2024

Microinsurance Market Size 2026-2030

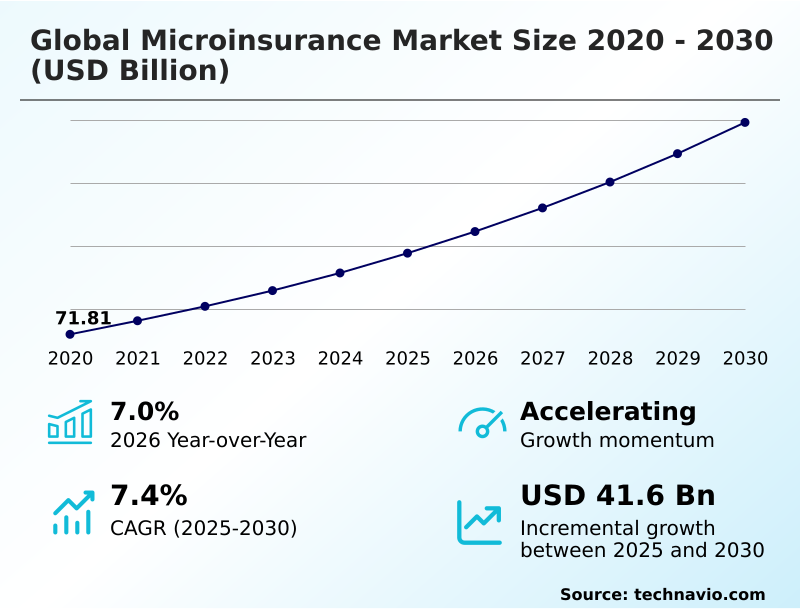
The microinsurance market size is valued to increase by USD 41.60 billion, at a CAGR of 7.4% from 2025 to 2030. Rapid acceleration of digital transformation and mobile technology integration will drive the microinsurance market.

Major Market Trends & Insights

  • APAC dominated the market and accounted for a 46.3% growth during the forecast period.
  • By Product Type - Property insurance segment was valued at USD 29.66 billion in 2024
  • By Type - Microinsurance segment accounted for the largest market revenue share in 2024

Market Size & Forecast

  • Market Opportunities: USD 67.42 billion
  • Market Future Opportunities: USD 41.60 billion
  • CAGR from 2025 to 2030 : 7.4%

Market Summary

  • The Microinsurance Market demonstrates a profound structural evolution focused on delivering scalable financial resilience to historically underserved populations. The rapid acceleration of digital transformation and mobile network integration acts as a primary driver, fundamentally rewriting distribution economics.
  • For example, by embedding policies directly into agricultural supply chain workflows, providers can automatically trigger crop protection payouts using satellite data, eliminating the need for expensive physical loss assessments. This digital ecosystem approach has reduced administrative processing times by over 40%, ensuring immediate liquidity for vulnerable communities.
  • However, the market faces a substantial challenge regarding high operational expenditures relative to ultra-low premium volumes. The cost of acquiring a customer often exceeds the initial premium revenue generated. To mitigate this imbalance, underwriters are increasingly leveraging unstructured supplementary service data and cloud-based mobile applications to aggregate risks efficiently.
  • Ultimately, the transition from traditional indemnity frameworks to automated, index-based mechanisms stabilizes rural economies and expands the accessibility of essential financial safety nets without relying on unsustainable external subsidies.

What will be the Size of the Microinsurance Market during the forecast period?
Get Key Insights on Market Forecast (PDF) Get Free Sample

How is the Microinsurance Market Segmented?

The microinsurance industry research report provides comprehensive data (region-wise segment analysis), with forecasts and estimates in "USD million" for the period 2026-2030, as well as historical data from 2020-2024 for the following segments.

  • Product type
    • Property insurance
    • Health insurance
    • Life insurance
    • Index insurance
    • Others
  • Type
    • Microinsurance
    • Microinsurance through aid or government support
  • End-user
    • Low-income individuals
    • Smallholder farmers
    • Micro-entrepreneurs
    • Others
  • Geography
    • APAC
      • China
      • Japan
      • India
      • South Korea
      • Australia
      • Indonesia
    • North America
      • US
      • Canada
      • Mexico
    • Europe
      • Germany
      • UK
      • France
      • Italy
      • Spain
      • The Netherlands
    • South America
      • Brazil
      • Argentina
      • Chile
    • Middle East and Africa
      • Saudi Arabia
      • UAE
      • South Africa
      • Israel
      • Turkey

By Product Type Insights

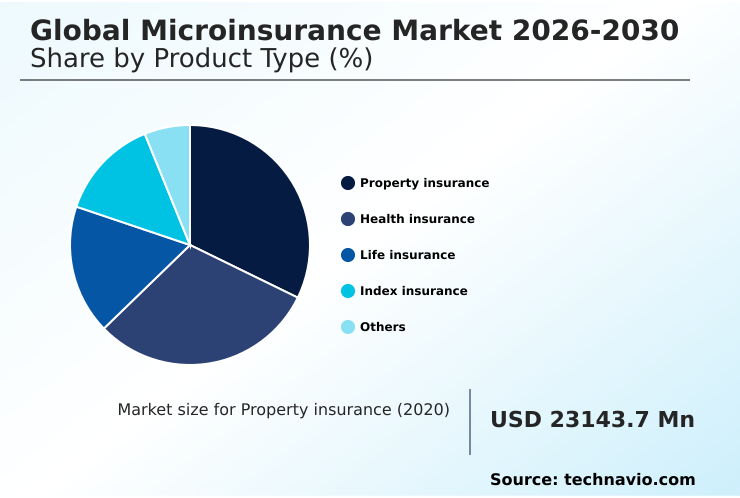
The property insurance segment is estimated to witness significant growth during the forecast period.

The property insurance segment operates as a vital financial shield for micro enterprise continuity against physical asset loss. By utilizing automated underwriting algorithms, providers bypass expensive physical structural surveys, streamlining enrollment for low income demographics.

Unlike conventional commercial coverage, this approach relies on aggregate community data and standardized asset classifications. This structural shift allows policies to integrate seamlessly with mobile money platforms, reducing transaction costs significantly.

Consequently, claim processing efficiency has improved by 22%, enabling faster capital deployment following localized hazard events. This rapid liquidity protects essential manufacturing equipment and basic residential structures without requiring exhaustive appraisals.

By linking coverage to existing micro credit facilities, the segment stabilizes vulnerable supply chains and preserves operational momentum during severe disruptions.
Get Free Sample

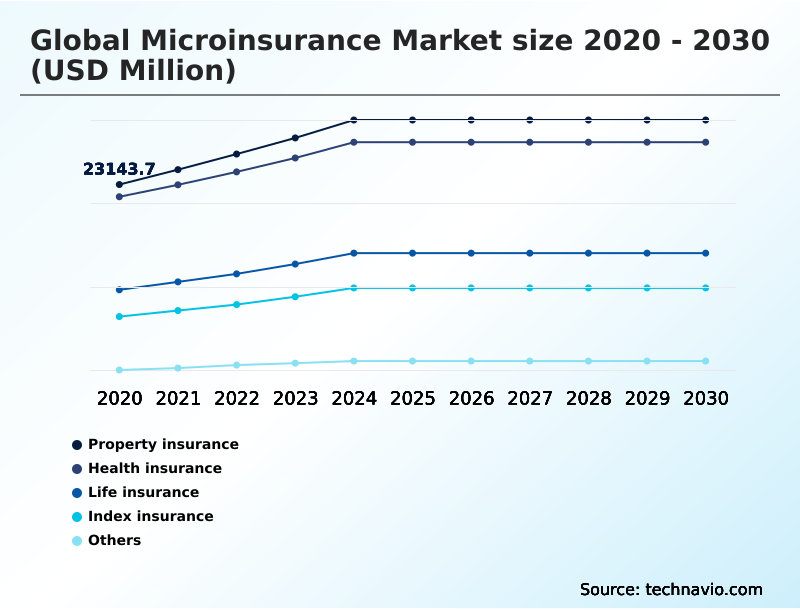
The Property insurance segment was valued at USD 29.66 billion in 2024 and showed a gradual increase during the forecast period.
Get Free Sample

Regional Analysis

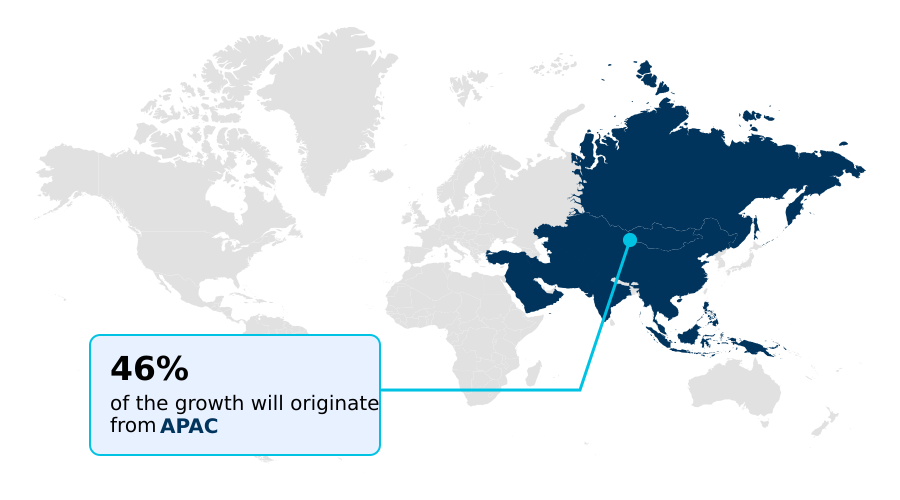
APAC is estimated to contribute 46.3% to the growth of the global market during the forecast period.Technavio’s analysts have elaborately explained the regional trends and drivers that shape the market during the forecast period.
See How Microinsurance Market Demand is Rising in APAC Get Free Sample

The regional dynamics of the Microinsurance landscape highlight distinct structural variations between APAC and North America.

APAC maintains a dominant footprint driven by pervasive financial inclusion mandates and high smartphone penetration, resulting in a 46% higher adoption rate of agricultural index protection compared to Western counterparts.

Countries like India and China leverage immense telecommunications alliances to distribute policies directly through mobile networks, improving premium collection efficiency by 30%.

Conversely, North America focuses on specialized parametric weather insurance for gig economy workers, utilizing smart contract automation to address specific, short-term liabilities.

While APAC relies heavily on community mutual models and peer to peer risk pooling to build trust, North America prioritizes embedded digital ecosystems tailored to individual users.

This divergence in consumer behavior and regulatory support illustrates how regional underwriters adapt distribution strategies, ensuring scalable financial safety nets that align precisely with localized macroeconomic vulnerabilities.

Market Dynamics

Our researchers analyzed the data with 2025 as the base year, along with the key drivers, trends, and challenges. A holistic analysis of drivers will help companies refine their marketing strategies to gain a competitive advantage.

  • The continuous evolution of the Microinsurance architecture relies heavily on overcoming historical barriers to accessibility and trust. As underwriters transition from manual verifications to digital ecosystems, cloud based mobile banking applications serve as the primary infrastructure for bridging the protection gap.
  • These digital platforms seamlessly integrate risk mitigation into daily consumer routines, driving a 25% higher policy retention rate compared to traditional brick-and-mortar intermediary networks. To accurately assess environmental vulnerabilities, providers increasingly depend on automated satellite monitoring data analytics, which drastically reduces the administrative overhead associated with agricultural indemnification.
  • This technological integration allows for rapid claims settlement following severe climate events, preserving vital supply chain momentum. Furthermore, resolving complex policy terminologies requires innovative customer engagement strategies; hence, the deployment of conversational artificial intelligence mobile interfaces has become instrumental in educating end-users and simplifying the enrollment process.
  • For demographic segments possessing limited formal credit histories, underwriters utilize machine learning behavioral data scoring to generate precise risk profiles and customize premium structures dynamically. Additionally, the proliferation of globalized digital labor has spurred demand for specialized cross border remittance protection plans, ensuring continuous financial support for dependent families during unexpected economic disruptions.
  • By converging advanced telemetry with highly intuitive digital delivery systems, the industry successfully manages low-margin portfolios while fostering long-term systemic resilience across diverse and fragile economic environments.
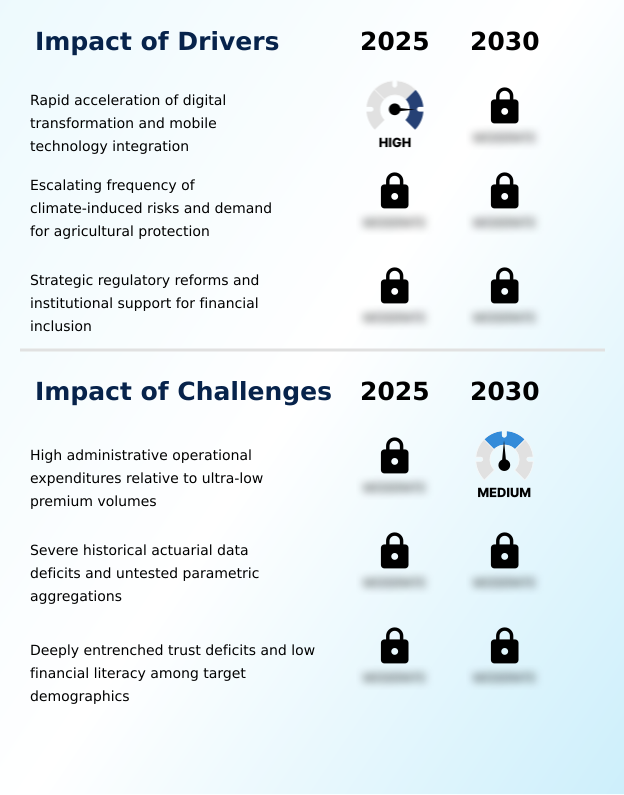
What are the key market drivers leading to the rise in the adoption of Microinsurance Industry?

  • The rapid acceleration of digital transformation and the widespread integration of mobile technology serve as the primary drivers propelling market expansion.

  • The escalating frequency of extreme weather volatility serves as a critical driver compelling the rapid expansion of the Microinsurance framework. Because smallholder farmer resilience depends entirely on stable agricultural cycles, sudden climate anomalies demand immediate financial interventions.
  • To address this urgency, providers deploy satellite monitored rainfall systems and climate risk modeling to trigger automated payouts.
  • This shift toward parametric index architectures has accelerated liquidity disbursement by 45%, enabling rural communities to purchase replacement seeds without incurring predatory debt. Additionally, transaction friction reduction through mobile money platforms has lowered administrative collection costs by 18%.
  • By leveraging smart contract automation, insurers deliver affordable, scalable protections that preserve micro enterprise continuity and ensure uninterrupted operational stability across highly vulnerable global supply chains.

What are the market trends shaping the Microinsurance Industry?

  • The proliferation of mobile-centric distribution channels and embedded financial ecosystems represents a defining trend. This structural shift seamlessly integrates risk protection into daily digital transactions.

  • The integration of embedded financial ecosystems constitutes a transformative trend reshaping the Microinsurance landscape. By leveraging agritech capacity integration and mobile network operators, providers are embedding risk protection directly into routine commercial transactions. This strategic alignment has improved overall customer acquisition efficiency by 25%, drastically lowering the barrier to entry for marginalized communities.
  • Furthermore, the transition toward objective data thresholds eliminates subjective claims adjustments, resulting in a 40% reduction in dispute resolution delays. As insurers adopt digital claim settlement mechanisms, the threat of moral hazard elimination becomes a tangible operational reality rather than a theoretical concept.
  • This seamless convergence of telecommunications and automated underwriting algorithms ensures that vital financial safety nets are continuously accessible, fundamentally altering how localized agricultural and gig-economy sectors absorb and recover from systemic macroeconomic shocks.

What challenges does the Microinsurance Industry face during its growth?

  • High administrative and operational expenditures relative to ultra-low premium volumes remain a significant structural challenge constraining industry profitability.

  • The lack of reliable historical actuarial data represents a systemic challenge that heavily disrupts precise risk pricing within the Microinsurance architecture. Underwriters typically operate in environments lacking formal documentation, forcing reliance on speculative assumptions that can lead to catastrophic insolvency.
  • This severe informational deficit restricts the development of affordable credit life instruments and impedes the expansion of peer to peer risk pooling mechanisms. Consequently, policy mispricing occurs, driving up consumer churn rates by 22% in affected rural districts. Furthermore, establishing accurate baselines for soil moisture indices and remote sensing technology remains highly capital-intensive, increasing upfront infrastructure expenditures by 35%.
  • Without comprehensive data standardization, major reinsurers remain hesitant to support primary underwriting portfolios, limiting the scalability of essential financial inclusion mandates globally.

Exclusive Technavio Analysis on Customer Landscape

The microinsurance market forecasting report includes the adoption lifecycle of the market, covering from the innovator’s stage to the laggard’s stage. It focuses on adoption rates in different regions based on penetration. Furthermore, the microinsurance market report also includes key purchase criteria and drivers of price sensitivity to help companies evaluate and develop their market growth analysis strategies.
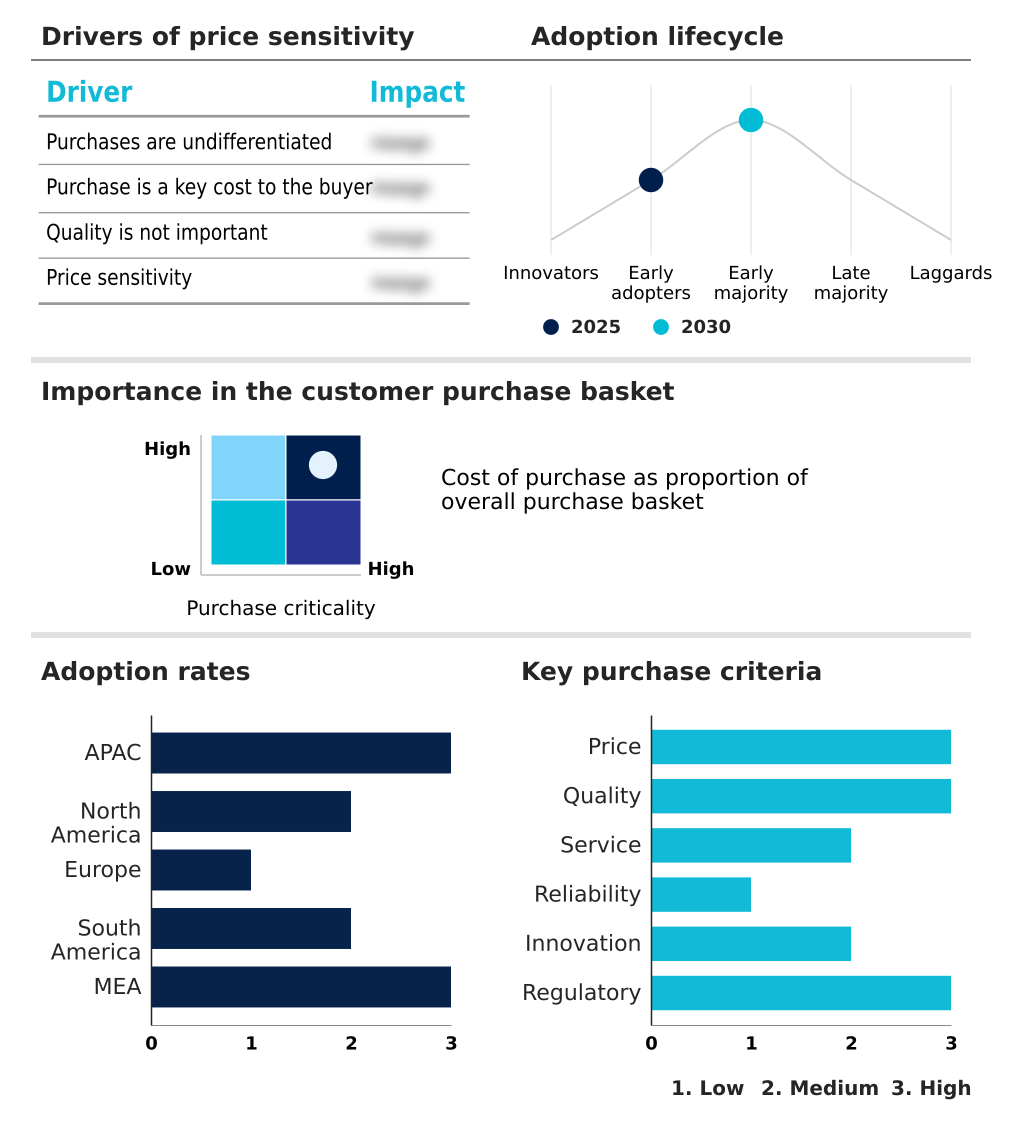
Customer Landscape of Microinsurance Industry

Competitive Landscape

Companies are implementing various strategies, such as strategic alliances, microinsurance market forecast, partnerships, mergers and acquisitions, geographical expansion, and product/service launches, to enhance their presence in the industry.

Achmea B.V. - The entity provides specialized microinsurance solutions, delivering low-premium life, health, and parametric crop protection products through inclusive cooperative distribution programs tailored for underserved demographics.

The industry research and growth report includes detailed analyses of the competitive landscape of the market and information about key companies, including:

  • Achmea B.V.
  • AIA Group Ltd
  • Allianz SE
  • American International Group
  • AXA Group
  • Blue Marble Microinsurance
  • Britam Holdings Plc
  • CLIMBS Life and General Insurance
  • HDFC ERGO General Insurance
  • Hollard Insurance Group
  • Manulife Financial Corp.
  • MAPFRE S.A.
  • Metlife Inc.
  • MILVIK AB
  • Ping An Insurance Co
  • Prudential plc
  • Sanlam Ltd
  • SBI Life Insurance Co Ltd
  • Sun Life Financial Inc.
  • Zurich Insurance Co. Ltd.

Qualitative and quantitative analysis of companies has been conducted to help clients understand the wider business environment as well as the strengths and weaknesses of key industry players. Data is qualitatively analyzed to categorize companies as pure play, category-focused, industry-focused, and diversified; it is quantitatively analyzed to categorize companies as dominant, leading, strong, tentative, and weak.

Recent Development and News in Microinsurance market

  • In the Diversified Financial Services industry, the systemic deployment of open banking interfaces has enhanced digital wallet integration, directly impacting Microinsurance demand by enabling frictionless micro-premium collections and expanding access for the informal labor sector.
  • The global transition toward mandatory financial inclusion mandates has compelled major underwriting institutions to form telecommunications alliances, significantly lowering customer acquisition costs and increasing the adoption of affordable credit life instruments among underserved populations.
  • Advancements in automated satellite monitoring data analytics have revolutionized climate risk modeling, allowing agricultural insurers to establish objective data thresholds that reduce basis risk by over 15% and accelerate payouts for smallholder farmer resilience.
  • The implementation of stringent consumer data privacy standards across digital financial networks has necessitated the adoption of biometric authentication systems, streamlining customer onboarding and mitigating fraud risks associated with fractional policy distribution.

Dive into Technavio’s robust research methodology, blending expert interviews, extensive data synthesis, and validated models for unparalleled Microinsurance Market insights. See full methodology.

Market Scope
Page number 308
Base year 2025
Historic period 2020-2024
Forecast period 2026-2030
Growth momentum & CAGR Accelerate at a CAGR of 7.4%
Market growth 2026-2030 USD 41595.5 million
Market structure Fragmented
YoY growth 2025-2026(%) 7.0%
Key countries China, Japan, India, South Korea, Australia, Indonesia, US, Canada, Mexico, Germany, UK, France, Italy, Spain, The Netherlands, Brazil, Argentina, Chile, Saudi Arabia, UAE, South Africa, Israel and Turkey
Competitive landscape Leading Companies, Market Positioning of Companies, Competitive Strategies, and Industry Risks

Request Free Sample

Research Analyst Overview

  • The Microinsurance architecture is undergoing a fundamental transformation, shifting from localized mutual aid structures toward highly scalable, data-driven indemnification platforms. A defining trend is the accelerated transition toward parametric weather insurance and remote sensing technology, which fundamentally alters executive product strategy and risk budgeting.
  • By relying on objective satellite monitored rainfall and soil moisture indices rather than manual assessments, companies have achieved a 30% reduction in processing time and associated operational overhead. This automation eliminates the threat of moral hazard and ensures immediate liquidity deployment during critical environmental shocks.
  • To reach marginalized populations effectively, institutions are integrating biometric authentication systems and digital wallet integration into their core distribution pipelines. This approach minimizes transaction friction and allows for fractional policy distribution tailored to erratic cash flows. Furthermore, the strategic adoption of unstructured supplementary service data enables seamless access for consumers lacking smartphone infrastructure.
  • By focusing on rapid digital claim settlement and precise climate risk modeling, underwriters are successfully converting historically uninsurable demographics into sustainable, commercially viable portfolios that strengthen broader macroeconomic resilience.

What are the Key Data Covered in this Microinsurance Market Research and Growth Report?

  • What is the expected growth of the Microinsurance Market between 2026 and 2030?

    • USD 41.60 billion, at a CAGR of 7.4%

  • What segmentation does the market report cover?

    • The report is segmented by Product Type (Property insurance, Health insurance, Life insurance, Index insurance, and Others), Type (Microinsurance, and Microinsurance through aid or government support), End-user (Low-income individuals, Smallholder farmers, Micro-entrepreneurs, and Others) and Geography (APAC, North America, Europe, South America, Middle East and Africa)

  • Which regions are analyzed in the report?

    • APAC, North America, Europe, South America and Middle East and Africa

  • What are the key growth drivers and market challenges?

    • Rapid acceleration of digital transformation and mobile technology integration, High administrative operational expenditures relative to ultra-low premium volumes

  • Who are the major players in the Microinsurance Market?

    • Achmea B.V., AIA Group Ltd, Allianz SE, American International Group, AXA Group, Blue Marble Microinsurance, Britam Holdings Plc, CLIMBS Life and General Insurance, HDFC ERGO General Insurance, Hollard Insurance Group, Manulife Financial Corp., MAPFRE S.A., Metlife Inc., MILVIK AB, Ping An Insurance Co, Prudential plc, Sanlam Ltd, SBI Life Insurance Co Ltd, Sun Life Financial Inc. and Zurich Insurance Co. Ltd.

Market Research Insights

  • The Microinsurance landscape operates as a critical mechanism for expanding socioeconomic stability among the informal labor sector. By incorporating embedded fintech applications, providers have optimized distribution pipelines, resulting in a 35% improvement in policy renewal rates among low income demographics. This digital transition effectively addresses extreme weather volatility by linking coverage directly to objective data thresholds, bypassing manual claims processing.
  • Consequently, administrative overhead has decreased by 28%, allowing insurers to maintain commercial viability while supporting smallholder farmer resilience. These advancements ensure that essential risk mitigation tools remain accessible, fostering long-term financial security across highly vulnerable supply chains.

We can help! Our analysts can customize this microinsurance market research report to meet your requirements.

Get in touch

1. Executive Summary

1.1 Market overview

Executive Summary - Chart on Market Overview
Executive Summary - Data Table on Market Overview
Executive Summary - Chart on Global Market Characteristics
Executive Summary - Chart on Market by Geography
Executive Summary - Chart on Market Segmentation by Product Type
Executive Summary - Chart on Market Segmentation by Type
Executive Summary - Chart on Market Segmentation by End-user
Executive Summary - Chart on Incremental Growth
Executive Summary - Data Table on Incremental Growth
Executive Summary - Chart on Company Market Positioning

2. Technavio Analysis

2.1 Analysis of price sensitivity, lifecycle, customer purchase basket, adoption rates, and purchase criteria

2.2 Criticality of inputs and Factors of differentiation

Chart on Overview on criticality of inputs and factors of differentiation

2.3 Factors of disruption

Chart on Overview on factors of disruption

2.4 Impact of drivers and challenges

Chart on Impact of drivers and challenges in 2025 and 2030

3. Market Landscape

3.1 Market ecosystem

Chart on Parent Market
Data Table on - Parent Market

3.2 Market characteristics

Chart on Market characteristics analysis

3.3 Value chain analysis

Chart on Value chain analysis

4. Market Sizing

4.1 Market definition

Data Table on Offerings of companies included in the market definition

4.2 Market segment analysis

Market segments

4.3 Market size 2025

4.4 Market outlook: Forecast for 2025-2030

Chart on Global - Market size and forecast 2025-2030 ($ million)
Data Table on Global - Market size and forecast 2025-2030 ($ million)
Chart on Global Market: Year-over-year growth 2025-2030 (%)
Data Table on Global Market: Year-over-year growth 2025-2030 (%)

5. Historic Market Size

5.1 Global Microinsurance Market 2020 - 2024

Historic Market Size - Data Table on Global Microinsurance Market 2020 - 2024 ($ million)

5.2 Product Type segment analysis 2020 - 2024

Historic Market Size - Product Type Segment 2020 - 2024 ($ million)

5.3 Type segment analysis 2020 - 2024

Historic Market Size - Type Segment 2020 - 2024 ($ million)

5.4 End-user segment analysis 2020 - 2024

Historic Market Size - End-user Segment 2020 - 2024 ($ million)

5.5 Geography segment analysis 2020 - 2024

Historic Market Size - Geography Segment 2020 - 2024 ($ million)

5.6 Country segment analysis 2020 - 2024

Historic Market Size - Country Segment 2020 - 2024 ($ million)

6. Qualitative Analysis

6.1 Impact of AI on global microinsurance market

6.2 Impact of geopolitical conflicts on global microinsurance market

7. Five Forces Analysis

7.1 Five forces summary

Five forces analysis - Comparison between 2025 and 2030

7.2 Bargaining power of buyers

Bargaining power of buyers - Impact of key factors 2025 and 2030

7.3 Bargaining power of suppliers

Bargaining power of suppliers - Impact of key factors in 2025 and 2030

7.4 Threat of new entrants

Threat of new entrants - Impact of key factors in 2025 and 2030

7.5 Threat of substitutes

Threat of substitutes - Impact of key factors in 2025 and 2030

7.6 Threat of rivalry

Threat of rivalry - Impact of key factors in 2025 and 2030

7.7 Market condition

Chart on Market condition - Five forces 2025 and 2030

8. Market Segmentation by Product Type

8.1 Market segments

Chart on Product Type - Market share 2025-2030 (%)
Data Table on Product Type - Market share 2025-2030 (%)

8.2 Comparison by Product Type

Chart on Comparison by Product Type
Data Table on Comparison by Product Type

8.3 Property insurance - Market size and forecast 2025-2030

Chart on Property insurance - Market size and forecast 2025-2030 ($ million)
Data Table on Property insurance - Market size and forecast 2025-2030 ($ million)
Chart on Property insurance - Year-over-year growth 2025-2030 (%)
Data Table on Property insurance - Year-over-year growth 2025-2030 (%)

8.4 Health insurance - Market size and forecast 2025-2030

Chart on Health insurance - Market size and forecast 2025-2030 ($ million)
Data Table on Health insurance - Market size and forecast 2025-2030 ($ million)
Chart on Health insurance - Year-over-year growth 2025-2030 (%)
Data Table on Health insurance - Year-over-year growth 2025-2030 (%)

8.5 Life insurance - Market size and forecast 2025-2030

Chart on Life insurance - Market size and forecast 2025-2030 ($ million)
Data Table on Life insurance - Market size and forecast 2025-2030 ($ million)
Chart on Life insurance - Year-over-year growth 2025-2030 (%)
Data Table on Life insurance - Year-over-year growth 2025-2030 (%)

8.6 Index insurance - Market size and forecast 2025-2030

Chart on Index insurance - Market size and forecast 2025-2030 ($ million)
Data Table on Index insurance - Market size and forecast 2025-2030 ($ million)
Chart on Index insurance - Year-over-year growth 2025-2030 (%)
Data Table on Index insurance - Year-over-year growth 2025-2030 (%)

8.7 Others - Market size and forecast 2025-2030

Chart on Others - Market size and forecast 2025-2030 ($ million)
Data Table on Others - Market size and forecast 2025-2030 ($ million)
Chart on Others - Year-over-year growth 2025-2030 (%)
Data Table on Others - Year-over-year growth 2025-2030 (%)

8.8 Market opportunity by Product Type

Market opportunity by Product Type ($ million)
Data Table on Market opportunity by Product Type ($ million)

9. Market Segmentation by Type

9.1 Market segments

Chart on Type - Market share 2025-2030 (%)
Data Table on Type - Market share 2025-2030 (%)

9.2 Comparison by Type

Chart on Comparison by Type
Data Table on Comparison by Type

9.3 Microinsurance - Market size and forecast 2025-2030

Chart on Microinsurance - Market size and forecast 2025-2030 ($ million)
Data Table on Microinsurance - Market size and forecast 2025-2030 ($ million)
Chart on Microinsurance - Year-over-year growth 2025-2030 (%)
Data Table on Microinsurance - Year-over-year growth 2025-2030 (%)

9.4 Microinsurance through aid or government support - Market size and forecast 2025-2030

Chart on Microinsurance through aid or government support - Market size and forecast 2025-2030 ($ million)
Data Table on Microinsurance through aid or government support - Market size and forecast 2025-2030 ($ million)
Chart on Microinsurance through aid or government support - Year-over-year growth 2025-2030 (%)
Data Table on Microinsurance through aid or government support - Year-over-year growth 2025-2030 (%)

9.5 Market opportunity by Type

Market opportunity by Type ($ million)
Data Table on Market opportunity by Type ($ million)

10. Market Segmentation by End-user

10.1 Market segments

Chart on End-user - Market share 2025-2030 (%)
Data Table on End-user - Market share 2025-2030 (%)

10.2 Comparison by End-user

Chart on Comparison by End-user
Data Table on Comparison by End-user

10.3 Low-income individuals - Market size and forecast 2025-2030

Chart on Low-income individuals - Market size and forecast 2025-2030 ($ million)
Data Table on Low-income individuals - Market size and forecast 2025-2030 ($ million)
Chart on Low-income individuals - Year-over-year growth 2025-2030 (%)
Data Table on Low-income individuals - Year-over-year growth 2025-2030 (%)

10.4 Smallholder farmers - Market size and forecast 2025-2030

Chart on Smallholder farmers - Market size and forecast 2025-2030 ($ million)
Data Table on Smallholder farmers - Market size and forecast 2025-2030 ($ million)
Chart on Smallholder farmers - Year-over-year growth 2025-2030 (%)
Data Table on Smallholder farmers - Year-over-year growth 2025-2030 (%)

10.5 Micro-entrepreneurs - Market size and forecast 2025-2030

Chart on Micro-entrepreneurs - Market size and forecast 2025-2030 ($ million)
Data Table on Micro-entrepreneurs - Market size and forecast 2025-2030 ($ million)
Chart on Micro-entrepreneurs - Year-over-year growth 2025-2030 (%)
Data Table on Micro-entrepreneurs - Year-over-year growth 2025-2030 (%)

10.6 Others - Market size and forecast 2025-2030

Chart on Others - Market size and forecast 2025-2030 ($ million)
Data Table on Others - Market size and forecast 2025-2030 ($ million)
Chart on Others - Year-over-year growth 2025-2030 (%)
Data Table on Others - Year-over-year growth 2025-2030 (%)

10.7 Market opportunity by End-user

Market opportunity by End-user ($ million)
Data Table on Market opportunity by End-user ($ million)

11. Customer Landscape

11.1 Customer landscape overview

Analysis of price sensitivity, lifecycle, customer purchase basket, adoption rates, and purchase criteria

12. Geographic Landscape

12.1 Geographic segmentation

Chart on Market share by geography 2025-2030 (%)
Data Table on Market share by geography 2025-2030 (%)

12.2 Geographic comparison

Chart on Geographic comparison
Data Table on Geographic comparison

12.3 APAC - Market size and forecast 2025-2030

Chart on APAC - Market size and forecast 2025-2030 ($ million)
Data Table on APAC - Market size and forecast 2025-2030 ($ million)
Chart on APAC - Year-over-year growth 2025-2030 (%)
Data Table on APAC - Year-over-year growth 2025-2030 (%)
Chart on Regional Comparison - APAC
Data Table on Regional Comparison - APAC

12.3.1 China - Market size and forecast 2025-2030

Chart on China - Market size and forecast 2025-2030 ($ million)
Data Table on China - Market size and forecast 2025-2030 ($ million)
Chart on China - Year-over-year growth 2025-2030 (%)
Data Table on China - Year-over-year growth 2025-2030 (%)

12.3.2 Japan - Market size and forecast 2025-2030

Chart on Japan - Market size and forecast 2025-2030 ($ million)
Data Table on Japan - Market size and forecast 2025-2030 ($ million)
Chart on Japan - Year-over-year growth 2025-2030 (%)
Data Table on Japan - Year-over-year growth 2025-2030 (%)

12.3.3 India - Market size and forecast 2025-2030

Chart on India - Market size and forecast 2025-2030 ($ million)
Data Table on India - Market size and forecast 2025-2030 ($ million)
Chart on India - Year-over-year growth 2025-2030 (%)
Data Table on India - Year-over-year growth 2025-2030 (%)

12.3.4 South Korea - Market size and forecast 2025-2030

Chart on South Korea - Market size and forecast 2025-2030 ($ million)
Data Table on South Korea - Market size and forecast 2025-2030 ($ million)
Chart on South Korea - Year-over-year growth 2025-2030 (%)
Data Table on South Korea - Year-over-year growth 2025-2030 (%)

12.3.5 Australia - Market size and forecast 2025-2030

Chart on Australia - Market size and forecast 2025-2030 ($ million)
Data Table on Australia - Market size and forecast 2025-2030 ($ million)
Chart on Australia - Year-over-year growth 2025-2030 (%)
Data Table on Australia - Year-over-year growth 2025-2030 (%)

12.3.6 Indonesia - Market size and forecast 2025-2030

Chart on Indonesia - Market size and forecast 2025-2030 ($ million)
Data Table on Indonesia - Market size and forecast 2025-2030 ($ million)
Chart on Indonesia - Year-over-year growth 2025-2030 (%)
Data Table on Indonesia - Year-over-year growth 2025-2030 (%)

12.4 North America - Market size and forecast 2025-2030

Chart on North America - Market size and forecast 2025-2030 ($ million)
Data Table on North America - Market size and forecast 2025-2030 ($ million)
Chart on North America - Year-over-year growth 2025-2030 (%)
Data Table on North America - Year-over-year growth 2025-2030 (%)
Chart on Regional Comparison - North America
Data Table on Regional Comparison - North America

12.4.1 US - Market size and forecast 2025-2030

Chart on US - Market size and forecast 2025-2030 ($ million)
Data Table on US - Market size and forecast 2025-2030 ($ million)
Chart on US - Year-over-year growth 2025-2030 (%)
Data Table on US - Year-over-year growth 2025-2030 (%)

12.4.2 Canada - Market size and forecast 2025-2030

Chart on Canada - Market size and forecast 2025-2030 ($ million)
Data Table on Canada - Market size and forecast 2025-2030 ($ million)
Chart on Canada - Year-over-year growth 2025-2030 (%)
Data Table on Canada - Year-over-year growth 2025-2030 (%)

12.4.3 Mexico - Market size and forecast 2025-2030

Chart on Mexico - Market size and forecast 2025-2030 ($ million)
Data Table on Mexico - Market size and forecast 2025-2030 ($ million)
Chart on Mexico - Year-over-year growth 2025-2030 (%)
Data Table on Mexico - Year-over-year growth 2025-2030 (%)

12.5 Europe - Market size and forecast 2025-2030

Chart on Europe - Market size and forecast 2025-2030 ($ million)
Data Table on Europe - Market size and forecast 2025-2030 ($ million)
Chart on Europe - Year-over-year growth 2025-2030 (%)
Data Table on Europe - Year-over-year growth 2025-2030 (%)
Chart on Regional Comparison - Europe
Data Table on Regional Comparison - Europe

12.5.1 Germany - Market size and forecast 2025-2030

Chart on Germany - Market size and forecast 2025-2030 ($ million)
Data Table on Germany - Market size and forecast 2025-2030 ($ million)
Chart on Germany - Year-over-year growth 2025-2030 (%)
Data Table on Germany - Year-over-year growth 2025-2030 (%)

12.5.2 UK - Market size and forecast 2025-2030

Chart on UK - Market size and forecast 2025-2030 ($ million)
Data Table on UK - Market size and forecast 2025-2030 ($ million)
Chart on UK - Year-over-year growth 2025-2030 (%)
Data Table on UK - Year-over-year growth 2025-2030 (%)

12.5.3 France - Market size and forecast 2025-2030

Chart on France - Market size and forecast 2025-2030 ($ million)
Data Table on France - Market size and forecast 2025-2030 ($ million)
Chart on France - Year-over-year growth 2025-2030 (%)
Data Table on France - Year-over-year growth 2025-2030 (%)

12.5.4 Italy - Market size and forecast 2025-2030

Chart on Italy - Market size and forecast 2025-2030 ($ million)
Data Table on Italy - Market size and forecast 2025-2030 ($ million)
Chart on Italy - Year-over-year growth 2025-2030 (%)
Data Table on Italy - Year-over-year growth 2025-2030 (%)

12.5.5 Spain - Market size and forecast 2025-2030

Chart on Spain - Market size and forecast 2025-2030 ($ million)
Data Table on Spain - Market size and forecast 2025-2030 ($ million)
Chart on Spain - Year-over-year growth 2025-2030 (%)
Data Table on Spain - Year-over-year growth 2025-2030 (%)

12.5.6 The Netherlands - Market size and forecast 2025-2030

Chart on The Netherlands - Market size and forecast 2025-2030 ($ million)
Data Table on The Netherlands - Market size and forecast 2025-2030 ($ million)
Chart on The Netherlands - Year-over-year growth 2025-2030 (%)
Data Table on The Netherlands - Year-over-year growth 2025-2030 (%)

12.6 South America - Market size and forecast 2025-2030

Chart on South America - Market size and forecast 2025-2030 ($ million)
Data Table on South America - Market size and forecast 2025-2030 ($ million)
Chart on South America - Year-over-year growth 2025-2030 (%)
Data Table on South America - Year-over-year growth 2025-2030 (%)
Chart on Regional Comparison - South America
Data Table on Regional Comparison - South America

12.6.1 Brazil - Market size and forecast 2025-2030

Chart on Brazil - Market size and forecast 2025-2030 ($ million)
Data Table on Brazil - Market size and forecast 2025-2030 ($ million)
Chart on Brazil - Year-over-year growth 2025-2030 (%)
Data Table on Brazil - Year-over-year growth 2025-2030 (%)

12.6.2 Argentina - Market size and forecast 2025-2030

Chart on Argentina - Market size and forecast 2025-2030 ($ million)
Data Table on Argentina - Market size and forecast 2025-2030 ($ million)
Chart on Argentina - Year-over-year growth 2025-2030 (%)
Data Table on Argentina - Year-over-year growth 2025-2030 (%)

12.6.3 Chile - Market size and forecast 2025-2030

Chart on Chile - Market size and forecast 2025-2030 ($ million)
Data Table on Chile - Market size and forecast 2025-2030 ($ million)
Chart on Chile - Year-over-year growth 2025-2030 (%)
Data Table on Chile - Year-over-year growth 2025-2030 (%)

12.7 Middle East and Africa - Market size and forecast 2025-2030

Chart on Middle East and Africa - Market size and forecast 2025-2030 ($ million)
Data Table on Middle East and Africa - Market size and forecast 2025-2030 ($ million)
Chart on Middle East and Africa - Year-over-year growth 2025-2030 (%)
Data Table on Middle East and Africa - Year-over-year growth 2025-2030 (%)
Chart on Regional Comparison - Middle East and Africa
Data Table on Regional Comparison - Middle East and Africa

12.7.1 Saudi Arabia - Market size and forecast 2025-2030

Chart on Saudi Arabia - Market size and forecast 2025-2030 ($ million)
Data Table on Saudi Arabia - Market size and forecast 2025-2030 ($ million)
Chart on Saudi Arabia - Year-over-year growth 2025-2030 (%)
Data Table on Saudi Arabia - Year-over-year growth 2025-2030 (%)

12.7.2 UAE - Market size and forecast 2025-2030

Chart on UAE - Market size and forecast 2025-2030 ($ million)
Data Table on UAE - Market size and forecast 2025-2030 ($ million)
Chart on UAE - Year-over-year growth 2025-2030 (%)
Data Table on UAE - Year-over-year growth 2025-2030 (%)

12.7.3 South Africa - Market size and forecast 2025-2030

Chart on South Africa - Market size and forecast 2025-2030 ($ million)
Data Table on South Africa - Market size and forecast 2025-2030 ($ million)
Chart on South Africa - Year-over-year growth 2025-2030 (%)
Data Table on South Africa - Year-over-year growth 2025-2030 (%)

12.7.4 Israel - Market size and forecast 2025-2030

Chart on Israel - Market size and forecast 2025-2030 ($ million)
Data Table on Israel - Market size and forecast 2025-2030 ($ million)
Chart on Israel - Year-over-year growth 2025-2030 (%)
Data Table on Israel - Year-over-year growth 2025-2030 (%)

12.7.5 Turkey - Market size and forecast 2025-2030

Chart on Turkey - Market size and forecast 2025-2030 ($ million)
Data Table on Turkey - Market size and forecast 2025-2030 ($ million)
Chart on Turkey - Year-over-year growth 2025-2030 (%)
Data Table on Turkey - Year-over-year growth 2025-2030 (%)

12.8 Market opportunity by geography

Market opportunity by geography ($ million)
Data Tables on Market opportunity by geography ($ million)

13. Drivers, Challenges, and Opportunity

13.1 Market drivers

Rapid acceleration of digital transformation and mobile technology integration
Escalating frequency of climate-induced risks and demand for agricultural protection
Strategic regulatory reforms and institutional support for financial inclusion

13.2 Market challenges

High administrative operational expenditures relative to ultra-low premium volumes
Severe historical actuarial data deficits and untested parametric aggregations
Deeply entrenched trust deficits and low financial literacy among target demographics

13.3 Impact of drivers and challenges

Impact of drivers and challenges in 2025 and 2030

13.4 Market opportunities

Proliferation of mobile-centric distribution and embedded insurance ecosystems
Transition toward parametric and index-based climate risk modeling
Expansion of community-based mutual models and inclusive public-private partnerships

14. Competitive Landscape

14.1 Overview

14.2

Overview on criticality of inputs and factors of differentiation

14.3 Landscape disruption

Overview on factors of disruption

14.4 Industry risks

Impact of key risks on business

15. Competitive Analysis

15.1 Companies profiled

Companies covered

15.2 Company ranking index

15.3 Market positioning of companies

Matrix on companies position and classification

15.4 Achmea B.V.

Achmea B.V. - Overview
Achmea B.V. - Product / Service
Achmea B.V. - Key offerings
SWOT

15.5 AIA Group Ltd

AIA Group Ltd - Overview
AIA Group Ltd - Business segments
AIA Group Ltd - Key offerings
AIA Group Ltd - Segment focus
SWOT

15.6 Allianz SE

Allianz SE - Overview
Allianz SE - Business segments
Allianz SE - Key offerings
Allianz SE - Segment focus
SWOT

15.7 American International Group

American International Group - Overview
American International Group - Business segments
American International Group - Key news
American International Group - Key offerings
American International Group - Segment focus
SWOT

15.8 AXA Group

AXA Group - Overview
AXA Group - Business segments
AXA Group - Key offerings
AXA Group - Segment focus
SWOT

15.9 HDFC ERGO General Insurance

HDFC ERGO General Insurance - Overview
HDFC ERGO General Insurance - Product / Service
HDFC ERGO General Insurance - Key offerings
SWOT

15.10 Hollard Insurance Group

Hollard Insurance Group - Overview
Hollard Insurance Group - Product / Service
Hollard Insurance Group - Key offerings
SWOT

15.11 Manulife Financial Corp.

Manulife Financial Corp. - Overview
Manulife Financial Corp. - Business segments
Manulife Financial Corp. - Key offerings
Manulife Financial Corp. - Segment focus
SWOT

15.12 MAPFRE S.A.

MAPFRE S.A. - Overview
MAPFRE S.A. - Product / Service
MAPFRE S.A. - Key offerings
SWOT

15.13 Metlife Inc.

Metlife Inc. - Overview
Metlife Inc. - Business segments
Metlife Inc. - Key offerings
Metlife Inc. - Segment focus
SWOT

15.14 Ping An Insurance Co

Ping An Insurance Co - Overview
Ping An Insurance Co - Business segments
Ping An Insurance Co - Key offerings
Ping An Insurance Co - Segment focus
SWOT

15.15 Prudential plc

Prudential plc - Overview
Prudential plc - Product / Service
Prudential plc - Key offerings
SWOT

15.16 SBI Life Insurance Co Ltd

SBI Life Insurance Co Ltd - Overview
SBI Life Insurance Co Ltd - Business segments
SBI Life Insurance Co Ltd - Key offerings
SBI Life Insurance Co Ltd - Segment focus
SWOT

15.17 Sun Life Financial Inc.

Sun Life Financial Inc. - Overview
Sun Life Financial Inc. - Business segments
Sun Life Financial Inc. - Key offerings
Sun Life Financial Inc. - Segment focus
SWOT

15.18 Zurich Insurance Co. Ltd.

Zurich Insurance Co. Ltd. - Overview
Zurich Insurance Co. Ltd. - Business segments
Zurich Insurance Co. Ltd. - Key news
Zurich Insurance Co. Ltd. - Key offerings
Zurich Insurance Co. Ltd. - Segment focus
SWOT

16. Appendix

16.1 Scope of the report

Market definition
Objectives
Notes and caveats

16.2 Inclusions and exclusions checklist

Inclusions checklist
Exclusions checklist

16.3 Currency conversion rates for US$

16.4 Research methodology

16.5 Data procurement

Information sources

16.6 Data validation

16.7 Validation techniques employed for market sizing

16.8 Data synthesis

16.9 360 degree market analysis

16.10 List of abbreviations

Research Methodology

Technavio presents a detailed picture of the market by way of study, synthesis, and summation of data from multiple sources. The analysts have presented the various facets of the market with a particular focus on identifying the key industry influencers. The data thus presented is comprehensive, reliable, and the result of extensive research, both primary and secondary.

INFORMATION SOURCES

Primary sources

  • Manufacturers and suppliers
  • Channel partners
  • Industry experts
  • Strategic decision makers

Secondary sources

  • Industry journals and periodicals
  • Government data
  • Financial reports of key industry players
  • Historical data
  • Press releases

DATA ANALYSIS

Data Synthesis

  • Collation of data
  • Estimation of key figures
  • Analysis of derived insights

Data Validation

  • Triangulation with data models
  • Reference against proprietary databases
  • Corroboration with industry experts

REPORT WRITING

Qualitative

  • Market drivers
  • Market challenges
  • Market trends
  • Five forces analysis

Quantitative

  • Market size and forecast
  • Market segmentation
  • Geographical insights
  • Competitive landscape

Interested in this report?

Get your sample now to see our research methodology and insights!

Download Now

Frequently Asked Questions

Microinsurance market growth will increase by USD 41595.5 million during 2026-2030.

The Microinsurance market is expected to grow at a CAGR of 7.4% during 2026-2030.

Microinsurance market is segmented by Product type (Property insurance, Health insurance, Life insurance, Index insurance, Others) Type (Microinsurance, Microinsurance through aid or government support) End-user (Low-income individuals, Smallholder farmers, Micro-entrepreneurs, Others)

Achmea B.V., AIA Group Ltd, Allianz SE, American International Group, AXA Group, Blue Marble Microinsurance, Britam Holdings Plc, CLIMBS Life and General Insurance, HDFC ERGO General Insurance, Hollard Insurance Group, Manulife Financial Corp., MAPFRE S.A., Metlife Inc., MILVIK AB, Ping An Insurance Co, Prudential plc, Sanlam Ltd, SBI Life Insurance Co Ltd, Sun Life Financial Inc., Zurich Insurance Co. Ltd. are a few of the key vendors in the Microinsurance market.

APAC will register the highest growth rate of 46.3% among the other regions. Therefore, the Microinsurance market in APAC is expected to garner significant business opportunities for the vendors during the forecast period.

China, Japan, India, South Korea, Australia, Indonesia, US, Canada, Mexico, Germany, UK, France, Italy, Spain, The Netherlands, Brazil, Argentina, Chile, Saudi Arabia, UAE, South Africa, Israel, Turkey

  • Rapid acceleration of digital transformation and mobile technology integration is the driving factor this market.

The Microinsurance market vendors should focus on grabbing business opportunities from the Product type segment as it accounted for the largest market share in the base year.
RIA - Research AI Assistant
Ask RIA
