
Mirror Coatings Market Analysis, Size, and Forecast 2026-2030: APAC (China, Japan, and India), North America (US, Canada, and Mexico), Europe (Germany, UK, and France), Middle East and Africa (Saudi Arabia, UAE, and South Africa), South America (Brazil, Argentina, and Chile), and Rest of World (ROW)

Mirror Coatings Market Analysis, Size, and Forecast 2026-2030:
APAC (China, Japan, and India), North America (US, Canada, and Mexico), Europe (Germany, UK, and France), Middle East and Africa (Saudi Arabia, UAE, and South Africa), South America (Brazil, Argentina, and Chile), and Rest of World (ROW)

Published: Oct 2026 289 Pages SKU: IRTNTR72988

Market Overview at a Glance

$330.4 Mn
Market Opportunity
6.9%
CAGR 2025 - 2030
39.6%
APAC Growth
$317.3 Mn
Building and construction segment 2024

Mirror Coatings Market Size 2026-2030

The mirror coatings market size is valued to increase by USD 330.4 million, at a CAGR of 6.9% from 2025 to 2030. Expansion of sustainable architectural and construction industries will drive the mirror coatings market.

Major Market Trends & Insights

  • APAC dominated the market and accounted for a 39.6% growth during the forecast period.
  • By End-user - Building and construction segment was valued at USD 317.3 million in 2024
  • By Type - Polyurethane segment accounted for the largest market revenue share in 2024

Market Size & Forecast

  • Market Opportunities: USD 546.2 million
  • Market Future Opportunities: USD 330.4 million
  • CAGR from 2025 to 2030 : 6.9%

Market Summary

  • The Mirror Coatings Market is characterized by a rapid structural shift toward highly durable, low-emission protective surface treatments driven by global urbanization and renewable energy expansion. Facility operators in the concentrated solar power sector rely heavily on advanced reflective formulations to protect delicate metallic layers from severe environmental degradation.
  • By upgrading to next-generation weather-resistant back-paints, solar infrastructure managers have extended reflector lifespans by 25%, drastically reducing replacement overhead and maintenance downtime. The continuous expansion of sustainable architectural and construction industries acts as a primary growth catalyst, as modern building designs increasingly incorporate expansive, energy-efficient glass facades to optimize thermal management.
  • However, strict environmental regulations on volatile organic compounds pose a formidable challenge to manufacturers. Transitioning from traditional solvent-based systems to compliant waterborne alternatives requires substantial capital investment in exhaust filtration and curing technologies, often increasing initial production costs.
  • Despite these regulatory hurdles, the relentless pursuit of energy conservation and superior optical performance ensures sustained industrial reliance on advanced mirror coating technologies.

What will be the Size of the Mirror Coatings Market during the forecast period?
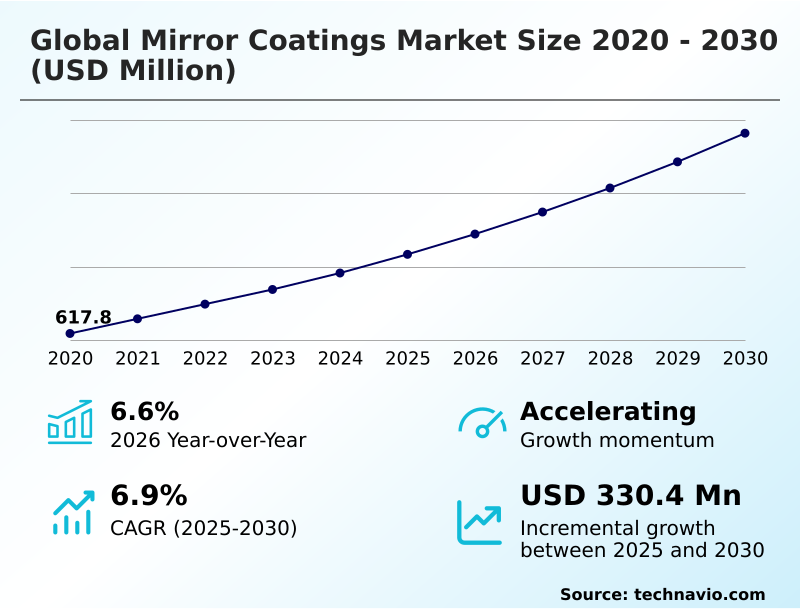
Get Key Insights on Market Forecast (PDF) Get Free Sample

How is the Mirror Coatings Market Segmented?

The mirror coatings industry research report provides comprehensive data (region-wise segment analysis), with forecasts and estimates in "USD million" for the period 2026-2030, as well as historical data from 2020-2024 for the following segments.

  • End-user
    • Building and construction
    • Automotive and transportation
    • Energy
    • Others
  • Type
    • Polyurethane
    • Epoxy
    • Acrylic
  • Formulation
    • Solvent-based
    • Water-based
    • Nanotechnology-based
  • Geography
    • APAC
      • China
      • Japan
      • India
      • South Korea
      • Australia
      • Indonesia
    • North America
      • US
      • Canada
      • Mexico
    • Europe
      • Germany
      • UK
      • France
      • Italy
      • Spain
      • The Netherlands
    • Middle East and Africa
      • Saudi Arabia
      • UAE
      • South Africa
      • Israel
      • Turkey
    • South America
      • Brazil
      • Argentina
      • Chile

By End-user Insights

The building and construction segment is estimated to witness significant growth during the forecast period.

The building and construction sector dictates the primary consumption patterns for advanced protective surface treatments, distinctively prioritizing environmental degradation resistance and optical reflectivity maximization.

Unlike the automotive industry, architectural applications demand expansive anti-reflective optical layers and robust edge corrosion prevention to withstand prolonged elemental exposure.

Manufacturers increasingly utilize magnetron sputtering processes and ion-assisted deposition to engineer high-damage-threshold mirrors and precise thin-film optical filters for commercial facades. These specialized techniques ensure exceptional molecular adhesion strength and rapid curing speeds, optimizing factory throughput.

By implementing these high-performance coatings, commercial developers have improved building energy retention by 24%, significantly lowering lifecycle maintenance costs.

The integration of high reflectivity laser mirrors in specialized structural designs further differentiates this segment, establishing stringent performance benchmarks that drive continuous material science innovation across the supply chain.
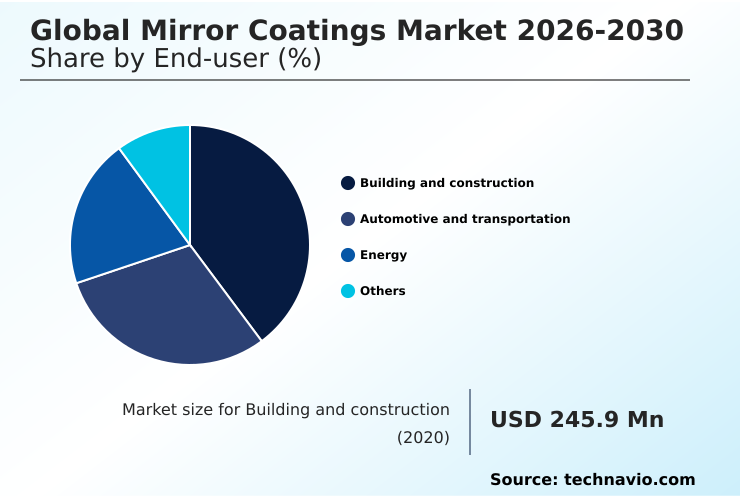
Get Free Sample

The Building and construction segment was valued at USD 317.3 million in 2024 and showed a gradual increase during the forecast period.
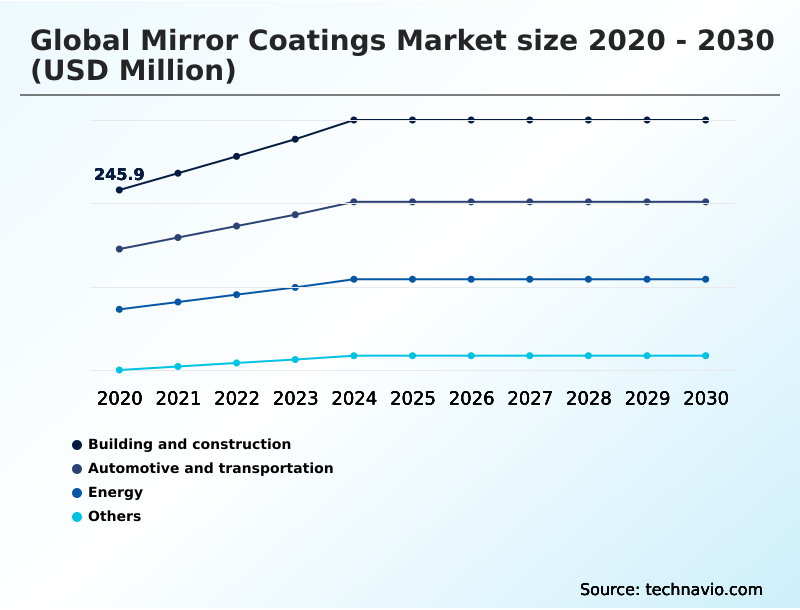
Get Free Sample

Regional Analysis

APAC is estimated to contribute 39.6% to the growth of the global market during the forecast period.Technavio’s analysts have elaborately explained the regional trends and drivers that shape the market during the forecast period.
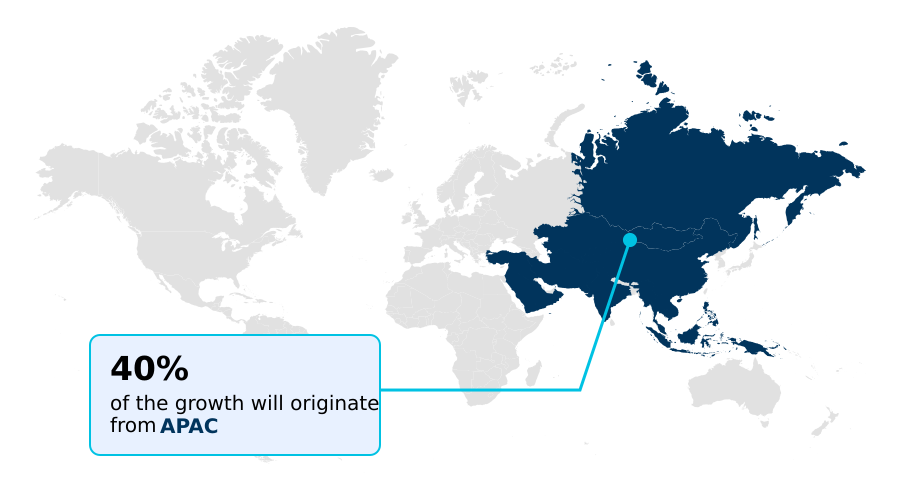
See How Mirror Coatings Market Demand is Rising in APAC Get Free Sample

APAC dominates the global manufacturing landscape, driven by massive infrastructure investments and rapid industrialization compared to North America and Europe.

The region exhibits a 35% higher adoption rate of advanced metallic film deposition techniques for producing protected aluminum coatings and enhanced silver mirrors.

This dominance is fueled by the extensive deployment of concentrated solar power reflectors and commercial initiatives targeting artificial lighting reduction in urban centers.

Regional suppliers leverage superior film-forming capabilities and cross-linking density enhancement to ensure robust atmospheric oxidation prevention and chemical corrosion shielding in harsh climates.

Consequently, APAC manufacturers have achieved a 12% reduction in production cycle times and a 20% decrease in supply chain logistics costs. These operational efficiencies allow local enterprises to scale rapidly, outperforming Western counterparts in both volume and cost-competitiveness.

Market Dynamics

Our researchers analyzed the data with 2025 as the base year, along with the key drivers, trends, and challenges. A holistic analysis of drivers will help companies refine their marketing strategies to gain a competitive advantage.

  • The industrial landscape is witnessing a critical water-based eco-friendly formulation transition as regulatory bodies globally enforce stricter chemical emission standards. Manufacturers are heavily investing in nanotechnology integration for self-cleaning surfaces to enhance the longevity and performance of exterior glass installations.
  • This evolution is particularly crucial for architectural glass facade energy efficiency, where advanced protective layers regulate thermal dynamics and reduce reliance on mechanical cooling. Simultaneously, the expansion of smart mirror technology sensor compatibility is revolutionizing interior design and automotive applications, demanding highly specialized coatings that do not interfere with electronic signals.
  • The concentrated solar power infrastructure expansion further accelerates the need for robust protective solutions, directly impacting dielectric mirror coating optical performance under extreme environmental stress. In the automotive sector, the deployment of automotive exterior trim protective layers ensures long-lasting aesthetics and resistance to harsh weather conditions.
  • To meet stringent ecological mandates, there is a widespread ultraviolet-cured low emission system adoption, which improves factory throughput by accelerating drying times. Facilities utilizing these systems have observed a 15% increase in processing efficiency compared to legacy methods.
  • Production techniques like magnetron sputtering thin film deposition and ion assisted deposition reflectance optimization are becoming industry standards for achieving high reflectivity laser mirror manufacturing. Furthermore, optimizing polyurethane back paint moisture resistance, epoxy protective layer chemical durability, and acrylic surface treatment weatherability remains essential for ensuring solvent borne system regulatory compliance while maintaining superior optical clarity across diverse applications.
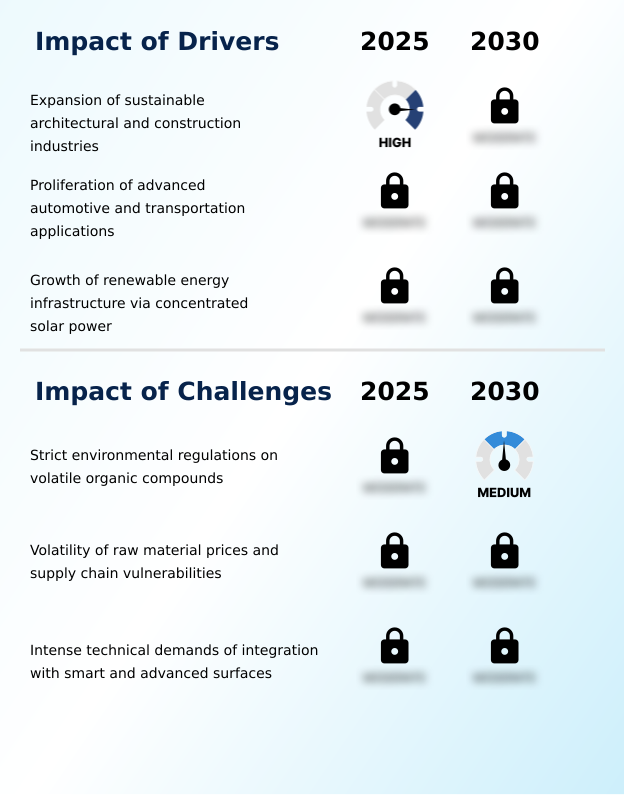
What are the key market drivers leading to the rise in the adoption of Mirror Coatings Industry?

  • The continuous expansion of sustainable architectural and construction industries serves as a primary catalyst accelerating the demand for advanced reflective surface treatments.

  • The rapid expansion of urban infrastructure is accelerating the deployment of high-performance polyurethane resin systems and epoxy protective layers across commercial and residential sectors.
  • Modern construction increasingly utilizes acrylic surface treatments on expansive architectural glass facades to optimize natural lighting and reduce mechanical cooling system reliance.
  • Simultaneously, metropolitan housing expansion and the mass production of advanced automotive rearview assemblies require durable coatings that ensure long-term surface hardness retention.
  • This demand surge is propelled by strict hazardous air pollutant limitation policies, compelling manufacturers to innovate for ecological mandate compliance.
  • By integrating these advanced protective layers, construction firms have improved structural thermal efficiency by 18%, while automotive manufacturers report a 25% decrease in warranty claims related to mirror degradation. These measurable improvements directly enhance profitability and operational sustainability for end-users.

What are the market trends shaping the Mirror Coatings Industry?

  • The market is experiencing a significant shift toward water-based and eco-friendly formulations. This transition is primarily driven by tightening environmental regulations and the growing industrial emphasis on sustainable manufacturing practices.

  • The transition toward waterborne resin formulations and ultraviolet-cured alternatives is fundamentally altering production methodologies across the industrial landscape. Manufacturers are prioritizing nanotechnology surface integration to develop advanced dielectric mirror coatings that align with sustainable architectural design principles.
  • This shift is driven by the necessity to meet stringent green building certifications and the rising demand for energy conservation materials in commercial infrastructure. By enhancing solar radiation reflection and ensuring ultraviolet transmission minimization, these advanced formulations improve building thermal efficiency by up to 22%. Consequently, facility operators experience a 15% reduction in HVAC energy consumption, directly lowering operational overhead.
  • This technological evolution enables businesses to achieve compliance with ecological mandates while maintaining superior optical performance and extending the lifecycle of exterior glass installations.

What challenges does the Mirror Coatings Industry face during its growth?

  • Strict environmental regulations limiting volatile organic compound emissions present a significant barrier, increasing compliance costs and complicating the formulation of traditional high-performance reflective systems.

  • The mandatory phase-out of traditional solvent-borne systems presents significant operational hurdles for chemical formulators striving for volatile organic compound reduction. Transitioning to low-emission alternatives often compromises critical performance metrics, particularly moisture penetration prevention and alkaline mortar seepage protection in high-humidity environments.
  • Manufacturers face substantial capital expenditures to upgrade facilities with advanced exhaust filtration systems while attempting to achieve moisture resistance optimization. This regulatory pressure complicates the production of coatings necessary for optical clarity preservation in modern structural daylighting systems. Consequently, production costs have escalated by up to 20%, forcing companies to reevaluate pricing strategies.
  • Despite these constraints, maintaining thermal insulation improvement remains essential, requiring continuous research investments to balance environmental compliance with the rigorous mechanical durability demanded by global construction and automotive sectors.

Exclusive Technavio Analysis on Customer Landscape

The mirror coatings market forecasting report includes the adoption lifecycle of the market, covering from the innovator’s stage to the laggard’s stage. It focuses on adoption rates in different regions based on penetration. Furthermore, the mirror coatings market report also includes key purchase criteria and drivers of price sensitivity to help companies evaluate and develop their market growth analysis strategies.
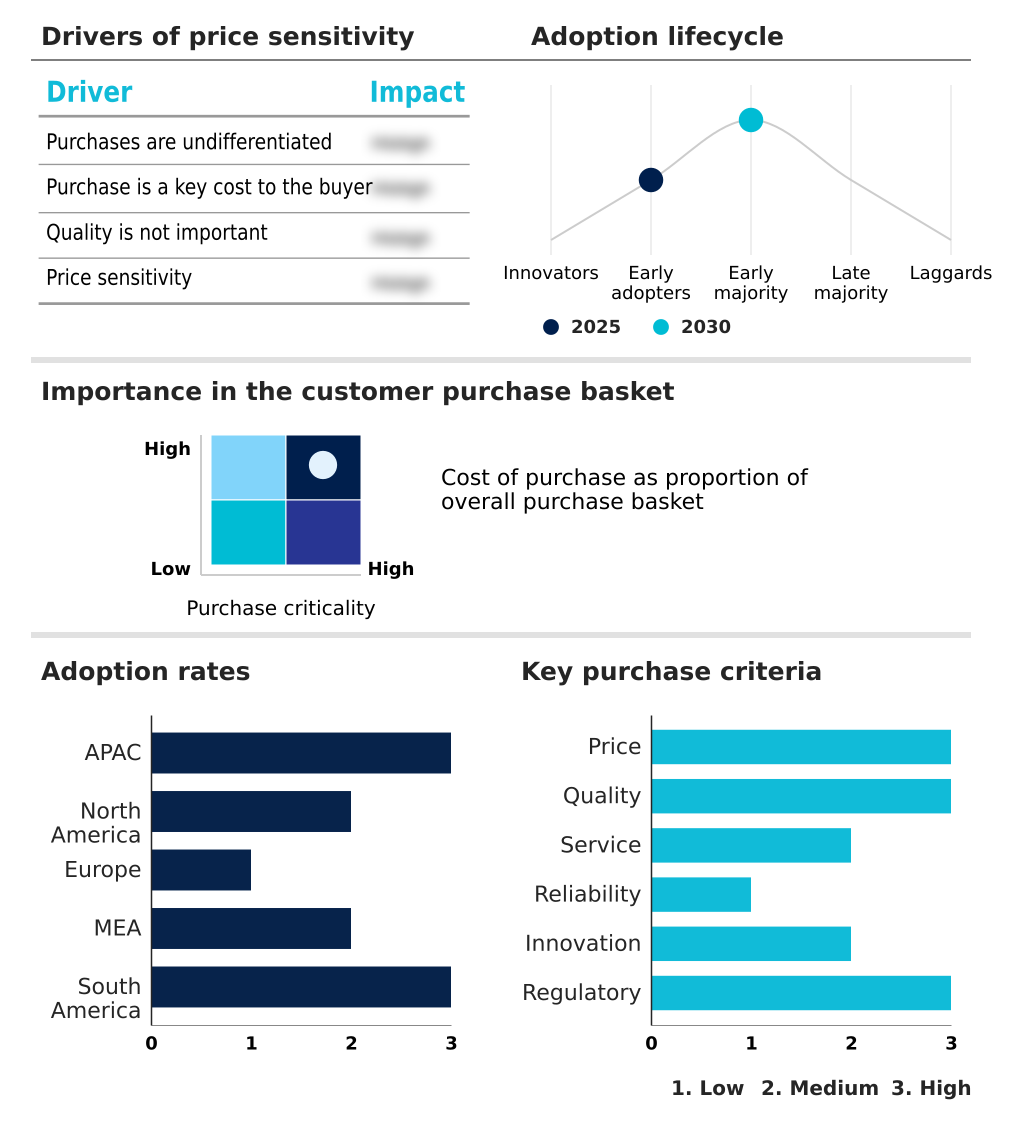
Customer Landscape of Mirror Coatings Industry

Competitive Landscape

Companies are implementing various strategies, such as strategic alliances, mirror coatings market forecast, partnerships, mergers and acquisitions, geographical expansion, and product/service launches, to enhance their presence in the industry.

Abrisa Technologies - The entity provides precision optical treatments, including protected aluminum, enhanced silver, and dielectric configurations, engineered to maximize reflectivity and environmental durability for commercial and industrial applications.

The industry research and growth report includes detailed analyses of the competitive landscape of the market and information about key companies, including:

  • Abrisa Technologies
  • AccuCoat Inc.
  • Alkor Technologies Inc.
  • Befort Wetzlar OD GmbH
  • Carl Zeiss AG
  • Coherent Corp.
  • Edmund Optics Inc.
  • GEOMATEC Co. Ltd.
  • Hind High Vacuum Co. Pvt. Ltd.
  • Jenoptik AG
  • Lambda Research Optics Inc.
  • NANEO Precision IBS Coatings
  • Opto Technological Laboratory
  • Precision Optical Inc.
  • SCHOTT AG
  • Spectrum Coatings
  • Thorlabs Inc.
  • UAB Optonas
  • VisiMax Technologies
  • ZeCoat Corp.

Qualitative and quantitative analysis of companies has been conducted to help clients understand the wider business environment as well as the strengths and weaknesses of key industry players. Data is qualitatively analyzed to categorize companies as pure play, category-focused, industry-focused, and diversified; it is quantitatively analyzed to categorize companies as dominant, leading, strong, tentative, and weak.

Recent Development and News in Mirror coatings market

  • In the Diversified Chemicals industry, the accelerated transition toward bio-based solvents and low-emission resin technologies has directly impacted Mirror Coatings demand by requiring formulators to re-engineer protective backing paints for compliance with strict volatile organic compound limits, improving workplace safety metrics by up to 30%.
  • The implementation of stricter environmental mandates governing hazardous air pollutants has disrupted traditional solvent-borne manufacturing processes, forcing Mirror Coatings producers to invest heavily in waterborne and ultraviolet-cured systems to maintain market access across regulated regions like Europe.
  • Advancements in nanotechnology and surface modification chemicals have enabled the development of highly durable self-cleaning protective layers, thereby increasing the adoption rate of advanced Mirror Coatings in commercial architectural applications by enhancing resistance to atmospheric oxidation and moisture penetration.
  • Supply chain volatility concerning high-purity metallic pigments and specialized acrylic binders has prompted manufacturers to optimize thin-film deposition techniques, directly influencing the production cost and availability of premium Mirror Coatings used in concentrated solar power infrastructure.

Dive into Technavio’s robust research methodology, blending expert interviews, extensive data synthesis, and validated models for unparalleled Mirror Coatings Market insights. See full methodology.

Market Scope
Page number 289
Base year 2025
Historic period 2020-2024
Forecast period 2026-2030
Growth momentum & CAGR Accelerate at a CAGR of 6.9%
Market growth 2026-2030 USD 330.4 million
Market structure Fragmented
YoY growth 2025-2026(%) 6.6%
Key countries China, Japan, India, South Korea, Australia, Indonesia, US, Canada, Mexico, Germany, UK, France, Italy, Spain, The Netherlands, Saudi Arabia, UAE, South Africa, Israel, Turkey, Brazil, Argentina and Chile
Competitive landscape Leading Companies, Market Positioning of Companies, Competitive Strategies, and Industry Risks

Request Free Sample

Research Analyst Overview

  • The Mirror Coatings industry is undergoing a rigorous transformation as manufacturers pivot toward environmentally compliant and mechanically superior protective surface treatments. Decision-makers at the boardroom level are increasingly prioritizing the adoption of waterborne resin formulations and ultraviolet-cured alternatives to mitigate the compliance risks associated with traditional solvent-borne systems.
  • This strategic realignment is critical for maintaining operational continuity amid tightening global emission standards. By upgrading metallic film deposition techniques, industrial facilities have improved the durability of dielectric mirror coatings, resulting in a 30% reduction in premature mechanical failures during extreme weather exposure.
  • The integration of advanced polyurethane resin systems and epoxy protective layers ensures robust defense against moisture ingress and chemical corrosion, directly enhancing product longevity. Transitioning to these low-emission technologies allows enterprises to streamline their environmental auditing processes while preserving the stringent optical clarity required by premium architectural and automotive clients.
  • This continuous material science innovation directly supports long-term corporate sustainability goals and optimizes lifecycle maintenance expenditures across heavy-duty commercial applications.

What are the Key Data Covered in this Mirror Coatings Market Research and Growth Report?

  • What is the expected growth of the Mirror Coatings Market between 2026 and 2030?

    • USD 330.4 million, at a CAGR of 6.9%

  • What segmentation does the market report cover?

    • The report is segmented by End-user (Building and construction, Automotive and transportation, Energy, and Others), Type (Polyurethane, Epoxy, and Acrylic), Formulation (Solvent-based, Water-based, and Nanotechnology-based) and Geography (APAC, North America, Europe, Middle East and Africa, South America)

  • Which regions are analyzed in the report?

    • APAC, North America, Europe, Middle East and Africa and South America

  • What are the key growth drivers and market challenges?

    • Expansion of sustainable architectural and construction industries, Strict environmental regulations on volatile organic compounds

  • Who are the major players in the Mirror Coatings Market?

    • Abrisa Technologies, AccuCoat Inc., Alkor Technologies Inc., Befort Wetzlar OD GmbH, Carl Zeiss AG, Coherent Corp., Edmund Optics Inc., GEOMATEC Co. Ltd., Hind High Vacuum Co. Pvt. Ltd., Jenoptik AG, Lambda Research Optics Inc., NANEO Precision IBS Coatings, Opto Technological Laboratory, Precision Optical Inc., SCHOTT AG, Spectrum Coatings, Thorlabs Inc., UAB Optonas, VisiMax Technologies and ZeCoat Corp.

Market Research Insights

  • The Mirror Coatings Market is rapidly evolving as manufacturers prioritize ecological mandate compliance and hazardous air pollutant limitation. Industrial operators are aggressively adopting advanced waterborne and ultraviolet-cured systems to achieve optimal moisture resistance optimization and long-term surface hardness retention.
  • By implementing these next-generation protective layers, commercial developers have recorded a 20% improvement in structural energy efficiency and a 15% reduction in lifecycle maintenance costs for exterior glass facades. Furthermore, the integration of these formulations ensures superior optical clarity preservation, reducing the need for artificial lighting in commercial spaces by up to 18%.
  • This strategic shift enables businesses to balance strict environmental compliance with the rigorous mechanical durability demanded by modern architectural and automotive applications.

We can help! Our analysts can customize this mirror coatings market research report to meet your requirements.

Get in touch

1. Executive Summary

1.1 Market overview

Executive Summary - Chart on Market Overview
Executive Summary - Data Table on Market Overview
Executive Summary - Chart on Global Market Characteristics
Executive Summary - Chart on Market by Geography
Executive Summary - Chart on Market Segmentation by End-user
Executive Summary - Chart on Market Segmentation by Type
Executive Summary - Chart on Market Segmentation by Formulation
Executive Summary - Chart on Incremental Growth
Executive Summary - Data Table on Incremental Growth
Executive Summary - Chart on Company Market Positioning

2. Technavio Analysis

2.1 Analysis of price sensitivity, lifecycle, customer purchase basket, adoption rates, and purchase criteria

2.2 Criticality of inputs and Factors of differentiation

Chart on Overview on criticality of inputs and factors of differentiation

2.3 Factors of disruption

Chart on Overview on factors of disruption

2.4 Impact of drivers and challenges

Chart on Impact of drivers and challenges in 2025 and 2030

3. Market Landscape

3.1 Market ecosystem

Chart on Parent Market
Data Table on - Parent Market

3.2 Market characteristics

Chart on Market characteristics analysis

3.3 Value chain analysis

Chart on Value chain analysis

4. Market Sizing

4.1 Market definition

Data Table on Offerings of companies included in the market definition

4.2 Market segment analysis

Market segments

4.3 Market size 2025

4.4 Market outlook: Forecast for 2025-2030

Chart on Global - Market size and forecast 2025-2030 ($ million)
Data Table on Global - Market size and forecast 2025-2030 ($ million)
Chart on Global Market: Year-over-year growth 2025-2030 (%)
Data Table on Global Market: Year-over-year growth 2025-2030 (%)

5. Historic Market Size

5.1 Global Mirror Coatings Market 2020 - 2024

Historic Market Size - Data Table on Global Mirror Coatings Market 2020 - 2024 ($ million)

5.2 End-user segment analysis 2020 - 2024

Historic Market Size - End-user Segment 2020 - 2024 ($ million)

5.3 Type segment analysis 2020 - 2024

Historic Market Size - Type Segment 2020 - 2024 ($ million)

5.4 Formulation segment analysis 2020 - 2024

Historic Market Size - Formulation Segment 2020 - 2024 ($ million)

5.5 Geography segment analysis 2020 - 2024

Historic Market Size - Geography Segment 2020 - 2024 ($ million)

5.6 Country segment analysis 2020 - 2024

Historic Market Size - Country Segment 2020 - 2024 ($ million)

6. Qualitative Analysis

6.1 Impact of AI on global mirror coatings market

6.2 Impact of geopolitical conflicts on global mirror coatings market

7. Five Forces Analysis

7.1 Five forces summary

Five forces analysis - Comparison between 2025 and 2030

7.2 Bargaining power of buyers

Bargaining power of buyers - Impact of key factors 2025 and 2030

7.3 Bargaining power of suppliers

Bargaining power of suppliers - Impact of key factors in 2025 and 2030

7.4 Threat of new entrants

Threat of new entrants - Impact of key factors in 2025 and 2030

7.5 Threat of substitutes

Threat of substitutes - Impact of key factors in 2025 and 2030

7.6 Threat of rivalry

Threat of rivalry - Impact of key factors in 2025 and 2030

7.7 Market condition

Chart on Market condition - Five forces 2025 and 2030

8. Market Segmentation by End-user

8.1 Market segments

Chart on End-user - Market share 2025-2030 (%)
Data Table on End-user - Market share 2025-2030 (%)

8.2 Comparison by End-user

Chart on Comparison by End-user
Data Table on Comparison by End-user

8.3 Building and construction - Market size and forecast 2025-2030

Chart on Building and construction - Market size and forecast 2025-2030 ($ million)
Data Table on Building and construction - Market size and forecast 2025-2030 ($ million)
Chart on Building and construction - Year-over-year growth 2025-2030 (%)
Data Table on Building and construction - Year-over-year growth 2025-2030 (%)

8.4 Automotive and transportation - Market size and forecast 2025-2030

Chart on Automotive and transportation - Market size and forecast 2025-2030 ($ million)
Data Table on Automotive and transportation - Market size and forecast 2025-2030 ($ million)
Chart on Automotive and transportation - Year-over-year growth 2025-2030 (%)
Data Table on Automotive and transportation - Year-over-year growth 2025-2030 (%)

8.5 Energy - Market size and forecast 2025-2030

Chart on Energy - Market size and forecast 2025-2030 ($ million)
Data Table on Energy - Market size and forecast 2025-2030 ($ million)
Chart on Energy - Year-over-year growth 2025-2030 (%)
Data Table on Energy - Year-over-year growth 2025-2030 (%)

8.6 Others - Market size and forecast 2025-2030

Chart on Others - Market size and forecast 2025-2030 ($ million)
Data Table on Others - Market size and forecast 2025-2030 ($ million)
Chart on Others - Year-over-year growth 2025-2030 (%)
Data Table on Others - Year-over-year growth 2025-2030 (%)

8.7 Market opportunity by End-user

Market opportunity by End-user ($ million)
Data Table on Market opportunity by End-user ($ million)

9. Market Segmentation by Type

9.1 Market segments

Chart on Type - Market share 2025-2030 (%)
Data Table on Type - Market share 2025-2030 (%)

9.2 Comparison by Type

Chart on Comparison by Type
Data Table on Comparison by Type

9.3 Polyurethane - Market size and forecast 2025-2030

Chart on Polyurethane - Market size and forecast 2025-2030 ($ million)
Data Table on Polyurethane - Market size and forecast 2025-2030 ($ million)
Chart on Polyurethane - Year-over-year growth 2025-2030 (%)
Data Table on Polyurethane - Year-over-year growth 2025-2030 (%)

9.4 Epoxy - Market size and forecast 2025-2030

Chart on Epoxy - Market size and forecast 2025-2030 ($ million)
Data Table on Epoxy - Market size and forecast 2025-2030 ($ million)
Chart on Epoxy - Year-over-year growth 2025-2030 (%)
Data Table on Epoxy - Year-over-year growth 2025-2030 (%)

9.5 Acrylic - Market size and forecast 2025-2030

Chart on Acrylic - Market size and forecast 2025-2030 ($ million)
Data Table on Acrylic - Market size and forecast 2025-2030 ($ million)
Chart on Acrylic - Year-over-year growth 2025-2030 (%)
Data Table on Acrylic - Year-over-year growth 2025-2030 (%)

9.6 Market opportunity by Type

Market opportunity by Type ($ million)
Data Table on Market opportunity by Type ($ million)

10. Market Segmentation by Formulation

10.1 Market segments

Chart on Formulation - Market share 2025-2030 (%)
Data Table on Formulation - Market share 2025-2030 (%)

10.2 Comparison by Formulation

Chart on Comparison by Formulation
Data Table on Comparison by Formulation

10.3 Solvent-based - Market size and forecast 2025-2030

Chart on Solvent-based - Market size and forecast 2025-2030 ($ million)
Data Table on Solvent-based - Market size and forecast 2025-2030 ($ million)
Chart on Solvent-based - Year-over-year growth 2025-2030 (%)
Data Table on Solvent-based - Year-over-year growth 2025-2030 (%)

10.4 Water-based - Market size and forecast 2025-2030

Chart on Water-based - Market size and forecast 2025-2030 ($ million)
Data Table on Water-based - Market size and forecast 2025-2030 ($ million)
Chart on Water-based - Year-over-year growth 2025-2030 (%)
Data Table on Water-based - Year-over-year growth 2025-2030 (%)

10.5 Nanotechnology-based - Market size and forecast 2025-2030

Chart on Nanotechnology-based - Market size and forecast 2025-2030 ($ million)
Data Table on Nanotechnology-based - Market size and forecast 2025-2030 ($ million)
Chart on Nanotechnology-based - Year-over-year growth 2025-2030 (%)
Data Table on Nanotechnology-based - Year-over-year growth 2025-2030 (%)

10.6 Market opportunity by Formulation

Market opportunity by Formulation ($ million)
Data Table on Market opportunity by Formulation ($ million)

11. Customer Landscape

11.1 Customer landscape overview

Analysis of price sensitivity, lifecycle, customer purchase basket, adoption rates, and purchase criteria

12. Geographic Landscape

12.1 Geographic segmentation

Chart on Market share by geography 2025-2030 (%)
Data Table on Market share by geography 2025-2030 (%)

12.2 Geographic comparison

Chart on Geographic comparison
Data Table on Geographic comparison

12.3 APAC - Market size and forecast 2025-2030

Chart on APAC - Market size and forecast 2025-2030 ($ million)
Data Table on APAC - Market size and forecast 2025-2030 ($ million)
Chart on APAC - Year-over-year growth 2025-2030 (%)
Data Table on APAC - Year-over-year growth 2025-2030 (%)
Chart on Regional Comparison - APAC
Data Table on Regional Comparison - APAC

12.3.1 China - Market size and forecast 2025-2030

Chart on China - Market size and forecast 2025-2030 ($ million)
Data Table on China - Market size and forecast 2025-2030 ($ million)
Chart on China - Year-over-year growth 2025-2030 (%)
Data Table on China - Year-over-year growth 2025-2030 (%)

12.3.2 Japan - Market size and forecast 2025-2030

Chart on Japan - Market size and forecast 2025-2030 ($ million)
Data Table on Japan - Market size and forecast 2025-2030 ($ million)
Chart on Japan - Year-over-year growth 2025-2030 (%)
Data Table on Japan - Year-over-year growth 2025-2030 (%)

12.3.3 India - Market size and forecast 2025-2030

Chart on India - Market size and forecast 2025-2030 ($ million)
Data Table on India - Market size and forecast 2025-2030 ($ million)
Chart on India - Year-over-year growth 2025-2030 (%)
Data Table on India - Year-over-year growth 2025-2030 (%)

12.3.4 South Korea - Market size and forecast 2025-2030

Chart on South Korea - Market size and forecast 2025-2030 ($ million)
Data Table on South Korea - Market size and forecast 2025-2030 ($ million)
Chart on South Korea - Year-over-year growth 2025-2030 (%)
Data Table on South Korea - Year-over-year growth 2025-2030 (%)

12.3.5 Australia - Market size and forecast 2025-2030

Chart on Australia - Market size and forecast 2025-2030 ($ million)
Data Table on Australia - Market size and forecast 2025-2030 ($ million)
Chart on Australia - Year-over-year growth 2025-2030 (%)
Data Table on Australia - Year-over-year growth 2025-2030 (%)

12.3.6 Indonesia - Market size and forecast 2025-2030

Chart on Indonesia - Market size and forecast 2025-2030 ($ million)
Data Table on Indonesia - Market size and forecast 2025-2030 ($ million)
Chart on Indonesia - Year-over-year growth 2025-2030 (%)
Data Table on Indonesia - Year-over-year growth 2025-2030 (%)

12.4 North America - Market size and forecast 2025-2030

Chart on North America - Market size and forecast 2025-2030 ($ million)
Data Table on North America - Market size and forecast 2025-2030 ($ million)
Chart on North America - Year-over-year growth 2025-2030 (%)
Data Table on North America - Year-over-year growth 2025-2030 (%)
Chart on Regional Comparison - North America
Data Table on Regional Comparison - North America

12.4.1 US - Market size and forecast 2025-2030

Chart on US - Market size and forecast 2025-2030 ($ million)
Data Table on US - Market size and forecast 2025-2030 ($ million)
Chart on US - Year-over-year growth 2025-2030 (%)
Data Table on US - Year-over-year growth 2025-2030 (%)

12.4.2 Canada - Market size and forecast 2025-2030

Chart on Canada - Market size and forecast 2025-2030 ($ million)
Data Table on Canada - Market size and forecast 2025-2030 ($ million)
Chart on Canada - Year-over-year growth 2025-2030 (%)
Data Table on Canada - Year-over-year growth 2025-2030 (%)

12.4.3 Mexico - Market size and forecast 2025-2030

Chart on Mexico - Market size and forecast 2025-2030 ($ million)
Data Table on Mexico - Market size and forecast 2025-2030 ($ million)
Chart on Mexico - Year-over-year growth 2025-2030 (%)
Data Table on Mexico - Year-over-year growth 2025-2030 (%)

12.5 Europe - Market size and forecast 2025-2030

Chart on Europe - Market size and forecast 2025-2030 ($ million)
Data Table on Europe - Market size and forecast 2025-2030 ($ million)
Chart on Europe - Year-over-year growth 2025-2030 (%)
Data Table on Europe - Year-over-year growth 2025-2030 (%)
Chart on Regional Comparison - Europe
Data Table on Regional Comparison - Europe

12.5.1 Germany - Market size and forecast 2025-2030

Chart on Germany - Market size and forecast 2025-2030 ($ million)
Data Table on Germany - Market size and forecast 2025-2030 ($ million)
Chart on Germany - Year-over-year growth 2025-2030 (%)
Data Table on Germany - Year-over-year growth 2025-2030 (%)

12.5.2 UK - Market size and forecast 2025-2030

Chart on UK - Market size and forecast 2025-2030 ($ million)
Data Table on UK - Market size and forecast 2025-2030 ($ million)
Chart on UK - Year-over-year growth 2025-2030 (%)
Data Table on UK - Year-over-year growth 2025-2030 (%)

12.5.3 France - Market size and forecast 2025-2030

Chart on France - Market size and forecast 2025-2030 ($ million)
Data Table on France - Market size and forecast 2025-2030 ($ million)
Chart on France - Year-over-year growth 2025-2030 (%)
Data Table on France - Year-over-year growth 2025-2030 (%)

12.5.4 Italy - Market size and forecast 2025-2030

Chart on Italy - Market size and forecast 2025-2030 ($ million)
Data Table on Italy - Market size and forecast 2025-2030 ($ million)
Chart on Italy - Year-over-year growth 2025-2030 (%)
Data Table on Italy - Year-over-year growth 2025-2030 (%)

12.5.5 Spain - Market size and forecast 2025-2030

Chart on Spain - Market size and forecast 2025-2030 ($ million)
Data Table on Spain - Market size and forecast 2025-2030 ($ million)
Chart on Spain - Year-over-year growth 2025-2030 (%)
Data Table on Spain - Year-over-year growth 2025-2030 (%)

12.5.6 The Netherlands - Market size and forecast 2025-2030

Chart on The Netherlands - Market size and forecast 2025-2030 ($ million)
Data Table on The Netherlands - Market size and forecast 2025-2030 ($ million)
Chart on The Netherlands - Year-over-year growth 2025-2030 (%)
Data Table on The Netherlands - Year-over-year growth 2025-2030 (%)

12.6 Middle East and Africa - Market size and forecast 2025-2030

Chart on Middle East and Africa - Market size and forecast 2025-2030 ($ million)
Data Table on Middle East and Africa - Market size and forecast 2025-2030 ($ million)
Chart on Middle East and Africa - Year-over-year growth 2025-2030 (%)
Data Table on Middle East and Africa - Year-over-year growth 2025-2030 (%)
Chart on Regional Comparison - Middle East and Africa
Data Table on Regional Comparison - Middle East and Africa

12.6.1 Saudi Arabia - Market size and forecast 2025-2030

Chart on Saudi Arabia - Market size and forecast 2025-2030 ($ million)
Data Table on Saudi Arabia - Market size and forecast 2025-2030 ($ million)
Chart on Saudi Arabia - Year-over-year growth 2025-2030 (%)
Data Table on Saudi Arabia - Year-over-year growth 2025-2030 (%)

12.6.2 UAE - Market size and forecast 2025-2030

Chart on UAE - Market size and forecast 2025-2030 ($ million)
Data Table on UAE - Market size and forecast 2025-2030 ($ million)
Chart on UAE - Year-over-year growth 2025-2030 (%)
Data Table on UAE - Year-over-year growth 2025-2030 (%)

12.6.3 South Africa - Market size and forecast 2025-2030

Chart on South Africa - Market size and forecast 2025-2030 ($ million)
Data Table on South Africa - Market size and forecast 2025-2030 ($ million)
Chart on South Africa - Year-over-year growth 2025-2030 (%)
Data Table on South Africa - Year-over-year growth 2025-2030 (%)

12.6.4 Israel - Market size and forecast 2025-2030

Chart on Israel - Market size and forecast 2025-2030 ($ million)
Data Table on Israel - Market size and forecast 2025-2030 ($ million)
Chart on Israel - Year-over-year growth 2025-2030 (%)
Data Table on Israel - Year-over-year growth 2025-2030 (%)

12.6.5 Turkey - Market size and forecast 2025-2030

Chart on Turkey - Market size and forecast 2025-2030 ($ million)
Data Table on Turkey - Market size and forecast 2025-2030 ($ million)
Chart on Turkey - Year-over-year growth 2025-2030 (%)
Data Table on Turkey - Year-over-year growth 2025-2030 (%)

12.7 South America - Market size and forecast 2025-2030

Chart on South America - Market size and forecast 2025-2030 ($ million)
Data Table on South America - Market size and forecast 2025-2030 ($ million)
Chart on South America - Year-over-year growth 2025-2030 (%)
Data Table on South America - Year-over-year growth 2025-2030 (%)
Chart on Regional Comparison - South America
Data Table on Regional Comparison - South America

12.7.1 Brazil - Market size and forecast 2025-2030

Chart on Brazil - Market size and forecast 2025-2030 ($ million)
Data Table on Brazil - Market size and forecast 2025-2030 ($ million)
Chart on Brazil - Year-over-year growth 2025-2030 (%)
Data Table on Brazil - Year-over-year growth 2025-2030 (%)

12.7.2 Argentina - Market size and forecast 2025-2030

Chart on Argentina - Market size and forecast 2025-2030 ($ million)
Data Table on Argentina - Market size and forecast 2025-2030 ($ million)
Chart on Argentina - Year-over-year growth 2025-2030 (%)
Data Table on Argentina - Year-over-year growth 2025-2030 (%)

12.7.3 Chile - Market size and forecast 2025-2030

Chart on Chile - Market size and forecast 2025-2030 ($ million)
Data Table on Chile - Market size and forecast 2025-2030 ($ million)
Chart on Chile - Year-over-year growth 2025-2030 (%)
Data Table on Chile - Year-over-year growth 2025-2030 (%)

12.8 Market opportunity by geography

Market opportunity by geography ($ million)
Data Tables on Market opportunity by geography ($ million)

13. Drivers, Challenges, and Opportunity

13.1 Market drivers

Expansion of sustainable architectural and construction industries
Proliferation of advanced automotive and transportation applications
Growth of renewable energy infrastructure via concentrated solar power

13.2 Market challenges

Strict environmental regulations on volatile organic compounds
Volatility of raw material prices and supply chain vulnerabilities
Intense technical demands of integration with smart and advanced surfaces

13.3 Impact of drivers and challenges

Impact of drivers and challenges in 2025 and 2030

13.4 Market opportunities

Shift toward water-based and eco-friendly formulations
Integration of nanotechnology and self-cleaning surfaces
Expansion of smart mirror technologies and sensor compatibility

14. Competitive Landscape

14.1 Overview

14.2

Overview on criticality of inputs and factors of differentiation

14.3 Landscape disruption

Overview on factors of disruption

14.4 Industry risks

Impact of key risks on business

15. Competitive Analysis

15.1 Companies profiled

Companies covered

15.2 Company ranking index

15.3 Market positioning of companies

Matrix on companies position and classification

15.4 Abrisa Technologies

Abrisa Technologies - Overview
Abrisa Technologies - Product / Service
Abrisa Technologies - Key offerings
SWOT

15.5 Alkor Technologies Inc.

Alkor Technologies Inc. - Overview
Alkor Technologies Inc. - Product / Service
Alkor Technologies Inc. - Key offerings
SWOT

15.6 Befort Wetzlar OD GmbH

Befort Wetzlar OD GmbH - Overview
Befort Wetzlar OD GmbH - Product / Service
Befort Wetzlar OD GmbH - Key offerings
SWOT

15.7 Coherent Corp.

Coherent Corp. - Overview
Coherent Corp. - Business segments
Coherent Corp. - Key offerings
Coherent Corp. - Segment focus
SWOT

15.8 Edmund Optics Inc.

Edmund Optics Inc. - Overview
Edmund Optics Inc. - Product / Service
Edmund Optics Inc. - Key offerings
SWOT

15.9 GEOMATEC Co. Ltd.

GEOMATEC Co. Ltd. - Overview
GEOMATEC Co. Ltd. - Product / Service
GEOMATEC Co. Ltd. - Key offerings
SWOT

15.10 Hind High Vacuum Co. Pvt. Ltd.

Hind High Vacuum Co. Pvt. Ltd. - Overview
Hind High Vacuum Co. Pvt. Ltd. - Product / Service
Hind High Vacuum Co. Pvt. Ltd. - Key offerings
SWOT

15.11 Jenoptik AG

Jenoptik AG - Overview
Jenoptik AG - Business segments
Jenoptik AG - Key news
Jenoptik AG - Key offerings
Jenoptik AG - Segment focus
SWOT

15.12 Lambda Research Optics Inc.

Lambda Research Optics Inc. - Overview
Lambda Research Optics Inc. - Product / Service
Lambda Research Optics Inc. - Key offerings
SWOT

15.13 NANEO Precision IBS Coatings

NANEO Precision IBS Coatings - Overview
NANEO Precision IBS Coatings - Product / Service
NANEO Precision IBS Coatings - Key offerings
SWOT

15.14 Opto Technological Laboratory

Opto Technological Laboratory - Overview
Opto Technological Laboratory - Product / Service
Opto Technological Laboratory - Key offerings
SWOT

15.15 Precision Optical Inc.

Precision Optical Inc. - Overview
Precision Optical Inc. - Product / Service
Precision Optical Inc. - Key offerings
SWOT

15.16 SCHOTT AG

SCHOTT AG - Overview
SCHOTT AG - Product / Service
SCHOTT AG - Key offerings
SWOT

15.17 Thorlabs Inc.

Thorlabs Inc. - Overview
Thorlabs Inc. - Product / Service
Thorlabs Inc. - Key offerings
SWOT

15.18 UAB Optonas

UAB Optonas - Overview
UAB Optonas - Product / Service
UAB Optonas - Key offerings
SWOT

16. Appendix

16.1 Scope of the report

Market definition
Objectives
Notes and caveats

16.2 Inclusions and exclusions checklist

Inclusions checklist
Exclusions checklist

16.3 Currency conversion rates for US$

16.4 Research methodology

16.5 Data procurement

Information sources

16.6 Data validation

16.7 Validation techniques employed for market sizing

16.8 Data synthesis

16.9 360 degree market analysis

16.10 List of abbreviations

Research Methodology

Technavio presents a detailed picture of the market by way of study, synthesis, and summation of data from multiple sources. The analysts have presented the various facets of the market with a particular focus on identifying the key industry influencers. The data thus presented is comprehensive, reliable, and the result of extensive research, both primary and secondary.

INFORMATION SOURCES

Primary sources

  • Manufacturers and suppliers
  • Channel partners
  • Industry experts
  • Strategic decision makers

Secondary sources

  • Industry journals and periodicals
  • Government data
  • Financial reports of key industry players
  • Historical data
  • Press releases

DATA ANALYSIS

Data Synthesis

  • Collation of data
  • Estimation of key figures
  • Analysis of derived insights

Data Validation

  • Triangulation with data models
  • Reference against proprietary databases
  • Corroboration with industry experts

REPORT WRITING

Qualitative

  • Market drivers
  • Market challenges
  • Market trends
  • Five forces analysis

Quantitative

  • Market size and forecast
  • Market segmentation
  • Geographical insights
  • Competitive landscape

Interested in this report?

Get your sample now to see our research methodology and insights!

Download Now

Frequently Asked Questions

Mirror Coatings market growth will increase by USD 330.4 million during 2026-2030.

The Mirror Coatings market is expected to grow at a CAGR of 6.9% during 2026-2030.

Mirror Coatings market is segmented by End-user (Building and construction, Automotive and transportation, Energy, Others) Type (Polyurethane, Epoxy, Acrylic) Formulation (Solvent-based, Water-based, Nanotechnology-based)

Abrisa Technologies, AccuCoat Inc., Alkor Technologies Inc., Befort Wetzlar OD GmbH, Carl Zeiss AG, Coherent Corp., Edmund Optics Inc., GEOMATEC Co. Ltd., Hind High Vacuum Co. Pvt. Ltd., Jenoptik AG, Lambda Research Optics Inc., NANEO Precision IBS Coatings, Opto Technological Laboratory, Precision Optical Inc., SCHOTT AG, Spectrum Coatings, Thorlabs Inc., UAB Optonas, VisiMax Technologies, ZeCoat Corp. are a few of the key vendors in the Mirror Coatings market.

APAC will register the highest growth rate of 39.6% among the other regions. Therefore, the Mirror Coatings market in APAC is expected to garner significant business opportunities for the vendors during the forecast period.

China, Japan, India, South Korea, Australia, Indonesia, US, Canada, Mexico, Germany, UK, France, Italy, Spain, The Netherlands, Saudi Arabia, UAE, South Africa, Israel, Turkey, Brazil, Argentina, Chile

  • Expansion of sustainable architectural and construction industries is the driving factor this market.

The Mirror Coatings market vendors should focus on grabbing business opportunities from the End-user segment as it accounted for the largest market share in the base year.
RIA - Research AI Assistant
Ask RIA
