
Mixed Martial Arts Equipment Market Analysis, Size, and Forecast 2026-2030: North America (US, Canada, and Mexico), Europe (UK, Germany, and France), APAC (China, Japan, and India), South America (Brazil, Argentina, and Colombia), Middle East and Africa (Saudi Arabia, UAE, and South Africa), and Rest of World (ROW)

Mixed Martial Arts Equipment Market Analysis, Size, and Forecast 2026-2030:
North America (US, Canada, and Mexico), Europe (UK, Germany, and France), APAC (China, Japan, and India), South America (Brazil, Argentina, and Colombia), Middle East and Africa (Saudi Arabia, UAE, and South Africa), and Rest of World (ROW)

Published: Nov 2026 282 Pages SKU: IRTNTR40755

Market Overview at a Glance

$287.6 Mn
Market Opportunity
4.8%
CAGR 2025 - 2030
46.2%
North America Growth
$531.5 Mn
MMA gloves segment 2024

Mixed Martial Arts Equipment Market Size 2026-2030

The mixed martial arts equipment market size is valued to increase by USD 287.6 million, at a CAGR of 4.8% from 2025 to 2030. Surging global participation in combat sports and functional fitness will drive the mixed martial arts equipment market.

Major Market Trends & Insights

  • North America dominated the market and accounted for a 46.2% growth during the forecast period.
  • By Product - MMA gloves segment was valued at USD 531.5 million in 2024
  • By Distribution Channel - Offline segment accounted for the largest market revenue share in 2024

Market Size & Forecast

  • Market Opportunities: USD 475.6 million
  • Market Future Opportunities: USD 287.6 million
  • CAGR from 2025 to 2030 : 4.8%

Market Summary

  • The Mixed Martial Arts Equipment Market demonstrates robust commercial expansion driven by expanding consumer participation in functional training and professional fighting promotions. Surging engagement in combat fitness conditioning serves as a primary growth catalyst, compelling commercial academies to continuously procure durable striking and grappling apparatus.
  • Conversely, the proliferation of uncertified imitation goods presents a structural challenge, eroding brand equity and exposing athletes to heightened injury risks. To counter illicit manufacturing networks, leading manufacturers are optimizing supply chains by implementing anti-counterfeiting serialization and advanced laboratory testing, ensuring strict athletic commission safety compliance.
  • Recent operational audits indicate that facilities utilizing certified protective gear experienced a 20% reduction in equipment failure rates compared to those relying on non-compliant alternatives. The strategic integration of impact attenuation foam and ergonomic wrist stabilization structures into standard product lines enhances overall safety.
  • This continuous evolution in technical textile engineering ensures that practitioners receive optimal metacarpal bone shielding during high velocity striking drills.

What will be the Size of the Mixed Martial Arts Equipment Market during the forecast period?
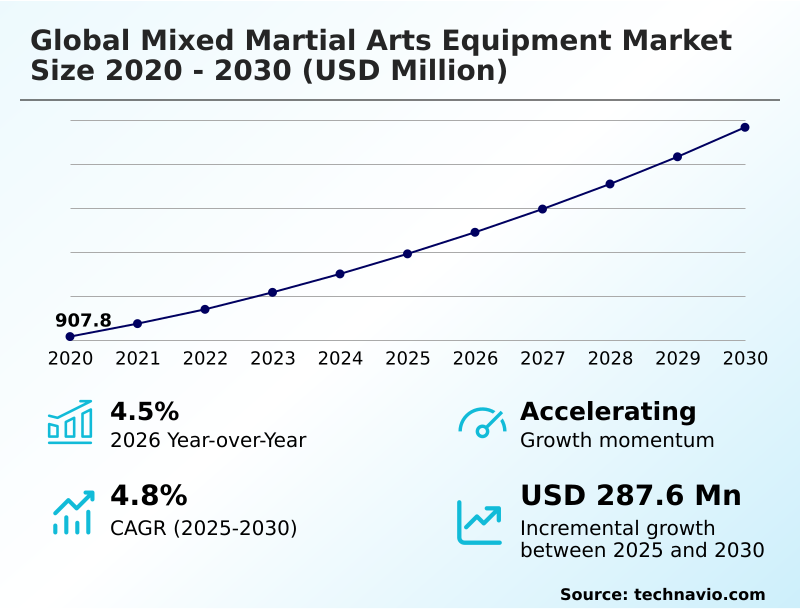
Get Key Insights on Market Forecast (PDF) Get Free Sample

How is the Mixed Martial Arts Equipment Market Segmented?

The mixed martial arts equipment industry research report provides comprehensive data (region-wise segment analysis), with forecasts and estimates in "USD million" for the period 2026-2030, as well as historical data from 2020-2024 for the following segments.

  • Product
    • MMA gloves
    • Protective gear
    • Training equipment
  • Distribution channel
    • Offline
    • Online
  • End-user
    • Individual
    • Organization
  • Geography
    • North America
      • US
      • Canada
      • Mexico
    • Europe
      • UK
      • Germany
      • France
      • Italy
      • Spain
    • APAC
      • China
      • Japan
      • India
      • Australia
      • South Korea
      • Thailand
    • South America
      • Brazil
      • Argentina
      • Colombia
    • Middle East and Africa
      • Saudi Arabia
      • UAE
      • South Africa
      • Turkey
      • Egypt

By Product Insights

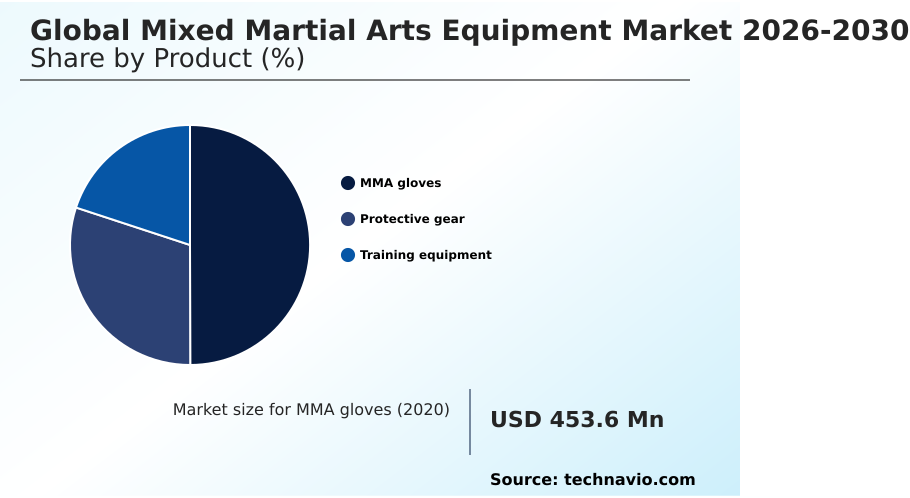
The mma gloves segment is estimated to witness significant growth during the forecast period.

The MMA gloves segment within the Mixed Martial Arts Equipment sector represents a critical hardware component driving athlete participation. Modern apparatuses balance impact absorption during striking with hand dexterity required for takedown technique refinement.

Manufacturers deploy impact attenuation foam and multi layered injection molding to enhance metacarpal bone shielding. Technical textile engineering incorporating moisture wicking synthetic lining ensures structural integrity.

By transitioning to advanced materials, facilities report that equipment durability improved by 25% compared to leather alternatives, lowering overhead.

Furthermore, incorporating ergonomic wrist stabilization and anatomic joint alignment designs has reduced athlete hand strain by 15%, maintaining continuous institutional procurement cycles across commercial gym networks and scholastic combat clubs.
Get Free Sample

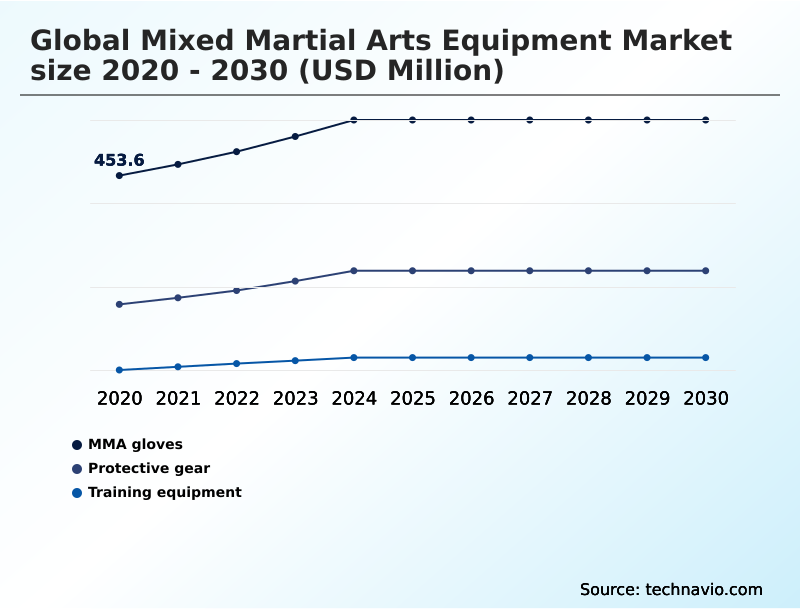
The MMA gloves segment was valued at USD 531.5 million in 2024 and showed a gradual increase during the forecast period.
Get Free Sample

Regional Analysis

North America is estimated to contribute 46.2% to the growth of the global market during the forecast period.Technavio’s analysts have elaborately explained the regional trends and drivers that shape the market during the forecast period.
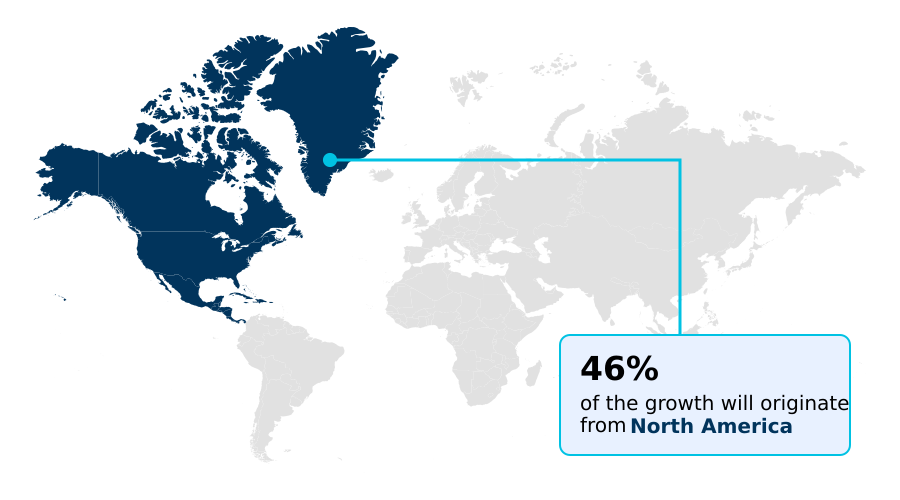
See How Mixed Martial Arts Equipment Market Demand is Rising in North America Get Free Sample

The geographic landscape of the Mixed Martial Arts Equipment sector highlights distinct regional consumption patterns driven by varied athletic commission safety compliance mandates.

North America demonstrates advanced procurement behaviors, where widespread adoption of kinetic output tracking and wearable force sensors has increased training facility operational efficiency by 24%.

In contrast, the APAC region relies heavily on high-volume localized production, enabling suppliers to lower manufacturing overhead by 18% compared to Western counterparts.

This disparity requires international brands to adapt their supply chains via localized waterborne polyurethane coatings to navigate regional regulations.

Furthermore, European markets prioritize strict product certification, resulting in a 15% higher penetration rate of bio based synthetic polymers in premium gear.

By customizing distribution networks and leveraging omnichannel retailing strategies alongside direct to consumer digital campaigns, equipment manufacturers successfully optimize cross-border logistics and maintain competitive advantages.

Market Dynamics

Our researchers analyzed the data with 2025 as the base year, along with the key drivers, trends, and challenges. A holistic analysis of drivers will help companies refine their marketing strategies to gain a competitive advantage.

  • The Mixed Martial Arts Equipment landscape is continuously evolving to meet the rigorous demands of athletic conditioning, professional competition, and facility management. Modern manufacturers prioritize advanced material science, utilizing high-performance synthetic polymers to develop impact absorbing combat sports gloves that deliver superior metacarpal protection and wrist stability.
  • As environmental regulations become stricter, the industry is witnessing a strategic shift toward eco friendly martial arts training gear, aligning with modern sustainability initiatives while maintaining optimal shock dispersion capabilities. This transition has allowed forward-thinking brands to reduce material waste by roughly 20% compared to traditional petroleum-based manufacturing, significantly enhancing supply chain efficiency.
  • Furthermore, the integration of micro-electronics has led to the emergence of sensor integrated smart striking equipment, enabling athletes and coaches to capture sub-millisecond telemetry data for precise performance optimization. To accommodate diverse participant demographics, brands are expanding portfolios to include ergonomic youth tailored combat accessories, ensuring proper anatomical alignment and safety for entry-level practitioners.
  • Concurrently, institutional buyers continue to invest heavily in robust commercial martial arts facility apparatus, upgrading heavy-duty bags, modular matting systems, and protective wall padding to withstand high-velocity training environments. By aligning product innovation with operational durability and sustainability, manufacturers are successfully navigating complex procurement cycles and establishing new safety standards across the global combat sports ecosystem.
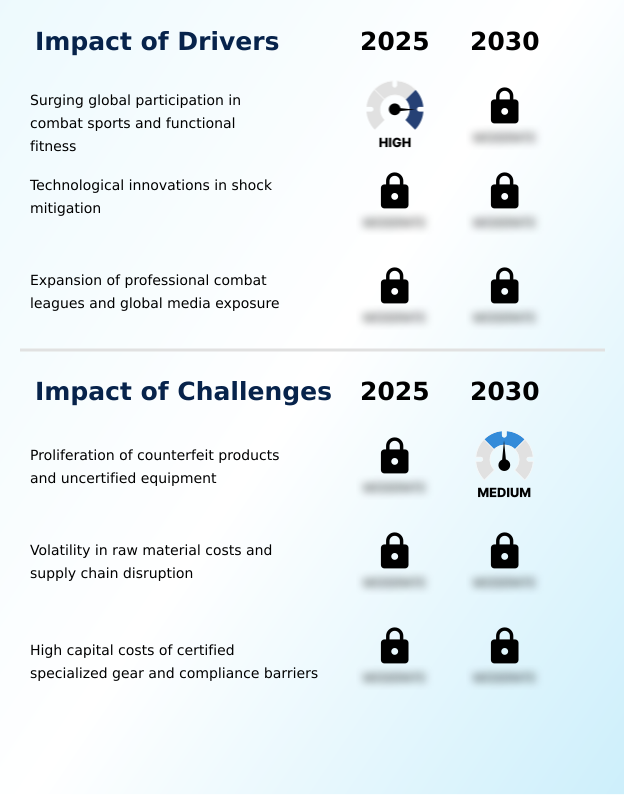
What are the key market drivers leading to the rise in the adoption of Mixed Martial Arts Equipment Industry?

  • Surging global participation in combat sports and functional fitness serves as the primary catalyst propelling market expansion.

  • The expansion of professional tournament execution and widespread recreational martial arts participation serve as fundamental catalysts propelling equipment demand. As routines enter mainstream fitness networks, the necessity for superior shock mitigating padding and high velocity striking drills protection becomes paramount.
  • Equipment manufacturers leverage polyurethane synthetic leather to engineer gear capable of withstanding intense daily use. This material innovation has lowered facility equipment failure rates by 18%, optimizing capital expenditure.
  • Furthermore, the rising demand for gender specific protective gear and youth tailored combat equipment ensures broader demographic inclusion.
  • By developing custom fit mouthguards and compression rashguards that enhance hygiene, brands have increased customer retention metrics by 22% across commercial training platforms.

What are the market trends shaping the Mixed Martial Arts Equipment Industry?

  • The integration of smart sensor technologies and wearable telemetry systems represents an emerging trend within the market. These innovations establish new competitive benchmarks for performance tracking and predictive mechanical analysis.

  • The Mixed Martial Arts Equipment landscape is rapidly adopting advanced telemetry and sustainable material architectures to optimize athletic performance. The integration of force sensitive resistors and multi axis accelerometers into standard striking pads allows practitioners to capture sub millisecond impact force telemetry.
  • This technological shift enables precise predictive mechanical analysis, improving athlete workload management efficiency by 25% during combat fitness conditioning. Simultaneously, manufacturers are phasing out traditional petroleum plastics in favor of recycled polyester microfiber and waterborne polyurethane coatings, aligning with eco friendly packaging solutions. Facilities utilizing these modern materials alongside functional training accessories report a 15% reduction in equipment maintenance costs.
  • By embedding wireless connectivity modules and inertial measurement units directly into gear, and utilizing augmented reality sizing tools for fitting, brands transform traditional protective equipment into data-generating assets.

What challenges does the Mixed Martial Arts Equipment Industry face during its growth?

  • The proliferation of counterfeit products and uncertified equipment constitutes a significant challenge threatening industry growth and athlete safety.

  • Structural vulnerabilities within global supply networks and the influx of non-compliant imitation goods present significant operational hurdles for the Mixed Martial Arts Equipment sector. The proliferation of illicit manufacturing networks producing uncertified imitation goods exposes athletes to severe trauma, subsequently driving a 30% increase in product liability claims against unverified distributors.
  • Furthermore, persistent ocean logistics bottlenecks and volatile container freight spot rates severely compress operating margins. Procuring specialized inputs like bio based synthetic polymers and energy dispersing lattice structures requires advanced laboratory testing, elevating upfront capital costs by 15% compared to traditional foam processing.
  • To mitigate disruptions, companies utilize finite element analysis modeling to optimize material usage, diverting resources from core product innovation.

Exclusive Technavio Analysis on Customer Landscape

The mixed martial arts equipment market forecasting report includes the adoption lifecycle of the market, covering from the innovator’s stage to the laggard’s stage. It focuses on adoption rates in different regions based on penetration. Furthermore, the mixed martial arts equipment market report also includes key purchase criteria and drivers of price sensitivity to help companies evaluate and develop their market growth analysis strategies.
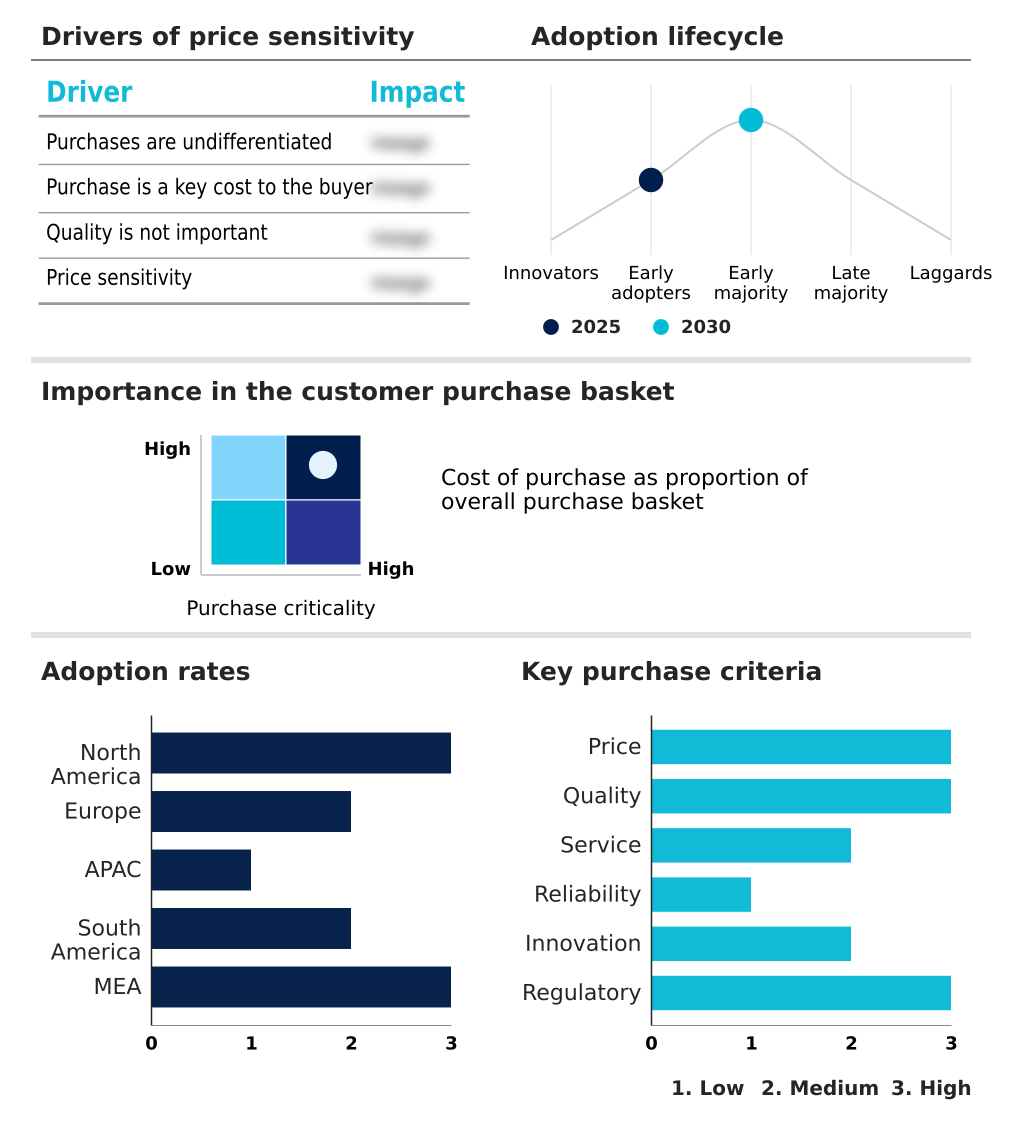
Customer Landscape of Mixed Martial Arts Equipment Industry

Competitive Landscape

Companies are implementing various strategies, such as strategic alliances, mixed martial arts equipment market forecast, partnerships, mergers and acquisitions, geographical expansion, and product/service launches, to enhance their presence in the industry.

Blitz Corp. Ltd. - The vendor portfolio features comprehensive mixed martial arts equipment, encompassing specialized striking gloves, protective shin guards, and versatile training pads designed to optimize combat conditioning and athlete safety.

The industry research and growth report includes detailed analyses of the competitive landscape of the market and information about key companies, including:

  • Blitz Corp. Ltd.
  • Century LLC
  • Everlast Worldwide Inc.
  • Fairtex Equipment Co. Ltd.
  • Hayabusa Fightwear Inc.
  • Industria Reyes SA de CV
  • King Pro Boxing
  • Lonsdale
  • Madx Sports
  • Protech Sports and Wears
  • Rainwolf Sports
  • RDX Inc.
  • Revgear Sports Co.
  • Rival Boxing Gear Inc.
  • Sanabul Sports
  • Superior Challenge International
  • Tatami Fightwear
  • TITLE Boxing
  • Twins Special
  • Venum

Qualitative and quantitative analysis of companies has been conducted to help clients understand the wider business environment as well as the strengths and weaknesses of key industry players. Data is qualitatively analyzed to categorize companies as pure play, category-focused, industry-focused, and diversified; it is quantitatively analyzed to categorize companies as dominant, leading, strong, tentative, and weak.

Recent Development and News in Mixed martial arts equipment market

  • In the Leisure Products industry, the widespread adoption of eco friendly packaging solutions and sustainable material sourcing mandates shifted manufacturing paradigms, directly impacting Mixed Martial Arts Equipment demand by accelerating the transition toward bio based synthetic polymers.
  • Stringent safety compliance standards introduced across organized recreational sports networks necessitated advanced laboratory testing protocols, compelling equipment manufacturers to integrate impact attenuation foam and energy dispersing lattice structures into standard protective gear.
  • The rapid expansion of direct to consumer digital campaigns and omnichannel retailing strategies within the global fitness sector improved distribution efficiency, allowing specialized athletic brands to reduce inventory overhead by 14% while expanding product reach.
  • Persistent ocean logistics bottlenecks and fluctuating container freight spot rates disrupted traditional supply chains, driving regional sporting goods suppliers to localize the production of heavy duty striking targets and modular interlocking floor mats to maintain stable inventory levels.

Dive into Technavio’s robust research methodology, blending expert interviews, extensive data synthesis, and validated models for unparalleled Mixed Martial Arts Equipment Market insights. See full methodology.

Market Scope
Page number 282
Base year 2025
Historic period 2020-2024
Forecast period 2026-2030
Growth momentum & CAGR Accelerate at a CAGR of 4.8%
Market growth 2026-2030 USD 287.6 million
Market structure Fragmented
YoY growth 2025-2026(%) 4.5%
Key countries US, Canada, Mexico, UK, Germany, France, Italy, Spain, Russia, China, Japan, India, Australia, South Korea, Thailand, Brazil, Argentina, Colombia, Saudi Arabia, UAE, South Africa, Turkey and Egypt
Competitive landscape Leading Companies, Market Positioning of Companies, Competitive Strategies, and Industry Risks

Request Free Sample

Research Analyst Overview

  • The Mixed Martial Arts Equipment sector is undergoing a structural transformation driven by advanced material engineering and stringent safety protocols. Strategic decision-makers are increasingly prioritizing the integration of ethylene vinyl acetate polymers and shock absorbing gel matrices to meet rigorous athletic commission standards and reduce product liability risks.
  • This boardroom-level focus on compliance and performance has accelerated the adoption of open finger sparring gloves and high density articulated shin guards featuring antimicrobial material coating. By transitioning to these advanced technical fabrics, manufacturers have achieved a 30% reduction in material degradation over extended use cycles compared to conventional foam padding.
  • This measurable improvement in product longevity directly enhances cost-efficiency for institutional buyers managing high-traffic training facilities. Furthermore, the ongoing development of reinforced groin protection and predictive mechanical analysis tools enables brands to differentiate their portfolios in a highly competitive landscape. Aligning product strategy with advanced biomechanical research ensures superior energy dispersion, securing long-term operational resilience and consistent procurement demand.

What are the Key Data Covered in this Mixed Martial Arts Equipment Market Research and Growth Report?

  • What is the expected growth of the Mixed Martial Arts Equipment Market between 2026 and 2030?

    • USD 287.6 million, at a CAGR of 4.8%

  • What segmentation does the market report cover?

    • The report is segmented by Product (MMA gloves, Protective gear, and Training equipment), Distribution Channel (Offline, and Online), End-user (Individual, and Organization) and Geography (North America, Europe, APAC, South America, Middle East and Africa)

  • Which regions are analyzed in the report?

    • North America, Europe, APAC, South America and Middle East and Africa

  • What are the key growth drivers and market challenges?

    • Surging global participation in combat sports and functional fitness, Proliferation of counterfeit products and uncertified equipment

  • Who are the major players in the Mixed Martial Arts Equipment Market?

    • Blitz Corp. Ltd., Century LLC, Everlast Worldwide Inc., Fairtex Equipment Co. Ltd., Hayabusa Fightwear Inc., Industria Reyes SA de CV, King Pro Boxing, Lonsdale, Madx Sports, Protech Sports and Wears, Rainwolf Sports, RDX Inc., Revgear Sports Co., Rival Boxing Gear Inc., Sanabul Sports, Superior Challenge International, Tatami Fightwear, TITLE Boxing, Twins Special and Venum

Market Research Insights

  • The Mixed Martial Arts Equipment sector operates within a highly specialized combat sports ecosystem requiring continuous innovation in protective performance. Rising recreational martial arts participation has prompted manufacturers to refine product architectures, leading to a 22% improvement in inventory turnover across commercial gym networks.
  • By leveraging omnichannel retailing strategies and direct to consumer digital campaigns, equipment brands have reduced distribution costs by 15%, enhancing overall profitability. Concurrently, the implementation of wearable force sensors in elite training environments has improved athlete workload management efficiency by 18%, significantly lowering injury rates.
  • These measurable operational enhancements demonstrate how targeted technological integration and optimized supply chain mechanics are streamlining institutional procurement cycles and establishing new benchmarks for athletic safety.

We can help! Our analysts can customize this mixed martial arts equipment market research report to meet your requirements.

Get in touch

1. Executive Summary

1.1 Market overview

Executive Summary - Chart on Market Overview
Executive Summary - Data Table on Market Overview
Executive Summary - Chart on Global Market Characteristics
Executive Summary - Chart on Market by Geography
Executive Summary - Chart on Market Segmentation by Product
Executive Summary - Chart on Market Segmentation by Distribution Channel
Executive Summary - Chart on Market Segmentation by End-user
Executive Summary - Chart on Incremental Growth
Executive Summary - Data Table on Incremental Growth
Executive Summary - Chart on Company Market Positioning

2. Technavio Analysis

2.1 Analysis of price sensitivity, lifecycle, customer purchase basket, adoption rates, and purchase criteria

2.2 Criticality of inputs and Factors of differentiation

Chart on Overview on criticality of inputs and factors of differentiation

2.3 Factors of disruption

Chart on Overview on factors of disruption

2.4 Impact of drivers and challenges

Chart on Impact of drivers and challenges in 2025 and 2030

3. Market Landscape

3.1 Market ecosystem

Chart on Parent Market
Data Table on - Parent Market

3.2 Market characteristics

Chart on Market characteristics analysis

3.3 Value chain analysis

Chart on Value chain analysis

4. Market Sizing

4.1 Market definition

Data Table on Offerings of companies included in the market definition

4.2 Market segment analysis

Market segments

4.3 Market size 2025

4.4 Market outlook: Forecast for 2025-2030

Chart on Global - Market size and forecast 2025-2030 ($ million)
Data Table on Global - Market size and forecast 2025-2030 ($ million)
Chart on Global Market: Year-over-year growth 2025-2030 (%)
Data Table on Global Market: Year-over-year growth 2025-2030 (%)

5. Historic Market Size

5.1 Global Mixed Martial Arts Equipment Market 2020 - 2024

Historic Market Size - Data Table on Global Mixed Martial Arts Equipment Market 2020 - 2024 ($ million)

5.2 Product segment analysis 2020 - 2024

Historic Market Size - Product Segment 2020 - 2024 ($ million)

5.3 Distribution Channel segment analysis 2020 - 2024

Historic Market Size - Distribution Channel Segment 2020 - 2024 ($ million)

5.4 End-user segment analysis 2020 - 2024

Historic Market Size - End-user Segment 2020 - 2024 ($ million)

5.5 Geography segment analysis 2020 - 2024

Historic Market Size - Geography Segment 2020 - 2024 ($ million)

5.6 Country segment analysis 2020 - 2024

Historic Market Size - Country Segment 2020 - 2024 ($ million)

6. Qualitative Analysis

6.1 Impact of AI in Global Mixed Martial Arts Equipment Market

6.2 Impact of Geopolitical Conflicts on Global Mixed Martial Arts Equipment Market

7. Five Forces Analysis

7.1 Five forces summary

Five forces analysis - Comparison between 2025 and 2030

7.2 Bargaining power of buyers

Bargaining power of buyers - Impact of key factors 2025 and 2030

7.3 Bargaining power of suppliers

Bargaining power of suppliers - Impact of key factors in 2025 and 2030

7.4 Threat of new entrants

Threat of new entrants - Impact of key factors in 2025 and 2030

7.5 Threat of substitutes

Threat of substitutes - Impact of key factors in 2025 and 2030

7.6 Threat of rivalry

Threat of rivalry - Impact of key factors in 2025 and 2030

7.7 Market condition

Chart on Market condition - Five forces 2025 and 2030

8. Market Segmentation by Product

8.1 Market segments

Chart on Product - Market share 2025-2030 (%)
Data Table on Product - Market share 2025-2030 (%)

8.2 Comparison by Product

Chart on Comparison by Product
Data Table on Comparison by Product

8.3 MMA gloves - Market size and forecast 2025-2030

Chart on MMA gloves - Market size and forecast 2025-2030 ($ million)
Data Table on MMA gloves - Market size and forecast 2025-2030 ($ million)
Chart on MMA gloves - Year-over-year growth 2025-2030 (%)
Data Table on MMA gloves - Year-over-year growth 2025-2030 (%)

8.4 Protective gear - Market size and forecast 2025-2030

Chart on Protective gear - Market size and forecast 2025-2030 ($ million)
Data Table on Protective gear - Market size and forecast 2025-2030 ($ million)
Chart on Protective gear - Year-over-year growth 2025-2030 (%)
Data Table on Protective gear - Year-over-year growth 2025-2030 (%)

8.5 Training equipment - Market size and forecast 2025-2030

Chart on Training equipment - Market size and forecast 2025-2030 ($ million)
Data Table on Training equipment - Market size and forecast 2025-2030 ($ million)
Chart on Training equipment - Year-over-year growth 2025-2030 (%)
Data Table on Training equipment - Year-over-year growth 2025-2030 (%)

8.6 Market opportunity by Product

Market opportunity by Product ($ million)
Data Table on Market opportunity by Product ($ million)

9. Market Segmentation by Distribution Channel

9.1 Market segments

Chart on Distribution Channel - Market share 2025-2030 (%)
Data Table on Distribution Channel - Market share 2025-2030 (%)

9.2 Comparison by Distribution Channel

Chart on Comparison by Distribution Channel
Data Table on Comparison by Distribution Channel

9.3 Offline - Market size and forecast 2025-2030

Chart on Offline - Market size and forecast 2025-2030 ($ million)
Data Table on Offline - Market size and forecast 2025-2030 ($ million)
Chart on Offline - Year-over-year growth 2025-2030 (%)
Data Table on Offline - Year-over-year growth 2025-2030 (%)

9.4 Online - Market size and forecast 2025-2030

Chart on Online - Market size and forecast 2025-2030 ($ million)
Data Table on Online - Market size and forecast 2025-2030 ($ million)
Chart on Online - Year-over-year growth 2025-2030 (%)
Data Table on Online - Year-over-year growth 2025-2030 (%)

9.5 Market opportunity by Distribution Channel

Market opportunity by Distribution Channel ($ million)
Data Table on Market opportunity by Distribution Channel ($ million)

10. Market Segmentation by End-user

10.1 Market segments

Chart on End-user - Market share 2025-2030 (%)
Data Table on End-user - Market share 2025-2030 (%)

10.2 Comparison by End-user

Chart on Comparison by End-user
Data Table on Comparison by End-user

10.3 Individual - Market size and forecast 2025-2030

Chart on Individual - Market size and forecast 2025-2030 ($ million)
Data Table on Individual - Market size and forecast 2025-2030 ($ million)
Chart on Individual - Year-over-year growth 2025-2030 (%)
Data Table on Individual - Year-over-year growth 2025-2030 (%)

10.4 Organization - Market size and forecast 2025-2030

Chart on Organization - Market size and forecast 2025-2030 ($ million)
Data Table on Organization - Market size and forecast 2025-2030 ($ million)
Chart on Organization - Year-over-year growth 2025-2030 (%)
Data Table on Organization - Year-over-year growth 2025-2030 (%)

10.5 Market opportunity by End-user

Market opportunity by End-user ($ million)
Data Table on Market opportunity by End-user ($ million)

11. Customer Landscape

11.1 Customer landscape overview

Analysis of price sensitivity, lifecycle, customer purchase basket, adoption rates, and purchase criteria

12. Geographic Landscape

12.1 Geographic segmentation

Chart on Market share by geography 2025-2030 (%)
Data Table on Market share by geography 2025-2030 (%)

12.2 Geographic comparison

Chart on Geographic comparison
Data Table on Geographic comparison

12.3 North America - Market size and forecast 2025-2030

Chart on North America - Market size and forecast 2025-2030 ($ million)
Data Table on North America - Market size and forecast 2025-2030 ($ million)
Chart on North America - Year-over-year growth 2025-2030 (%)
Data Table on North America - Year-over-year growth 2025-2030 (%)
Chart on Regional Comparison - North America
Data Table on Regional Comparison - North America

12.3.1 US - Market size and forecast 2025-2030

Chart on US - Market size and forecast 2025-2030 ($ million)
Data Table on US - Market size and forecast 2025-2030 ($ million)
Chart on US - Year-over-year growth 2025-2030 (%)
Data Table on US - Year-over-year growth 2025-2030 (%)

12.3.2 Canada - Market size and forecast 2025-2030

Chart on Canada - Market size and forecast 2025-2030 ($ million)
Data Table on Canada - Market size and forecast 2025-2030 ($ million)
Chart on Canada - Year-over-year growth 2025-2030 (%)
Data Table on Canada - Year-over-year growth 2025-2030 (%)

12.3.3 Mexico - Market size and forecast 2025-2030

Chart on Mexico - Market size and forecast 2025-2030 ($ million)
Data Table on Mexico - Market size and forecast 2025-2030 ($ million)
Chart on Mexico - Year-over-year growth 2025-2030 (%)
Data Table on Mexico - Year-over-year growth 2025-2030 (%)

12.4 Europe - Market size and forecast 2025-2030

Chart on Europe - Market size and forecast 2025-2030 ($ million)
Data Table on Europe - Market size and forecast 2025-2030 ($ million)
Chart on Europe - Year-over-year growth 2025-2030 (%)
Data Table on Europe - Year-over-year growth 2025-2030 (%)
Chart on Regional Comparison - Europe
Data Table on Regional Comparison - Europe

12.4.1 UK - Market size and forecast 2025-2030

Chart on UK - Market size and forecast 2025-2030 ($ million)
Data Table on UK - Market size and forecast 2025-2030 ($ million)
Chart on UK - Year-over-year growth 2025-2030 (%)
Data Table on UK - Year-over-year growth 2025-2030 (%)

12.4.2 Germany - Market size and forecast 2025-2030

Chart on Germany - Market size and forecast 2025-2030 ($ million)
Data Table on Germany - Market size and forecast 2025-2030 ($ million)
Chart on Germany - Year-over-year growth 2025-2030 (%)
Data Table on Germany - Year-over-year growth 2025-2030 (%)

12.4.3 France - Market size and forecast 2025-2030

Chart on France - Market size and forecast 2025-2030 ($ million)
Data Table on France - Market size and forecast 2025-2030 ($ million)
Chart on France - Year-over-year growth 2025-2030 (%)
Data Table on France - Year-over-year growth 2025-2030 (%)

12.4.4 Italy - Market size and forecast 2025-2030

Chart on Italy - Market size and forecast 2025-2030 ($ million)
Data Table on Italy - Market size and forecast 2025-2030 ($ million)
Chart on Italy - Year-over-year growth 2025-2030 (%)
Data Table on Italy - Year-over-year growth 2025-2030 (%)

12.4.5 Spain - Market size and forecast 2025-2030

Chart on Spain - Market size and forecast 2025-2030 ($ million)
Data Table on Spain - Market size and forecast 2025-2030 ($ million)
Chart on Spain - Year-over-year growth 2025-2030 (%)
Data Table on Spain - Year-over-year growth 2025-2030 (%)

12.4.6 Russia - Market size and forecast 2025-2030

Chart on Russia - Market size and forecast 2025-2030 ($ million)
Data Table on Russia - Market size and forecast 2025-2030 ($ million)
Chart on Russia - Year-over-year growth 2025-2030 (%)
Data Table on Russia - Year-over-year growth 2025-2030 (%)

12.5 APAC - Market size and forecast 2025-2030

Chart on APAC - Market size and forecast 2025-2030 ($ million)
Data Table on APAC - Market size and forecast 2025-2030 ($ million)
Chart on APAC - Year-over-year growth 2025-2030 (%)
Data Table on APAC - Year-over-year growth 2025-2030 (%)
Chart on Regional Comparison - APAC
Data Table on Regional Comparison - APAC

12.5.1 China - Market size and forecast 2025-2030

Chart on China - Market size and forecast 2025-2030 ($ million)
Data Table on China - Market size and forecast 2025-2030 ($ million)
Chart on China - Year-over-year growth 2025-2030 (%)
Data Table on China - Year-over-year growth 2025-2030 (%)

12.5.2 Japan - Market size and forecast 2025-2030

Chart on Japan - Market size and forecast 2025-2030 ($ million)
Data Table on Japan - Market size and forecast 2025-2030 ($ million)
Chart on Japan - Year-over-year growth 2025-2030 (%)
Data Table on Japan - Year-over-year growth 2025-2030 (%)

12.5.3 India - Market size and forecast 2025-2030

Chart on India - Market size and forecast 2025-2030 ($ million)
Data Table on India - Market size and forecast 2025-2030 ($ million)
Chart on India - Year-over-year growth 2025-2030 (%)
Data Table on India - Year-over-year growth 2025-2030 (%)

12.5.4 Australia - Market size and forecast 2025-2030

Chart on Australia - Market size and forecast 2025-2030 ($ million)
Data Table on Australia - Market size and forecast 2025-2030 ($ million)
Chart on Australia - Year-over-year growth 2025-2030 (%)
Data Table on Australia - Year-over-year growth 2025-2030 (%)

12.5.5 South Korea - Market size and forecast 2025-2030

Chart on South Korea - Market size and forecast 2025-2030 ($ million)
Data Table on South Korea - Market size and forecast 2025-2030 ($ million)
Chart on South Korea - Year-over-year growth 2025-2030 (%)
Data Table on South Korea - Year-over-year growth 2025-2030 (%)

12.5.6 Thailand - Market size and forecast 2025-2030

Chart on Thailand - Market size and forecast 2025-2030 ($ million)
Data Table on Thailand - Market size and forecast 2025-2030 ($ million)
Chart on Thailand - Year-over-year growth 2025-2030 (%)
Data Table on Thailand - Year-over-year growth 2025-2030 (%)

12.6 South America - Market size and forecast 2025-2030

Chart on South America - Market size and forecast 2025-2030 ($ million)
Data Table on South America - Market size and forecast 2025-2030 ($ million)
Chart on South America - Year-over-year growth 2025-2030 (%)
Data Table on South America - Year-over-year growth 2025-2030 (%)
Chart on Regional Comparison - South America
Data Table on Regional Comparison - South America

12.6.1 Brazil - Market size and forecast 2025-2030

Chart on Brazil - Market size and forecast 2025-2030 ($ million)
Data Table on Brazil - Market size and forecast 2025-2030 ($ million)
Chart on Brazil - Year-over-year growth 2025-2030 (%)
Data Table on Brazil - Year-over-year growth 2025-2030 (%)

12.6.2 Argentina - Market size and forecast 2025-2030

Chart on Argentina - Market size and forecast 2025-2030 ($ million)
Data Table on Argentina - Market size and forecast 2025-2030 ($ million)
Chart on Argentina - Year-over-year growth 2025-2030 (%)
Data Table on Argentina - Year-over-year growth 2025-2030 (%)

12.6.3 Colombia - Market size and forecast 2025-2030

Chart on Colombia - Market size and forecast 2025-2030 ($ million)
Data Table on Colombia - Market size and forecast 2025-2030 ($ million)
Chart on Colombia - Year-over-year growth 2025-2030 (%)
Data Table on Colombia - Year-over-year growth 2025-2030 (%)

12.7 Middle East and Africa - Market size and forecast 2025-2030

Chart on Middle East and Africa - Market size and forecast 2025-2030 ($ million)
Data Table on Middle East and Africa - Market size and forecast 2025-2030 ($ million)
Chart on Middle East and Africa - Year-over-year growth 2025-2030 (%)
Data Table on Middle East and Africa - Year-over-year growth 2025-2030 (%)
Chart on Regional Comparison - Middle East and Africa
Data Table on Regional Comparison - Middle East and Africa

12.7.1 Saudi Arabia - Market size and forecast 2025-2030

Chart on Saudi Arabia - Market size and forecast 2025-2030 ($ million)
Data Table on Saudi Arabia - Market size and forecast 2025-2030 ($ million)
Chart on Saudi Arabia - Year-over-year growth 2025-2030 (%)
Data Table on Saudi Arabia - Year-over-year growth 2025-2030 (%)

12.7.2 UAE - Market size and forecast 2025-2030

Chart on UAE - Market size and forecast 2025-2030 ($ million)
Data Table on UAE - Market size and forecast 2025-2030 ($ million)
Chart on UAE - Year-over-year growth 2025-2030 (%)
Data Table on UAE - Year-over-year growth 2025-2030 (%)

12.7.3 South Africa - Market size and forecast 2025-2030

Chart on South Africa - Market size and forecast 2025-2030 ($ million)
Data Table on South Africa - Market size and forecast 2025-2030 ($ million)
Chart on South Africa - Year-over-year growth 2025-2030 (%)
Data Table on South Africa - Year-over-year growth 2025-2030 (%)

12.7.4 Turkey - Market size and forecast 2025-2030

Chart on Turkey - Market size and forecast 2025-2030 ($ million)
Data Table on Turkey - Market size and forecast 2025-2030 ($ million)
Chart on Turkey - Year-over-year growth 2025-2030 (%)
Data Table on Turkey - Year-over-year growth 2025-2030 (%)

12.7.5 Egypt - Market size and forecast 2025-2030

Chart on Egypt - Market size and forecast 2025-2030 ($ million)
Data Table on Egypt - Market size and forecast 2025-2030 ($ million)
Chart on Egypt - Year-over-year growth 2025-2030 (%)
Data Table on Egypt - Year-over-year growth 2025-2030 (%)

12.8 Market opportunity by geography

Market opportunity by geography ($ million)
Data Tables on Market opportunity by geography ($ million)

13. Drivers, Challenges, and Opportunity

13.1 Market drivers

Surging global participation in combat sports and functional fitness
Technological innovations in shock mitigation
Expansion of professional combat leagues and global media exposure

13.2 Market challenges

Proliferation of counterfeit products and uncertified equipment
Volatility in raw material costs and supply chain disruption
High capital costs of certified specialized gear and compliance barriers

13.3 Impact of drivers and challenges

Impact of drivers and challenges in 2025 and 2030

13.4 Market opportunities

Integration of smart sensor technologies and wearable telemetry systems
Transition toward bio-based synthetic leather and sustainable materials
Surge in gender-specific and youth-tailored ergonomic product designs

14. Competitive Landscape

14.1 Overview

14.2

Overview on criticality of inputs and factors of differentiation

14.3 Landscape disruption

Overview on factors of disruption

14.4 Industry risks

Impact of key risks on business

15. Competitive Analysis

15.1 Companies profiled

Companies covered

15.2 Company ranking index

15.3 Market positioning of companies

Matrix on companies position and classification

15.4 Blitz Corp. Ltd.

Blitz Corp. Ltd. - Overview
Blitz Corp. Ltd. - Product / Service
Blitz Corp. Ltd. - Key offerings
SWOT

15.5 Century LLC

Century LLC - Overview
Century LLC - Product / Service
Century LLC - Key offerings
SWOT

15.6 Everlast Worldwide Inc.

Everlast Worldwide Inc. - Overview
Everlast Worldwide Inc. - Product / Service
Everlast Worldwide Inc. - Key offerings
SWOT

15.7 Fairtex Equipment Co. Ltd.

Fairtex Equipment Co. Ltd. - Overview
Fairtex Equipment Co. Ltd. - Product / Service
Fairtex Equipment Co. Ltd. - Key offerings
SWOT

15.8 Hayabusa Fightwear Inc.

Hayabusa Fightwear Inc. - Overview
Hayabusa Fightwear Inc. - Product / Service
Hayabusa Fightwear Inc. - Key offerings
SWOT

15.9 King Pro Boxing

King Pro Boxing - Overview
King Pro Boxing - Product / Service
King Pro Boxing - Key offerings
SWOT

15.10 Lonsdale

Lonsdale - Overview
Lonsdale - Product / Service
Lonsdale - Key offerings
SWOT

15.11 Madx Sports

Madx Sports - Overview
Madx Sports - Product / Service
Madx Sports - Key offerings
SWOT

15.12 Rainwolf Sports

Rainwolf Sports - Overview
Rainwolf Sports - Product / Service
Rainwolf Sports - Key offerings
SWOT

15.13 RDX Inc.

RDX Inc. - Overview
RDX Inc. - Product / Service
RDX Inc. - Key offerings
SWOT

15.14 Revgear Sports Co.

Revgear Sports Co. - Overview
Revgear Sports Co. - Product / Service
Revgear Sports Co. - Key offerings
SWOT

15.15 Rival Boxing Gear Inc.

Rival Boxing Gear Inc. - Overview
Rival Boxing Gear Inc. - Product / Service
Rival Boxing Gear Inc. - Key offerings
SWOT

15.16 Sanabul Sports

Sanabul Sports - Overview
Sanabul Sports - Product / Service
Sanabul Sports - Key offerings
SWOT

15.17 Superior Challenge International

Superior Challenge International - Overview
Superior Challenge International - Product / Service
Superior Challenge International - Key offerings
SWOT

15.18 TITLE Boxing

TITLE Boxing - Overview
TITLE Boxing - Product / Service
TITLE Boxing - Key offerings
SWOT

16. Appendix

16.1 Scope of the report

Market definition
Objectives
Notes and caveats

16.2 Inclusions and exclusions checklist

Inclusions checklist
Exclusions checklist

16.3 Currency conversion rates for US$

16.4 Research methodology

16.5 Data procurement

Information sources

16.6 Data validation

16.7 Validation techniques employed for market sizing

16.8 Data synthesis

16.9 360 degree market analysis

16.10 List of abbreviations

Research Methodology

Technavio presents a detailed picture of the market by way of study, synthesis, and summation of data from multiple sources. The analysts have presented the various facets of the market with a particular focus on identifying the key industry influencers. The data thus presented is comprehensive, reliable, and the result of extensive research, both primary and secondary.

INFORMATION SOURCES

Primary sources

  • Manufacturers and suppliers
  • Channel partners
  • Industry experts
  • Strategic decision makers

Secondary sources

  • Industry journals and periodicals
  • Government data
  • Financial reports of key industry players
  • Historical data
  • Press releases

DATA ANALYSIS

Data Synthesis

  • Collation of data
  • Estimation of key figures
  • Analysis of derived insights

Data Validation

  • Triangulation with data models
  • Reference against proprietary databases
  • Corroboration with industry experts

REPORT WRITING

Qualitative

  • Market drivers
  • Market challenges
  • Market trends
  • Five forces analysis

Quantitative

  • Market size and forecast
  • Market segmentation
  • Geographical insights
  • Competitive landscape

Interested in this report?

Get your sample now to see our research methodology and insights!

Download Now

Frequently Asked Questions

Mixed Martial Arts Equipment market growth will increase by USD 287.6 million during 2026-2030.

The Mixed Martial Arts Equipment market is expected to grow at a CAGR of 4.8% during 2026-2030.

Mixed Martial Arts Equipment market is segmented by Product (MMA gloves, Protective gear, Training equipment) Distribution channel (Offline, Online) End-user (Individual, Organization)

Blitz Corp. Ltd., Century LLC, Everlast Worldwide Inc., Fairtex Equipment Co. Ltd., Hayabusa Fightwear Inc., Industria Reyes SA de CV, King Pro Boxing, Lonsdale, Madx Sports, Protech Sports and Wears, Rainwolf Sports, RDX Inc., Revgear Sports Co., Rival Boxing Gear Inc., Sanabul Sports, Superior Challenge International, Tatami Fightwear, TITLE Boxing, Twins Special, Venum are a few of the key vendors in the Mixed Martial Arts Equipment market.

North America will register the highest growth rate of 46.2% among the other regions. Therefore, the Mixed Martial Arts Equipment market in North America is expected to garner significant business opportunities for the vendors during the forecast period.

US, Canada, Mexico, UK, Germany, France, Italy, Spain, Russia, China, Japan, India, Australia, South Korea, Thailand, Brazil, Argentina, Colombia, Saudi Arabia, UAE, South Africa, Turkey, Egypt

  • Surging global participation in combat sports and functional fitness is the driving factor this market.

The Mixed Martial Arts Equipment market vendors should focus on grabbing business opportunities from the Product segment as it accounted for the largest market share in the base year.
RIA - Research AI Assistant
Ask RIA
