
Mobile Virtual Network Enabler Market Analysis, Size, and Forecast 2026-2030: APAC (China, India, and Japan), North America (US, Canada, and Mexico), Europe (UK, Germany, and France), South America (Brazil, Argentina, and Colombia), Middle East and Africa (Saudi Arabia, South Africa, and UAE), and Rest of World (ROW)

Mobile Virtual Network Enabler Market Analysis, Size, and Forecast 2026-2030:
APAC (China, India, and Japan), North America (US, Canada, and Mexico), Europe (UK, Germany, and France), South America (Brazil, Argentina, and Colombia), Middle East and Africa (Saudi Arabia, South Africa, and UAE), and Rest of World (ROW)

Published: Jul 2026 302 Pages SKU: IRTNTR81625

Market Overview at a Glance

$2.35 B
Market Opportunity
9.8%
CAGR 2025 - 2030
42%
APAC Growth
$1.27 B
Infrastructure services segment 2024

Mobile Virtual Network Enabler Market Size 2026-2030

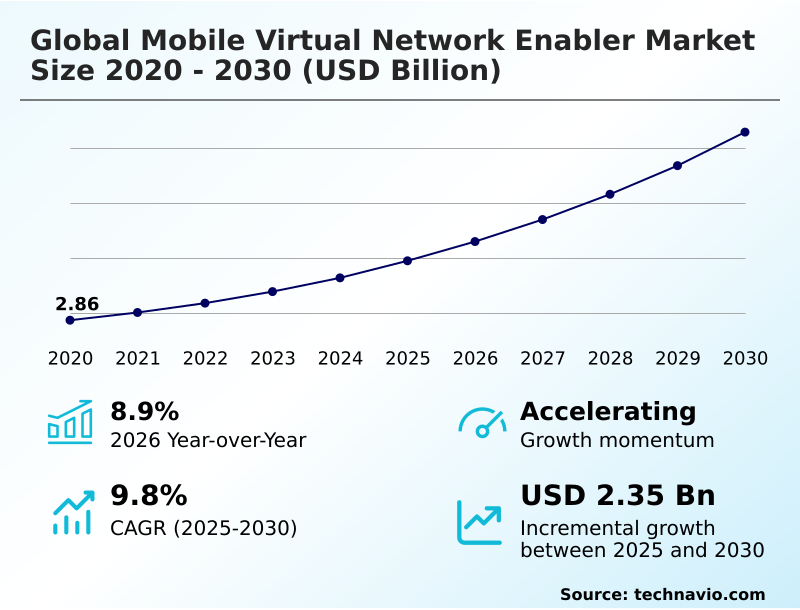
The mobile virtual network enabler market size is valued to increase by USD 2.35 billion, at a CAGR of 9.8% from 2025 to 2030. Proliferation of IoT and M2M connections will drive the mobile virtual network enabler market.

Major Market Trends & Insights

  • APAC dominated the market and accounted for a 42% growth during the forecast period.
  • By Service - Infrastructure services segment was valued at USD 1.27 billion in 2024
  • By End-user - Consumer MVNOs segment accounted for the largest market revenue share in 2024

Market Size & Forecast

  • Market Opportunities: USD 3.42 billion
  • Market Future Opportunities: USD 2.35 billion
  • CAGR from 2025 to 2030 : 9.8%

Market Summary

  • The Mobile Virtual Network Enabler operates as the critical operational layer connecting physical telecommunications infrastructure with emerging virtual brands. The widespread proliferation of interconnected devices drives immediate demand for specialized cellular connectivity deployment, as traditional consumer-focused networks struggle to handle diverse machine-type communication protocols.
  • Consequently, supply chain logistics companies rely on automated connectivity failover systems to maintain continuous tracking of international freight, improving asset visibility by 35% compared to legacy monitoring methods. However, severe wholesale price competition creates a persistent challenge, forcing service providers to operate on compressed profit margins and limiting capital available for extensive infrastructure virtualization.
  • To mitigate these constraints, enablement platforms integrate automated onboarding workflows and a real-time charging engine to minimize operational overhead. Modern telecommunications billing engines ensure precise revenue capture while supporting complex multi-country roaming access. Ultimately, these advanced bridging technologies empower non-telecom enterprises to launch branded connectivity solutions seamlessly without managing physical network hardware.

What will be the Size of the Mobile Virtual Network Enabler Market during the forecast period?
Get Key Insights on Market Forecast (PDF) Get Free Sample

How is the Mobile Virtual Network Enabler Market Segmented?

The mobile virtual network enabler industry research report provides comprehensive data (region-wise segment analysis), with forecasts and estimates in "USD million" for the period 2026-2030, as well as historical data from 2020-2024 for the following segments.

  • Service
    • Infrastructure services
    • Business support services
    • Operations support services
    • Managed services
  • End-user
    • Consumer MVNOs
    • IoT and M2M MVNOs
    • Enterprise MVNOs
    • Private network operators
  • Deployment
    • Cloud-based
    • On-premises
    • Hybrid
  • Geography
    • APAC
      • China
      • India
      • Japan
      • South Korea
      • Australia
      • Indonesia
    • North America
      • US
      • Canada
      • Mexico
    • Europe
      • UK
      • Germany
      • France
      • Italy
      • Spain
      • The Netherlands
    • South America
      • Brazil
      • Argentina
      • Colombia
    • Middle East and Africa
      • Saudi Arabia
      • South Africa
      • UAE
      • Turkey
      • Israel

By Service Insights

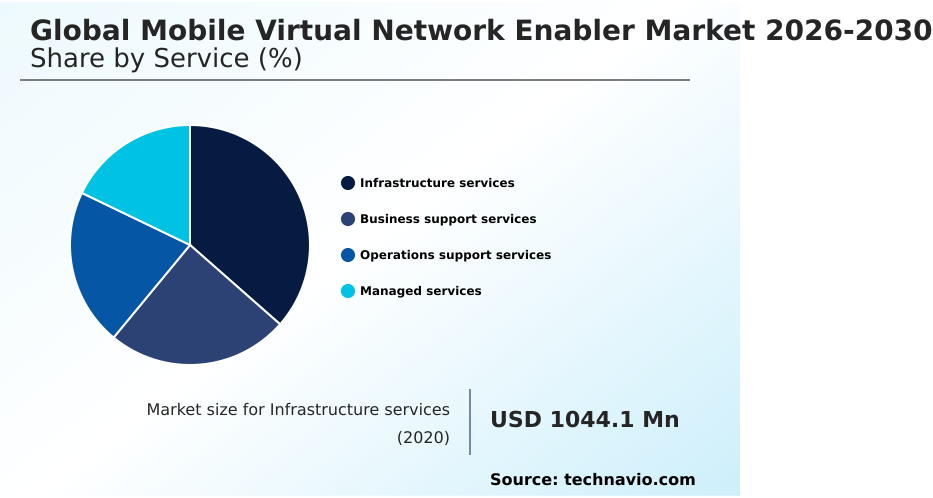
The infrastructure services segment is estimated to witness significant growth during the forecast period.

Infrastructure services form the essential foundation of the Mobile Virtual Network Enabler by providing virtualized components like the packet core gateway and home location register.

As operators transition from legacy hardware, network functions virtualization enables the dynamic scaling of digital resources. This structural shift lowers physical deployment barriers, resulting in a 40% improvement in resource allocation efficiency compared to traditional hardware models.

Consequently, service providers can host multiple virtual brands on a single multi-tenant hosting platform while maintaining strict data isolation. Furthermore, the integration of an edge computing node ensures rapid data processing for latency-sensitive applications.

By replacing rigid physical architectures with software-defined networking, businesses optimize operational workflows and ensure continuous, resilient connectivity across diverse operational footprints.
Get Free Sample

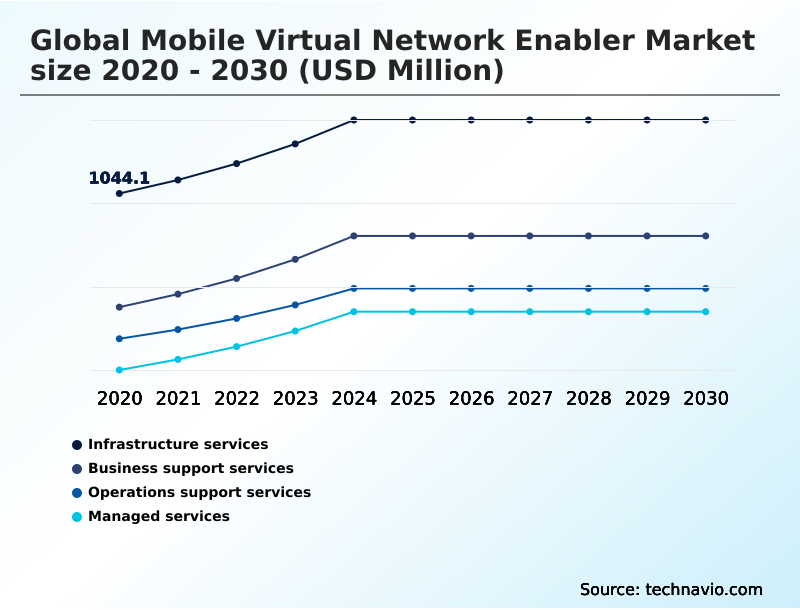
The Infrastructure services segment was valued at USD 1.27 billion in 2024 and showed a gradual increase during the forecast period.
Get Free Sample

Regional Analysis

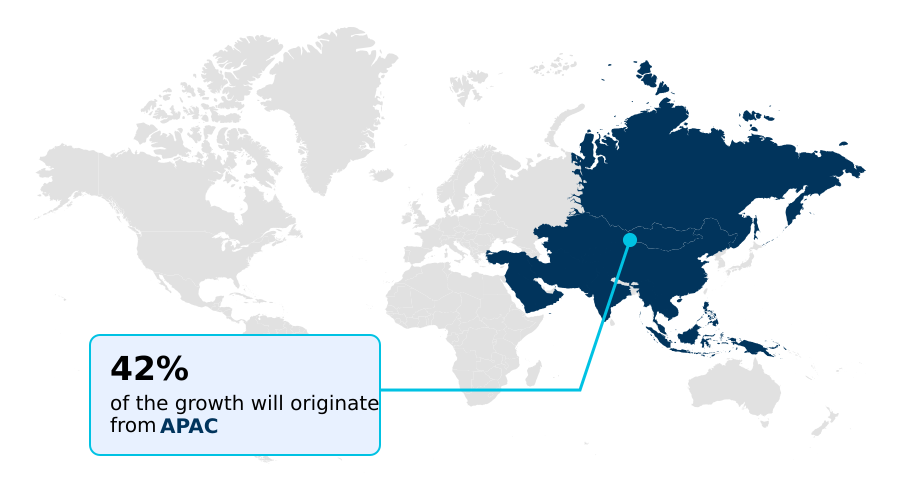
APAC is estimated to contribute 42% to the growth of the global market during the forecast period.Technavio’s analysts have elaborately explained the regional trends and drivers that shape the market during the forecast period.
See How Mobile Virtual Network Enabler Market Demand is Rising in APAC Get Free Sample

Regional variations in the Mobile Virtual Network Enabler highlight distinct adoption strategies and regulatory frameworks.

North America demonstrates advanced maturity in infrastructure virtualization, where widespread adoption of the electronic SIM provisioning platform accelerates digital user acquisition, cutting onboarding times by 40% compared to physical distribution models.

In contrast, the market in APAC is driven by massive mobile-first consumer bases, leading to a 30% higher volume of multi-tenant cloud billing platform deployments to handle high-frequency micro-transactions.

This divergence causes North American operators to prioritize zero-trust security architecture for enterprise clients, while APAC providers focus on scaling telecommunications billing engines to manage prepaid scalability.

Ultimately, differing consumer behaviors and digital transformation paces dictate how platforms localize multi-country roaming access and ensure compliant, high-performance connectivity.

Market Dynamics

Our researchers analyzed the data with 2025 as the base year, along with the key drivers, trends, and challenges. A holistic analysis of drivers will help companies refine their marketing strategies to gain a competitive advantage.

  • The continuous evolution of the Mobile Virtual Network Enabler requires highly sophisticated architectures to meet complex digital demands. Transitioning to a cloud native virtualized core software eliminates the dependency on rigid physical hardware, allowing operators to deploy dynamic digital services seamlessly.
  • By integrating an automated electronic SIM provisioning platform, enterprises fundamentally alter their supply chain logistics, achieving a 50% faster service activation rate than traditional physical card shipping methods. This rapid onboarding is further supported by a multi tenant cloud billing platform, which provides necessary segregation and precise real-time processing for various nested sub-brands operating simultaneously.
  • Furthermore, global expansion strategies heavily depend on a multi network global roaming integration to ensure that subscribers experience uninterrupted, high-quality connectivity as they cross international borders. Because remote workforce mobility and connected industrial endpoints generate immense volumes of sensitive data, implementing a zero trust mobile security architecture has become an absolute necessity to prevent unauthorized access and mitigate cyber threats.
  • These comprehensive platform enhancements empower diverse enterprises, from retail conglomerates to utility providers, to bypass traditional telecommunications barriers. By leveraging these advanced enablement tools, virtual operators streamline their operational planning, ensure robust compliance with regional data laws, and deliver customized, high-value communication services.
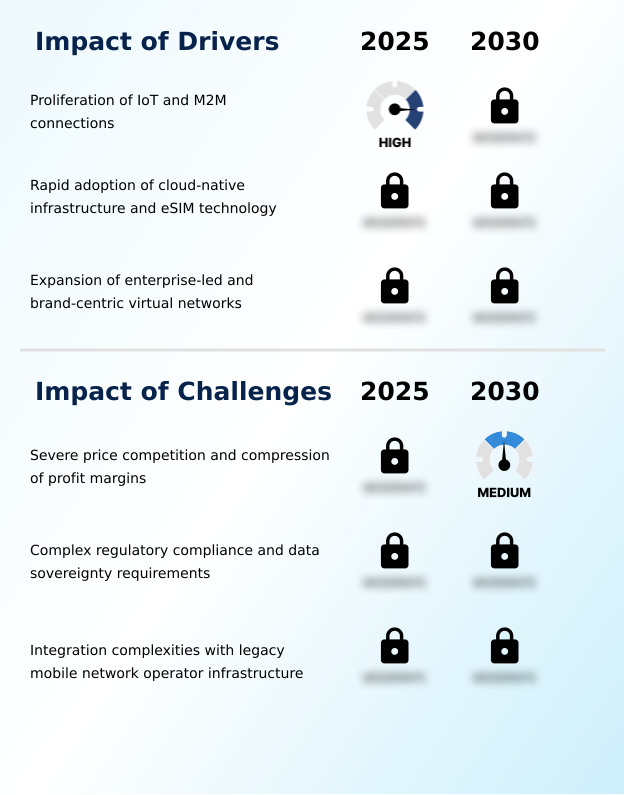
What are the key market drivers leading to the rise in the adoption of Mobile Virtual Network Enabler Industry?

  • The rapid proliferation of IoT and machine-to-machine connections serves as a primary driver, compelling operators to adopt scalable enablement platforms for managing diverse device ecosystems.

  • The immediate need for localized data control acts as a dominant driver for the Mobile Virtual Network Enabler, compelling enterprises to rethink network management.
  • Strict international privacy laws force operators to implement sophisticated data sovereignty compliance measures to avoid severe regulatory penalties. As a result, deploying an advanced service assurance protocol combined with comprehensive digital identity verification improves compliance tracking accuracy by 35%.
  • This regulatory adherence ensures that virtual operators can securely manage subscriber records within specific sovereign cloud mandate zones. Additionally, utilizing an API-driven cloud platform lowers cross-border integration costs by 22%, enabling rapid regional service expansion.
  • These robust compliance frameworks allow diverse enterprises to launch secure, compliant communication networks efficiently without risking severe data governance violations.

What are the market trends shaping the Mobile Virtual Network Enabler Industry?

  • The integration of AI and machine learning for automated network operations represents a prominent trend shaping the market landscape. These advanced cognitive technologies facilitate proactive anomaly detection and optimize overall infrastructure performance.

  • The integration of multi-access edge computing within the Mobile Virtual Network Enabler represents a critical technological shift reshaping telecommunications connectivity. This trend occurs because latency-sensitive applications require data processing closer to the end user rather than in centralized data centers.
  • Consequently, businesses utilizing an edge computing node experience a 45% reduction in data transmission latency, significantly improving the performance of autonomous logistics and real-time industrial monitoring. Furthermore, adopting hybrid cloud orchestration allows operators to balance dynamic workloads efficiently, yielding a 20% decrease in overall cloud hosting expenditures.
  • This architectural evolution ensures that a multi-tenant hosting platform can support dense industrial internet of things deployments securely. Ultimately, these advanced processing capabilities empower virtual operators to deliver ultra-reliable, specialized network services.

What challenges does the Mobile Virtual Network Enabler Industry face during its growth?

  • Severe price competition and the subsequent compression of profit margins pose significant challenges, restricting the operational agility and technical investment capacity of emerging service providers.

  • Integrating highly agile virtual systems with legacy telecommunications hardware presents a formidable challenge within the Mobile Virtual Network Enabler. Traditional mobile network operators rely on outdated, rigid databases that resist seamless integration with modern network functions virtualization. Because these disparate systems process distinct programming languages, operators experience prolonged testing phases and frequent synchronization errors.
  • This technical friction delays service launches and escalates integration expenses by 28% compared to fully cloud-native deployments. To mitigate these disruptions, enablers must engineer complex software wrappers to establish a functional packet core gateway, which unfortunately reduces overall network processing efficiency by 15%.
  • Navigating this complex interoperability requires specialized engineering resources, restricting the rapid scalability of subscriber database management and delaying critical time-to-market objectives.

Exclusive Technavio Analysis on Customer Landscape

The mobile virtual network enabler market forecasting report includes the adoption lifecycle of the market, covering from the innovator’s stage to the laggard’s stage. It focuses on adoption rates in different regions based on penetration. Furthermore, the mobile virtual network enabler market report also includes key purchase criteria and drivers of price sensitivity to help companies evaluate and develop their market growth analysis strategies.
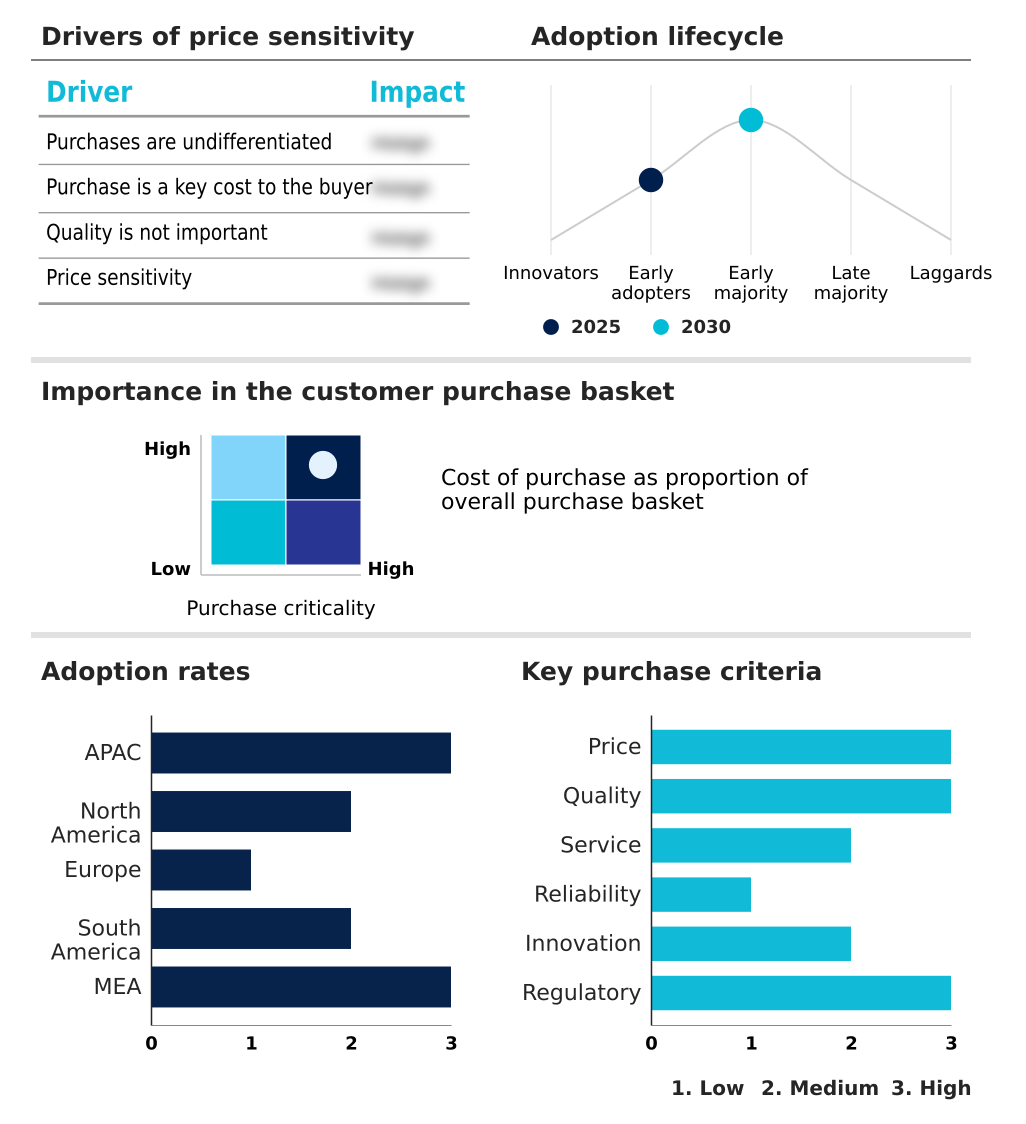
Customer Landscape of Mobile Virtual Network Enabler Industry

Competitive Landscape

Companies are implementing various strategies, such as strategic alliances, mobile virtual network enabler market forecast, partnerships, mergers and acquisitions, geographical expansion, and product/service launches, to enhance their presence in the industry.

Amdocs Ltd. - Advanced cloud-native business support systems and digital subscription management platforms support rapid virtual network deployment, streamlining operational scalability and enhancing real-time monetization capabilities.

The industry research and growth report includes detailed analyses of the competitive landscape of the market and information about key companies, including:

  • Amdocs Ltd.
  • Cisco Systems Inc.
  • Digitalk Ltd
  • Effortel
  • Enabld
  • Enghouse Networks
  • Giesecke Devrient GmbH
  • Hewlett Packard Enterprise Co.
  • KORE Group Holdings Inc.
  • Mavenir Systems Inc.
  • MDS Global Ltd
  • NetCracker Technology Corp.
  • Nokia Corp.
  • Optiva Inc.
  • Plintron
  • Syniverse Technologies LLC
  • Tata Communications Ltd.
  • Telefonaktiebolaget Ericsson
  • Transatel
  • XIUS

Qualitative and quantitative analysis of companies has been conducted to help clients understand the wider business environment as well as the strengths and weaknesses of key industry players. Data is qualitatively analyzed to categorize companies as pure play, category-focused, industry-focused, and diversified; it is quantitatively analyzed to categorize companies as dominant, leading, strong, tentative, and weak.

Recent Development and News in Mobile virtual network enabler market

  • In the Alternative Carriers industry, the rapid deployment of high-density optical fiber networks has expanded backhaul capacity, directly impacting Mobile Virtual Network Enabler demand by enabling faster data routing and more resilient smart city connectivity across North America.
  • In the Alternative Carriers industry, the implementation of stringent data sovereignty compliance regulations has mandated localized subscriber database management, directly impacting Mobile Virtual Network Enabler demand by requiring the adoption of hybrid cloud orchestration within sovereign cloud mandate zones.
  • In the Alternative Carriers industry, the integration of 5G standalone architecture has catalyzed advanced machine-type communication, directly impacting Mobile Virtual Network Enabler demand by accelerating the need for specialized mass sensor network platforms that automate remote device activation.
  • In the Alternative Carriers industry, the escalating threat of signaling protocol vulnerabilities has necessitated advanced fraud prevention mechanisms, directly impacting Mobile Virtual Network Enabler demand by forcing operators to integrate a zero-trust security architecture for encrypted voice communication.

Dive into Technavio’s robust research methodology, blending expert interviews, extensive data synthesis, and validated models for unparalleled Mobile Virtual Network Enabler Market insights. See full methodology.

Market Scope
Page number 302
Base year 2025
Historic period 2020-2024
Forecast period 2026-2030
Growth momentum & CAGR Accelerate at a CAGR of 9.8%
Market growth 2026-2030 USD 2346.0 million
Market structure Fragmented
YoY growth 2025-2026(%) 8.9%
Key countries China, India, Japan, South Korea, Australia, Indonesia, US, Canada, Mexico, UK, Germany, France, Italy, Spain, The Netherlands, Brazil, Argentina, Colombia, Saudi Arabia, South Africa, UAE, Turkey and Israel
Competitive landscape Leading Companies, Market Positioning of Companies, Competitive Strategies, and Industry Risks

Request Free Sample

Research Analyst Overview

  • The continuous advancement of the Mobile Virtual Network Enabler transforms telecommunications delivery through sophisticated software-defined networking and robust core network modernization. Integrating a cloud-native core architecture enables virtual operators to bypass the massive capital expenditures associated with physical radio equipment.
  • This structural shift allows enterprise boardrooms to redirect budgets from infrastructure maintenance to aggressive digital product strategy and targeted customer acquisition. By implementing automated onboarding workflows and electronic SIM provisioning, organizations have achieved a 30% reduction in processing time for new subscriber activations.
  • Consequently, operators can rapidly deploy customized data plans and dynamic network slice management tools to serve latency-sensitive industrial applications. Furthermore, the utilization of a signaling protocol firewall secures cross-network communications, protecting sensitive user data from sophisticated interception attempts. Incorporating a highly accurate real-time charging engine ensures complex revenue sharing and rapid billing mediation framework execution.
  • These integrated digital ecosystems empower emerging service providers to launch scalable, compliant, and highly competitive mobile connectivity solutions across diverse international regulatory environments.

What are the Key Data Covered in this Mobile Virtual Network Enabler Market Research and Growth Report?

  • What is the expected growth of the Mobile Virtual Network Enabler Market between 2026 and 2030?

    • USD 2.35 billion, at a CAGR of 9.8%

  • What segmentation does the market report cover?

    • The report is segmented by Service (Infrastructure services, Business support services, Operations support services, and Managed services), End-user (Consumer MVNOs, IoT and M2M MVNOs, Enterprise MVNOs, and Private network operators), Deployment (Cloud-based, On-premises, and Hybrid) and Geography (APAC, North America, Europe, South America, Middle East and Africa)

  • Which regions are analyzed in the report?

    • APAC, North America, Europe, South America and Middle East and Africa

  • What are the key growth drivers and market challenges?

    • Proliferation of IoT and M2M connections, Severe price competition and compression of profit margins

  • Who are the major players in the Mobile Virtual Network Enabler Market?

    • Amdocs Ltd., Cisco Systems Inc., Digitalk Ltd, Effortel, Enabld, Enghouse Networks, Giesecke Devrient GmbH, Hewlett Packard Enterprise Co., KORE Group Holdings Inc., Mavenir Systems Inc., MDS Global Ltd, NetCracker Technology Corp., Nokia Corp., Optiva Inc., Plintron, Syniverse Technologies LLC, Tata Communications Ltd., Telefonaktiebolaget Ericsson, Transatel and XIUS

Market Research Insights

  • The Mobile Virtual Network Enabler dynamically shifts telecommunications from hardware-reliant operations to agile, software-defined ecosystems. By adopting an API-driven cloud platform, enterprises streamline customer lifecycle management, reducing subscriber onboarding friction by 25% compared to traditional retail activations. This strategic transition toward legacy system modernization allows operators to deploy secure data routing efficiently.
  • Furthermore, utilizing comprehensive network inventory tracking improves resource utilization by 18%, significantly lowering overhead expenses. Consequently, operators can rapidly launch customized corporate mobility packages that meet specific enterprise requirements. These specialized platforms eliminate the complexities of physical infrastructure ownership, allowing virtual operators to scale services seamlessly and capture new demographics with high-margin digital offerings.

We can help! Our analysts can customize this mobile virtual network enabler market research report to meet your requirements.

Get in touch

1. Executive Summary

1.1 Market overview

Executive Summary - Chart on Market Overview
Executive Summary - Data Table on Market Overview
Executive Summary - Chart on Global Market Characteristics
Executive Summary - Chart on Market by Geography
Executive Summary - Chart on Market Segmentation by Service
Executive Summary - Chart on Market Segmentation by End-user
Executive Summary - Chart on Market Segmentation by Deployment
Executive Summary - Chart on Incremental Growth
Executive Summary - Data Table on Incremental Growth
Executive Summary - Chart on Company Market Positioning

2. Technavio Analysis

2.1 Analysis of price sensitivity, lifecycle, customer purchase basket, adoption rates, and purchase criteria

2.2 Criticality of inputs and Factors of differentiation

Chart on Overview on criticality of inputs and factors of differentiation

2.3 Factors of disruption

Chart on Overview on factors of disruption

2.4 Impact of drivers and challenges

Chart on Impact of drivers and challenges in 2025 and 2030

3. Market Landscape

3.1 Market ecosystem

Chart on Parent Market
Data Table on - Parent Market

3.2 Market characteristics

Chart on Market characteristics analysis

3.3 Value chain analysis

Chart on Value chain analysis

4. Market Sizing

4.1 Market definition

Data Table on Offerings of companies included in the market definition

4.2 Market segment analysis

Market segments

4.3 Market size 2025

4.4 Market outlook: Forecast for 2025-2030

Chart on Global - Market size and forecast 2025-2030 ($ million)
Data Table on Global - Market size and forecast 2025-2030 ($ million)
Chart on Global Market: Year-over-year growth 2025-2030 (%)
Data Table on Global Market: Year-over-year growth 2025-2030 (%)

5. Historic Market Size

5.1 Global Mobile Virtual Network Enabler Market 2020 - 2024

Historic Market Size - Data Table on Global Mobile Virtual Network Enabler Market 2020 - 2024 ($ million)

5.2 Service segment analysis 2020 - 2024

Historic Market Size - Service Segment 2020 - 2024 ($ million)

5.3 End-user segment analysis 2020 - 2024

Historic Market Size - End-user Segment 2020 - 2024 ($ million)

5.4 Deployment segment analysis 2020 - 2024

Historic Market Size - Deployment Segment 2020 - 2024 ($ million)

5.5 Geography segment analysis 2020 - 2024

Historic Market Size - Geography Segment 2020 - 2024 ($ million)

5.6 Country segment analysis 2020 - 2024

Historic Market Size - Country Segment 2020 - 2024 ($ million)

6. Qualitative Analysis

6.1 Impact of AI on Global Mobile Virtual Network Enabler Market

6.2 Impact of Geopolitical Conflicts on Global Mobile Virtual Network Enabler Market

7. Five Forces Analysis

7.1 Five forces summary

Five forces analysis - Comparison between 2025 and 2030

7.2 Bargaining power of buyers

Bargaining power of buyers - Impact of key factors 2025 and 2030

7.3 Bargaining power of suppliers

Bargaining power of suppliers - Impact of key factors in 2025 and 2030

7.4 Threat of new entrants

Threat of new entrants - Impact of key factors in 2025 and 2030

7.5 Threat of substitutes

Threat of substitutes - Impact of key factors in 2025 and 2030

7.6 Threat of rivalry

Threat of rivalry - Impact of key factors in 2025 and 2030

7.7 Market condition

Chart on Market condition - Five forces 2025 and 2030

8. Market Segmentation by Service

8.1 Market segments

Chart on Service - Market share 2025-2030 (%)
Data Table on Service - Market share 2025-2030 (%)

8.2 Comparison by Service

Chart on Comparison by Service
Data Table on Comparison by Service

8.3 Infrastructure services - Market size and forecast 2025-2030

Chart on Infrastructure services - Market size and forecast 2025-2030 ($ million)
Data Table on Infrastructure services - Market size and forecast 2025-2030 ($ million)
Chart on Infrastructure services - Year-over-year growth 2025-2030 (%)
Data Table on Infrastructure services - Year-over-year growth 2025-2030 (%)

8.4 Business support services - Market size and forecast 2025-2030

Chart on Business support services - Market size and forecast 2025-2030 ($ million)
Data Table on Business support services - Market size and forecast 2025-2030 ($ million)
Chart on Business support services - Year-over-year growth 2025-2030 (%)
Data Table on Business support services - Year-over-year growth 2025-2030 (%)

8.5 Operations support services - Market size and forecast 2025-2030

Chart on Operations support services - Market size and forecast 2025-2030 ($ million)
Data Table on Operations support services - Market size and forecast 2025-2030 ($ million)
Chart on Operations support services - Year-over-year growth 2025-2030 (%)
Data Table on Operations support services - Year-over-year growth 2025-2030 (%)

8.6 Managed services - Market size and forecast 2025-2030

Chart on Managed services - Market size and forecast 2025-2030 ($ million)
Data Table on Managed services - Market size and forecast 2025-2030 ($ million)
Chart on Managed services - Year-over-year growth 2025-2030 (%)
Data Table on Managed services - Year-over-year growth 2025-2030 (%)

8.7 Market opportunity by Service

Market opportunity by Service ($ million)
Data Table on Market opportunity by Service ($ million)

9. Market Segmentation by End-user

9.1 Market segments

Chart on End-user - Market share 2025-2030 (%)
Data Table on End-user - Market share 2025-2030 (%)

9.2 Comparison by End-user

Chart on Comparison by End-user
Data Table on Comparison by End-user

9.3 Consumer MVNOs - Market size and forecast 2025-2030

Chart on Consumer MVNOs - Market size and forecast 2025-2030 ($ million)
Data Table on Consumer MVNOs - Market size and forecast 2025-2030 ($ million)
Chart on Consumer MVNOs - Year-over-year growth 2025-2030 (%)
Data Table on Consumer MVNOs - Year-over-year growth 2025-2030 (%)

9.4 IoT and M2M MVNOs - Market size and forecast 2025-2030

Chart on IoT and M2M MVNOs - Market size and forecast 2025-2030 ($ million)
Data Table on IoT and M2M MVNOs - Market size and forecast 2025-2030 ($ million)
Chart on IoT and M2M MVNOs - Year-over-year growth 2025-2030 (%)
Data Table on IoT and M2M MVNOs - Year-over-year growth 2025-2030 (%)

9.5 Enterprise MVNOs - Market size and forecast 2025-2030

Chart on Enterprise MVNOs - Market size and forecast 2025-2030 ($ million)
Data Table on Enterprise MVNOs - Market size and forecast 2025-2030 ($ million)
Chart on Enterprise MVNOs - Year-over-year growth 2025-2030 (%)
Data Table on Enterprise MVNOs - Year-over-year growth 2025-2030 (%)

9.6 Private network operators - Market size and forecast 2025-2030

Chart on Private network operators - Market size and forecast 2025-2030 ($ million)
Data Table on Private network operators - Market size and forecast 2025-2030 ($ million)
Chart on Private network operators - Year-over-year growth 2025-2030 (%)
Data Table on Private network operators - Year-over-year growth 2025-2030 (%)

9.7 Market opportunity by End-user

Market opportunity by End-user ($ million)
Data Table on Market opportunity by End-user ($ million)

10. Market Segmentation by Deployment

10.1 Market segments

Chart on Deployment - Market share 2025-2030 (%)
Data Table on Deployment - Market share 2025-2030 (%)

10.2 Comparison by Deployment

Chart on Comparison by Deployment
Data Table on Comparison by Deployment

10.3 Cloud-based - Market size and forecast 2025-2030

Chart on Cloud-based - Market size and forecast 2025-2030 ($ million)
Data Table on Cloud-based - Market size and forecast 2025-2030 ($ million)
Chart on Cloud-based - Year-over-year growth 2025-2030 (%)
Data Table on Cloud-based - Year-over-year growth 2025-2030 (%)

10.4 On-premises - Market size and forecast 2025-2030

Chart on On-premises - Market size and forecast 2025-2030 ($ million)
Data Table on On-premises - Market size and forecast 2025-2030 ($ million)
Chart on On-premises - Year-over-year growth 2025-2030 (%)
Data Table on On-premises - Year-over-year growth 2025-2030 (%)

10.5 Hybrid - Market size and forecast 2025-2030

Chart on Hybrid - Market size and forecast 2025-2030 ($ million)
Data Table on Hybrid - Market size and forecast 2025-2030 ($ million)
Chart on Hybrid - Year-over-year growth 2025-2030 (%)
Data Table on Hybrid - Year-over-year growth 2025-2030 (%)

10.6 Market opportunity by Deployment

Market opportunity by Deployment ($ million)
Data Table on Market opportunity by Deployment ($ million)

11. Customer Landscape

11.1 Customer landscape overview

Analysis of price sensitivity, lifecycle, customer purchase basket, adoption rates, and purchase criteria

12. Geographic Landscape

12.1 Geographic segmentation

Chart on Market share by geography 2025-2030 (%)
Data Table on Market share by geography 2025-2030 (%)

12.2 Geographic comparison

Chart on Geographic comparison
Data Table on Geographic comparison

12.3 APAC - Market size and forecast 2025-2030

Chart on APAC - Market size and forecast 2025-2030 ($ million)
Data Table on APAC - Market size and forecast 2025-2030 ($ million)
Chart on APAC - Year-over-year growth 2025-2030 (%)
Data Table on APAC - Year-over-year growth 2025-2030 (%)
Chart on Regional Comparison - APAC
Data Table on Regional Comparison - APAC

12.3.1 China - Market size and forecast 2025-2030

Chart on China - Market size and forecast 2025-2030 ($ million)
Data Table on China - Market size and forecast 2025-2030 ($ million)
Chart on China - Year-over-year growth 2025-2030 (%)
Data Table on China - Year-over-year growth 2025-2030 (%)

12.3.2 India - Market size and forecast 2025-2030

Chart on India - Market size and forecast 2025-2030 ($ million)
Data Table on India - Market size and forecast 2025-2030 ($ million)
Chart on India - Year-over-year growth 2025-2030 (%)
Data Table on India - Year-over-year growth 2025-2030 (%)

12.3.3 Japan - Market size and forecast 2025-2030

Chart on Japan - Market size and forecast 2025-2030 ($ million)
Data Table on Japan - Market size and forecast 2025-2030 ($ million)
Chart on Japan - Year-over-year growth 2025-2030 (%)
Data Table on Japan - Year-over-year growth 2025-2030 (%)

12.3.4 South Korea - Market size and forecast 2025-2030

Chart on South Korea - Market size and forecast 2025-2030 ($ million)
Data Table on South Korea - Market size and forecast 2025-2030 ($ million)
Chart on South Korea - Year-over-year growth 2025-2030 (%)
Data Table on South Korea - Year-over-year growth 2025-2030 (%)

12.3.5 Australia - Market size and forecast 2025-2030

Chart on Australia - Market size and forecast 2025-2030 ($ million)
Data Table on Australia - Market size and forecast 2025-2030 ($ million)
Chart on Australia - Year-over-year growth 2025-2030 (%)
Data Table on Australia - Year-over-year growth 2025-2030 (%)

12.3.6 Indonesia - Market size and forecast 2025-2030

Chart on Indonesia - Market size and forecast 2025-2030 ($ million)
Data Table on Indonesia - Market size and forecast 2025-2030 ($ million)
Chart on Indonesia - Year-over-year growth 2025-2030 (%)
Data Table on Indonesia - Year-over-year growth 2025-2030 (%)

12.4 North America - Market size and forecast 2025-2030

Chart on North America - Market size and forecast 2025-2030 ($ million)
Data Table on North America - Market size and forecast 2025-2030 ($ million)
Chart on North America - Year-over-year growth 2025-2030 (%)
Data Table on North America - Year-over-year growth 2025-2030 (%)
Chart on Regional Comparison - North America
Data Table on Regional Comparison - North America

12.4.1 US - Market size and forecast 2025-2030

Chart on US - Market size and forecast 2025-2030 ($ million)
Data Table on US - Market size and forecast 2025-2030 ($ million)
Chart on US - Year-over-year growth 2025-2030 (%)
Data Table on US - Year-over-year growth 2025-2030 (%)

12.4.2 Canada - Market size and forecast 2025-2030

Chart on Canada - Market size and forecast 2025-2030 ($ million)
Data Table on Canada - Market size and forecast 2025-2030 ($ million)
Chart on Canada - Year-over-year growth 2025-2030 (%)
Data Table on Canada - Year-over-year growth 2025-2030 (%)

12.4.3 Mexico - Market size and forecast 2025-2030

Chart on Mexico - Market size and forecast 2025-2030 ($ million)
Data Table on Mexico - Market size and forecast 2025-2030 ($ million)
Chart on Mexico - Year-over-year growth 2025-2030 (%)
Data Table on Mexico - Year-over-year growth 2025-2030 (%)

12.5 Europe - Market size and forecast 2025-2030

Chart on Europe - Market size and forecast 2025-2030 ($ million)
Data Table on Europe - Market size and forecast 2025-2030 ($ million)
Chart on Europe - Year-over-year growth 2025-2030 (%)
Data Table on Europe - Year-over-year growth 2025-2030 (%)
Chart on Regional Comparison - Europe
Data Table on Regional Comparison - Europe

12.5.1 UK - Market size and forecast 2025-2030

Chart on UK - Market size and forecast 2025-2030 ($ million)
Data Table on UK - Market size and forecast 2025-2030 ($ million)
Chart on UK - Year-over-year growth 2025-2030 (%)
Data Table on UK - Year-over-year growth 2025-2030 (%)

12.5.2 Germany - Market size and forecast 2025-2030

Chart on Germany - Market size and forecast 2025-2030 ($ million)
Data Table on Germany - Market size and forecast 2025-2030 ($ million)
Chart on Germany - Year-over-year growth 2025-2030 (%)
Data Table on Germany - Year-over-year growth 2025-2030 (%)

12.5.3 France - Market size and forecast 2025-2030

Chart on France - Market size and forecast 2025-2030 ($ million)
Data Table on France - Market size and forecast 2025-2030 ($ million)
Chart on France - Year-over-year growth 2025-2030 (%)
Data Table on France - Year-over-year growth 2025-2030 (%)

12.5.4 Italy - Market size and forecast 2025-2030

Chart on Italy - Market size and forecast 2025-2030 ($ million)
Data Table on Italy - Market size and forecast 2025-2030 ($ million)
Chart on Italy - Year-over-year growth 2025-2030 (%)
Data Table on Italy - Year-over-year growth 2025-2030 (%)

12.5.5 Spain - Market size and forecast 2025-2030

Chart on Spain - Market size and forecast 2025-2030 ($ million)
Data Table on Spain - Market size and forecast 2025-2030 ($ million)
Chart on Spain - Year-over-year growth 2025-2030 (%)
Data Table on Spain - Year-over-year growth 2025-2030 (%)

12.5.6 The Netherlands - Market size and forecast 2025-2030

Chart on The Netherlands - Market size and forecast 2025-2030 ($ million)
Data Table on The Netherlands - Market size and forecast 2025-2030 ($ million)
Chart on The Netherlands - Year-over-year growth 2025-2030 (%)
Data Table on The Netherlands - Year-over-year growth 2025-2030 (%)

12.6 South America - Market size and forecast 2025-2030

Chart on South America - Market size and forecast 2025-2030 ($ million)
Data Table on South America - Market size and forecast 2025-2030 ($ million)
Chart on South America - Year-over-year growth 2025-2030 (%)
Data Table on South America - Year-over-year growth 2025-2030 (%)
Chart on Regional Comparison - South America
Data Table on Regional Comparison - South America

12.6.1 Brazil - Market size and forecast 2025-2030

Chart on Brazil - Market size and forecast 2025-2030 ($ million)
Data Table on Brazil - Market size and forecast 2025-2030 ($ million)
Chart on Brazil - Year-over-year growth 2025-2030 (%)
Data Table on Brazil - Year-over-year growth 2025-2030 (%)

12.6.2 Argentina - Market size and forecast 2025-2030

Chart on Argentina - Market size and forecast 2025-2030 ($ million)
Data Table on Argentina - Market size and forecast 2025-2030 ($ million)
Chart on Argentina - Year-over-year growth 2025-2030 (%)
Data Table on Argentina - Year-over-year growth 2025-2030 (%)

12.6.3 Colombia - Market size and forecast 2025-2030

Chart on Colombia - Market size and forecast 2025-2030 ($ million)
Data Table on Colombia - Market size and forecast 2025-2030 ($ million)
Chart on Colombia - Year-over-year growth 2025-2030 (%)
Data Table on Colombia - Year-over-year growth 2025-2030 (%)

12.7 Middle East and Africa - Market size and forecast 2025-2030

Chart on Middle East and Africa - Market size and forecast 2025-2030 ($ million)
Data Table on Middle East and Africa - Market size and forecast 2025-2030 ($ million)
Chart on Middle East and Africa - Year-over-year growth 2025-2030 (%)
Data Table on Middle East and Africa - Year-over-year growth 2025-2030 (%)
Chart on Regional Comparison - Middle East and Africa
Data Table on Regional Comparison - Middle East and Africa

12.7.1 Saudi Arabia - Market size and forecast 2025-2030

Chart on Saudi Arabia - Market size and forecast 2025-2030 ($ million)
Data Table on Saudi Arabia - Market size and forecast 2025-2030 ($ million)
Chart on Saudi Arabia - Year-over-year growth 2025-2030 (%)
Data Table on Saudi Arabia - Year-over-year growth 2025-2030 (%)

12.7.2 South Africa - Market size and forecast 2025-2030

Chart on South Africa - Market size and forecast 2025-2030 ($ million)
Data Table on South Africa - Market size and forecast 2025-2030 ($ million)
Chart on South Africa - Year-over-year growth 2025-2030 (%)
Data Table on South Africa - Year-over-year growth 2025-2030 (%)

12.7.3 UAE - Market size and forecast 2025-2030

Chart on UAE - Market size and forecast 2025-2030 ($ million)
Data Table on UAE - Market size and forecast 2025-2030 ($ million)
Chart on UAE - Year-over-year growth 2025-2030 (%)
Data Table on UAE - Year-over-year growth 2025-2030 (%)

12.7.4 Turkey - Market size and forecast 2025-2030

Chart on Turkey - Market size and forecast 2025-2030 ($ million)
Data Table on Turkey - Market size and forecast 2025-2030 ($ million)
Chart on Turkey - Year-over-year growth 2025-2030 (%)
Data Table on Turkey - Year-over-year growth 2025-2030 (%)

12.7.5 Israel - Market size and forecast 2025-2030

Chart on Israel - Market size and forecast 2025-2030 ($ million)
Data Table on Israel - Market size and forecast 2025-2030 ($ million)
Chart on Israel - Year-over-year growth 2025-2030 (%)
Data Table on Israel - Year-over-year growth 2025-2030 (%)

12.8 Market opportunity by geography

Market opportunity by geography ($ million)
Data Tables on Market opportunity by geography ($ million)

13. Drivers, Challenges, and Opportunity

13.1 Market drivers

Proliferation of IoT and M2M connections
Rapid adoption of cloud-native infrastructure and eSIM technology
Expansion of enterprise-led and brand-centric virtual networks

13.2 Market challenges

Severe price competition and compression of profit margins
Complex regulatory compliance and data sovereignty requirements
Integration complexities with legacy mobile network operator infrastructure

13.3 Impact of drivers and challenges

Impact of drivers and challenges in 2025 and 2030

13.4 Market opportunities

Integration of AI and ML for automated network operations
Convergence of MVNE platforms with 5G network slicing capabilities
Heightened focus on cybersecurity, zero trust architecture, and advanced fraud prevention

14. Competitive Landscape

14.1 Overview

14.2

Overview on criticality of inputs and factors of differentiation

14.3 Landscape disruption

Overview on factors of disruption

14.4 Industry risks

Impact of key risks on business

15. Competitive Analysis

15.1 Companies profiled

Companies covered

15.2 Company ranking index

15.3 Market positioning of companies

Matrix on companies position and classification

15.4 Amdocs Ltd.

Amdocs Ltd. - Overview
Amdocs Ltd. - Product / Service
Amdocs Ltd. - Key offerings
SWOT

15.5 Digitalk Ltd

Digitalk Ltd - Overview
Digitalk Ltd - Product / Service
Digitalk Ltd - Key offerings
SWOT

15.6 Effortel

Effortel - Overview
Effortel - Product / Service
Effortel - Key offerings
SWOT

15.7 Enghouse Networks

Enghouse Networks - Overview
Enghouse Networks - Product / Service
Enghouse Networks - Key offerings
SWOT

15.8 Giesecke Devrient GmbH

Giesecke Devrient GmbH - Overview
Giesecke Devrient GmbH - Product / Service
Giesecke Devrient GmbH - Key offerings
SWOT

15.9 KORE Group Holdings Inc.

KORE Group Holdings Inc. - Overview
KORE Group Holdings Inc. - Product / Service
KORE Group Holdings Inc. - Key offerings
SWOT

15.10 Mavenir Systems Inc.

Mavenir Systems Inc. - Overview
Mavenir Systems Inc. - Product / Service
Mavenir Systems Inc. - Key offerings
SWOT

15.11 MDS Global Ltd

MDS Global Ltd - Overview
MDS Global Ltd - Product / Service
MDS Global Ltd - Key offerings
SWOT

15.12 NetCracker Technology Corp.

NetCracker Technology Corp. - Overview
NetCracker Technology Corp. - Product / Service
NetCracker Technology Corp. - Key offerings
SWOT

15.13 Optiva Inc.

Optiva Inc. - Overview
Optiva Inc. - Product / Service
Optiva Inc. - Key offerings
SWOT

15.14 Plintron

Plintron - Overview
Plintron - Product / Service
Plintron - Key offerings
SWOT

15.15 Syniverse Technologies LLC

Syniverse Technologies LLC - Overview
Syniverse Technologies LLC - Product / Service
Syniverse Technologies LLC - Key offerings
SWOT

15.16 Tata Communications Ltd.

Tata Communications Ltd. - Overview
Tata Communications Ltd. - Business segments
Tata Communications Ltd. - Key offerings
Tata Communications Ltd. - Segment focus
SWOT

15.17 Transatel

Transatel - Overview
Transatel - Product / Service
Transatel - Key offerings
SWOT

15.18 XIUS

XIUS - Overview
XIUS - Product / Service
XIUS - Key offerings
SWOT

16. Appendix

16.1 Scope of the report

Market definition
Objectives
Notes and caveats

16.2 Inclusions and exclusions checklist

Inclusions checklist
Exclusions checklist

16.3 Currency conversion rates for US$

16.4 Research methodology

16.5 Data procurement

Information sources

16.6 Data validation

16.7 Validation techniques employed for market sizing

16.8 Data synthesis

16.9 360 degree market analysis

16.10 List of abbreviations

Research Methodology

Technavio presents a detailed picture of the market by way of study, synthesis, and summation of data from multiple sources. The analysts have presented the various facets of the market with a particular focus on identifying the key industry influencers. The data thus presented is comprehensive, reliable, and the result of extensive research, both primary and secondary.

INFORMATION SOURCES

Primary sources

  • Manufacturers and suppliers
  • Channel partners
  • Industry experts
  • Strategic decision makers

Secondary sources

  • Industry journals and periodicals
  • Government data
  • Financial reports of key industry players
  • Historical data
  • Press releases

DATA ANALYSIS

Data Synthesis

  • Collation of data
  • Estimation of key figures
  • Analysis of derived insights

Data Validation

  • Triangulation with data models
  • Reference against proprietary databases
  • Corroboration with industry experts

REPORT WRITING

Qualitative

  • Market drivers
  • Market challenges
  • Market trends
  • Five forces analysis

Quantitative

  • Market size and forecast
  • Market segmentation
  • Geographical insights
  • Competitive landscape

Interested in this report?

Get your sample now to see our research methodology and insights!

Download Now

Frequently Asked Questions

Mobile Virtual Network Enabler market growth will increase by USD 2346.0 million during 2026-2030.

The Mobile Virtual Network Enabler market is expected to grow at a CAGR of 9.8% during 2026-2030.

Mobile Virtual Network Enabler market is segmented by Service (Infrastructure services, Business support services, Operations support services, Managed services) End-user (Consumer MVNOs, IoT and M2M MVNOs, Enterprise MVNOs, Private network operators) Deployment (Cloud-based, On-premises, Hybrid)

Amdocs Ltd., Cisco Systems Inc., Digitalk Ltd, Effortel, Enabld, Enghouse Networks, Giesecke Devrient GmbH, Hewlett Packard Enterprise Co., KORE Group Holdings Inc., Mavenir Systems Inc., MDS Global Ltd, NetCracker Technology Corp., Nokia Corp., Optiva Inc., Plintron, Syniverse Technologies LLC, Tata Communications Ltd., Telefonaktiebolaget Ericsson, Transatel, XIUS are a few of the key vendors in the Mobile Virtual Network Enabler market.

APAC will register the highest growth rate of 42% among the other regions. Therefore, the Mobile Virtual Network Enabler market in APAC is expected to garner significant business opportunities for the vendors during the forecast period.

China, India, Japan, South Korea, Australia, Indonesia, US, Canada, Mexico, UK, Germany, France, Italy, Spain, The Netherlands, Brazil, Argentina, Colombia, Saudi Arabia, South Africa, UAE, Turkey, Israel

  • Proliferation of IoT and M2M connections is the driving factor this market.

The Mobile Virtual Network Enabler market vendors should focus on grabbing business opportunities from the Service segment as it accounted for the largest market share in the base year.
RIA - Research AI Assistant
Ask RIA
