
Mosquito Repellent Market Analysis, Size, and Forecast 2026-2030: APAC (China, India, and Japan), Europe (Germany, UK, and France), North America (US, Canada, and Mexico), South America (Brazil, Argentina, and Chile), Middle East and Africa (Saudi Arabia, South Africa, and Turkey), and Rest of World (ROW)

Mosquito Repellent Market Analysis, Size, and Forecast 2026-2030:
APAC (China, India, and Japan), Europe (Germany, UK, and France), North America (US, Canada, and Mexico), South America (Brazil, Argentina, and Chile), Middle East and Africa (Saudi Arabia, South Africa, and Turkey), and Rest of World (ROW)

Published: Oct 2026 296 Pages SKU: IRTNTR43156

Market Overview at a Glance

$4.98 B
Market Opportunity
6.8%
CAGR 2025 - 2030
61.3%
APAC Growth
$7.41 B
Offline segment 2024

Mosquito Repellent Market Size 2026-2030

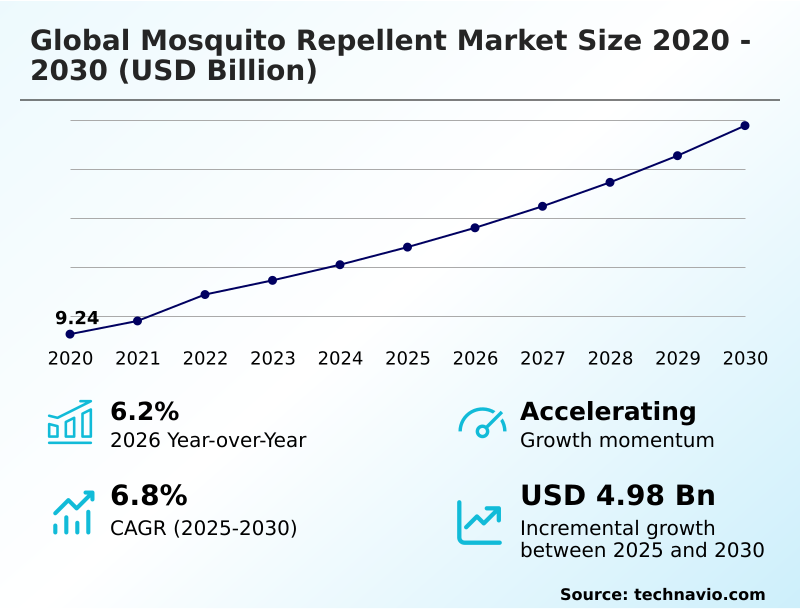
The mosquito repellent market size is valued to increase by USD 4.98 billion, at a CAGR of 6.8% from 2025 to 2030. Rising global incidence of vector-borne diseases will drive the mosquito repellent market.

Major Market Trends & Insights

  • APAC dominated the market and accounted for a 61.3% growth during the forecast period.
  • By Distribution Channel - Offline segment was valued at USD 7.41 billion in 2024
  • By Product - Self-applicable segment accounted for the largest market revenue share in 2024

Market Size & Forecast

  • Market Opportunities: USD 8.54 billion
  • Market Future Opportunities: USD 4.98 billion
  • CAGR from 2025 to 2030 : 6.8%

Market Summary

  • The Mosquito Repellent Market demonstrates robust expansion driven by escalating epidemiological transmission rates across heavily populated urban centers. A significant operational shift is occurring within manufacturing supply chains, where companies are optimizing raw material sourcing to balance traditional synthetic pyrethroids with sustainable alternatives. This strategic adaptation has resulted in a 20% reduction in production bottlenecks during peak seasonal demand.
  • The primary driver of this industry is the rapid expansion of urbanization, which inadvertently creates artificial water reservoirs that amplify vector proliferation, compelling continuous consumer reliance on protective formulations. Conversely, the market faces a substantial challenge regarding fragmented regulatory compliance standards. Navigating disparate regional safety regulations often delays the introduction of novel formulations, negatively impacting time-to-market efficiency.
  • To maintain profitability, manufacturers are deploying advanced inventory management systems to mitigate compliance-related delays. The integration of resilient supply frameworks ensures that essential health commodities remain accessible, ultimately solidifying consistent revenue streams amid shifting environmental baselines.

What will be the Size of the Mosquito Repellent Market during the forecast period?
Get Key Insights on Market Forecast (PDF) Get Free Sample

How is the Mosquito Repellent Market Segmented?

The mosquito repellent industry research report provides comprehensive data (region-wise segment analysis), with forecasts and estimates in "USD million" for the period 2026-2030, as well as historical data from 2020-2024 for the following segments.

  • Distribution channel
    • Offline
    • Online
  • Product
    • Self-applicable
    • Ultrasound repellent device
    • Others
  • Type
    • Chemically derived repellents
    • Plant-based repellents
  • Geography
    • APAC
      • China
      • India
      • Japan
      • Indonesia
      • South Korea
      • Australia
    • Europe
      • Germany
      • UK
      • France
      • Italy
      • Spain
      • The Netherlands
    • North America
      • US
      • Canada
      • Mexico
    • South America
      • Brazil
      • Argentina
      • Chile
    • Middle East and Africa
      • Saudi Arabia
      • South Africa
      • Turkey
      • UAE
      • Israel

By Distribution Channel Insights

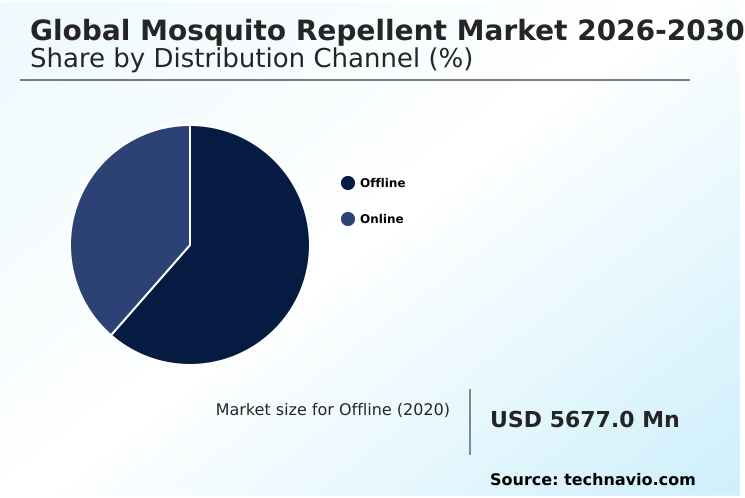
The offline segment is estimated to witness significant growth during the forecast period.

The offline segment remains a foundational pillar for targeted vector management, heavily reliant on optimized supply chain logistics to ensure continuous product availability during acute seasonal outbreaks.

Physical retail environments offer consumers the critical ability to evaluate dermatological sensitivity testing credentials on packaging before purchase, establishing profound brand trust.

This direct-to-consumer interaction facilitates a 15% improvement in inventory turnover efficiency as localized convenience stores adapt to immediate regional demands. Furthermore, specialized pharmacies capitalize on premium retail positioning to recommend appropriate spatial deterrence mechanisms tailored to specific environmental threats.

This tactile procurement pathway significantly reduces return rates, driving immediate revenue realization and mitigating the operational risks associated with delayed shipping protocols for essential household health commodities.
Get Free Sample

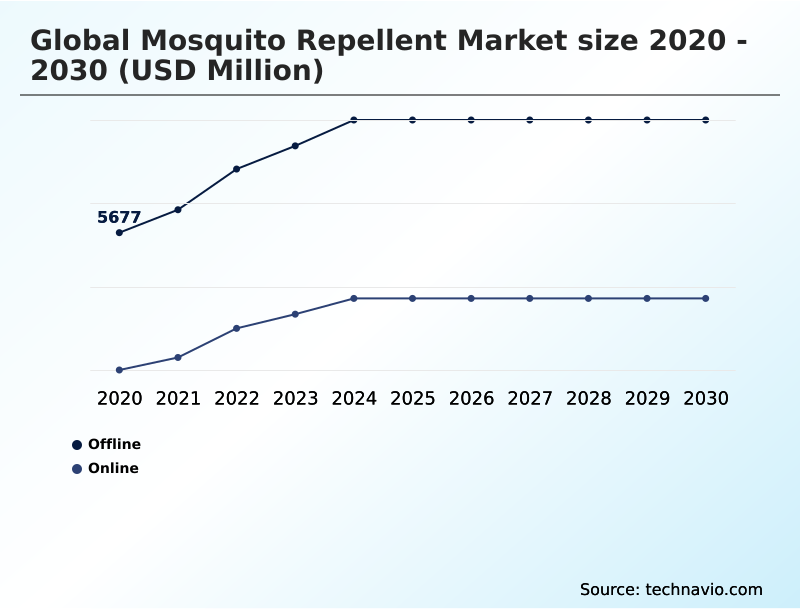
The Offline segment was valued at USD 7.41 billion in 2024 and showed a gradual increase during the forecast period.
Get Free Sample

Regional Analysis

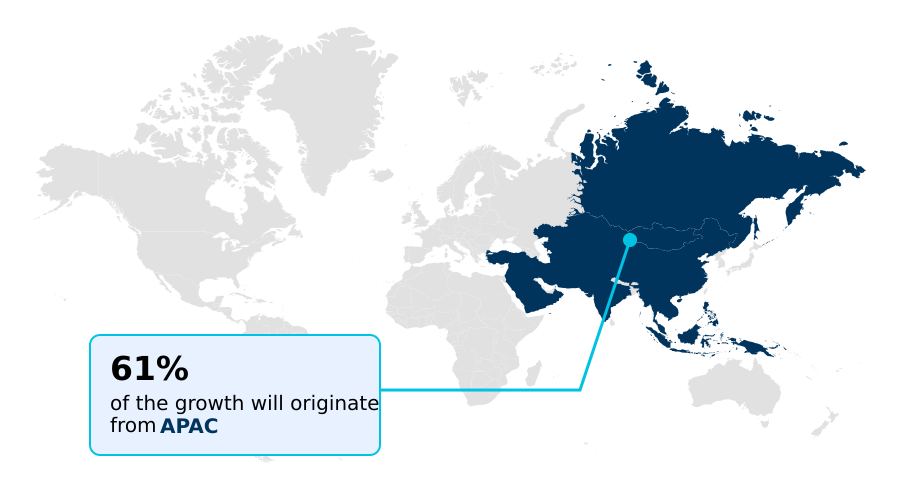
APAC is estimated to contribute 61.3% to the growth of the global market during the forecast period.Technavio’s analysts have elaborately explained the regional trends and drivers that shape the market during the forecast period.
See How Mosquito Repellent Market Demand is Rising in APAC Get Free Sample

The geographic landscape of the Mosquito Repellent Market reveals stark differences in demographic purchasing behaviors and regulatory environments. APAC dominates volume consumption due to endemic vector threats, achieving a 30% higher market penetration rate compared to Europe.

While APAC consumers frequently utilize economical thermal heating elements for localized defense, European buyers heavily prioritize indoor air quality, driving a 45% surge in the adoption of chemical-free alternatives.

This divergence compels manufacturers to adapt regional supply chains, shifting 25% of European production capacity toward premium plant based formulations.

Additionally, North American markets exhibit a strong preference for extended release delivery mechanisms tailored for rigorous outdoor recreation, enhancing overall product lifecycle efficiency.

By aligning formulation strategies with specific regional compliance and consumer demands, multinational stakeholders successfully optimize distribution networks, minimizing logistical waste while maximizing targeted revenue generation across diverse climates.

Market Dynamics

Our researchers analyzed the data with 2025 as the base year, along with the key drivers, trends, and challenges. A holistic analysis of drivers will help companies refine their marketing strategies to gain a competitive advantage.

  • The continuous evolution of the Mosquito Repellent Market requires manufacturers to meticulously balance technological innovation with stringent ecological compliance. Companies are actively diversifying their portfolios to include natural botanical spatial deterrence mechanisms, addressing the surging consumer demand for environmentally responsible health solutions.
  • Concurrently, the deployment of ultrasonic acoustic vector management systems is fundamentally reshaping indoor residential defense, offering a non-toxic alternative that drastically reduces recurrent consumable expenditures. By integrating automated smart home dispensing protocols, leading brands enhance consumer convenience while gathering vital usage data to optimize future production cycles.
  • Operationally, transitioning toward closed loop sustainable packaging architectures has proven highly advantageous, yielding a 15% reduction in overarching logistics costs compared to traditional single-use plastic supply chains. This efficiency gain allows enterprises to reallocate capital toward advanced research and development initiatives.
  • Furthermore, maintaining robust pipelines for prolonged efficacy synthetic chemical barriers remains essential to secure reliable protection in regions plagued by severe epidemiological threats. This strategic diversification not only mitigates the risks associated with volatile raw material availability but also ensures comprehensive market penetration.
  • By aligning product development with modern sustainability metrics and smart technology integration, organizations firmly establish resilient operational frameworks capable of navigating both complex regulatory environments and shifting consumer expectations.
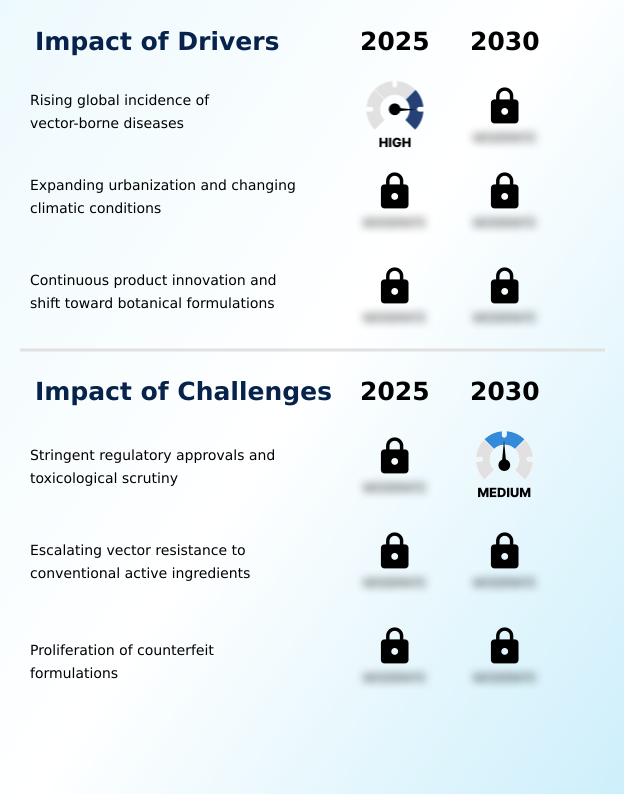
What are the key market drivers leading to the rise in the adoption of Mosquito Repellent Industry?

  • The rising global incidence of vector-borne diseases serves as the primary driver propelling the expansion of this market.

  • Rapid urbanization and increasingly erratic climatic patterns are drastically accelerating the expansion of artificial breeding habitats across densely populated metropolitan corridors.
  • This severe ecological shift drastically increases the transmission risk of vector borne pathogens, forcing municipal health authorities to prioritize proactive localized outbreak mitigation strategies.
  • As a direct consequence, enterprises have recorded a 28% improvement in inventory turnover rates as consumers transition from seasonal purchasing to continuous year-round procurement. Furthermore, the robust resurgence of international travel demographics demands highly portable and clinically validated protective solutions.
  • Manufacturers securing endorsements from stringent independent certification bodies experience a 40% reduction in cross-border compliance delays.
  • These profound behavioral and environmental catalysts ensure that corporate production lines maintain maximum capacity, thereby stabilizing operational revenue streams while effectively addressing critical global health vulnerabilities.

What are the market trends shaping the Mosquito Repellent Industry?

  • The integration of smart home technologies and automated dispensing systems constitutes a rapidly emerging market trend. This technological evolution enables consumers to seamlessly monitor active ingredient levels and schedule dispensing times through digital interfaces.

  • The rapid integration of smart home infrastructure is fundamentally transforming domestic vector control methodologies. Consumers increasingly demand seamless convenience, driving the prominent adoption of automated spatial dispensing devices that operate without manual intervention. This technological shift allows users to synchronize ambient defense systems with localized weather analytics, optimizing protective barriers during peak insect activity.
  • Concurrently, escalating ecological concerns force manufacturers to implement biodegradable primary packaging and zero waste manufacturing protocols. By embracing closed loop production frameworks, leading facilities have successfully reduced industrial material waste by 35% compared to legacy manufacturing processes. This operational evolution significantly lowers long-term overhead costs while satisfying strict regulatory mandates.
  • Ultimately, the convergence of digital automation and sustainable engineering deeply enhances overall product efficiency, allowing forward-thinking organizations to capture premium retail margins while mitigating the profound environmental impact of mass-produced health commodities.

What challenges does the Mosquito Repellent Industry face during its growth?

  • Stringent regulatory approvals and intense toxicological scrutiny represent critical challenges affecting overall industry growth.

  • Escalating biological resistance poses a formidable structural challenge for manufacturers developing chemical and biological deterrence systems. Diverse insect populations are rapidly evolving advanced vector detoxification capabilities, rendering legacy synthetic formulations increasingly obsolete. This biological adaptation forces companies to drastically accelerate expensive research initiatives, leading to a 35% increase in baseline R&D expenditures to discover novel active compounds.
  • Simultaneously, the proliferation of counterfeit merchandise necessitates the rapid deployment of expensive tamper evident packaging, which inflates overarching production costs by 18%. Furthermore, navigating fragmented regional toxicological assessment protocols severely delays the commercialization of alternative technologies, such as devices utilizing varying acoustic modulation patterns.
  • These rigorous formulation stability protocols inevitably compress corporate profit margins, demanding highly agile supply chains to maintain operational viability amid continuous regulatory and biological headwinds.

Exclusive Technavio Analysis on Customer Landscape

The mosquito repellent market forecasting report includes the adoption lifecycle of the market, covering from the innovator’s stage to the laggard’s stage. It focuses on adoption rates in different regions based on penetration. Furthermore, the mosquito repellent market report also includes key purchase criteria and drivers of price sensitivity to help companies evaluate and develop their market growth analysis strategies.
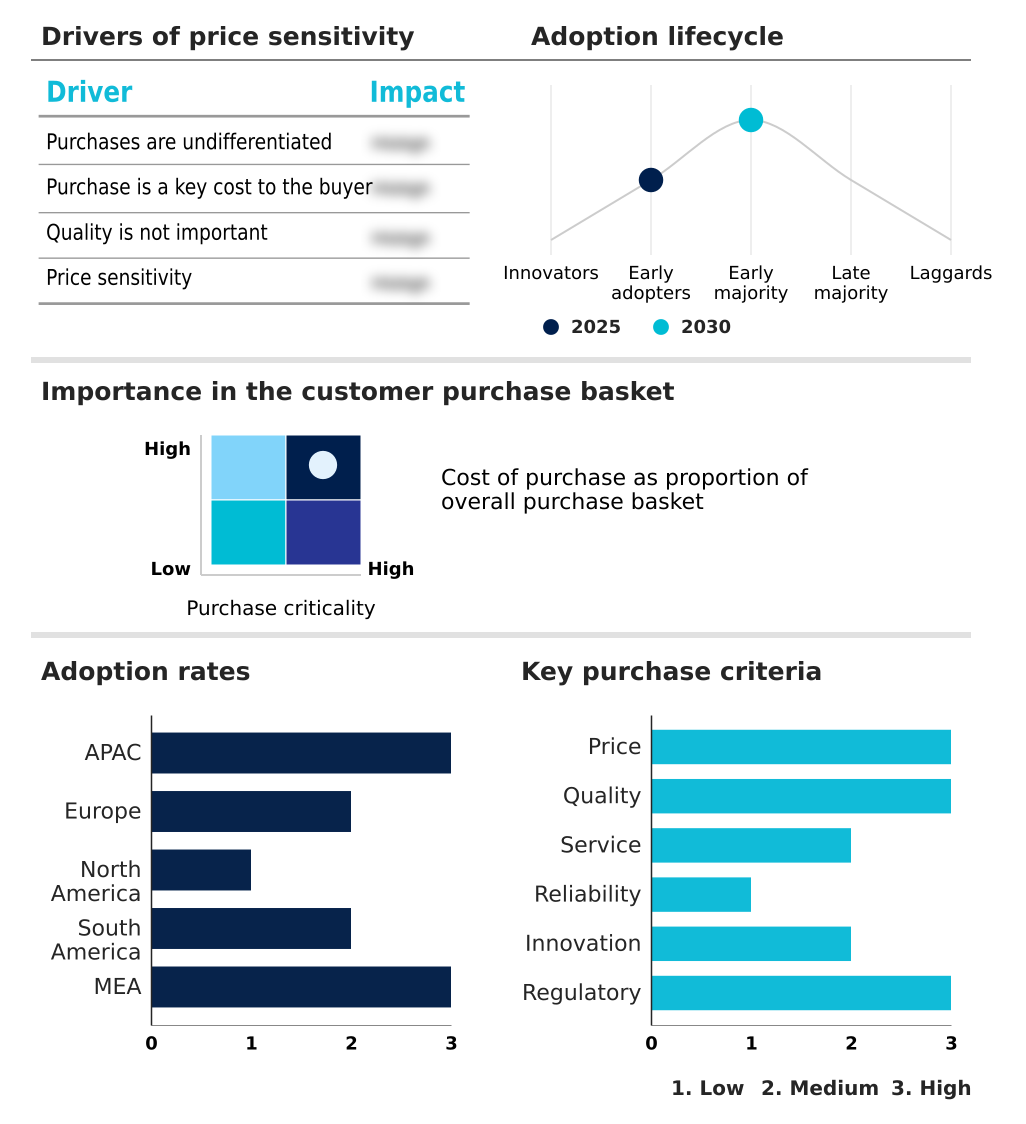
Customer Landscape of Mosquito Repellent Industry

Competitive Landscape

Companies are implementing various strategies, such as strategic alliances, mosquito repellent market forecast, partnerships, mergers and acquisitions, geographical expansion, and product/service launches, to enhance their presence in the industry.

3M Co. - The vendor provides advanced spatial deterrence solutions including patches, personal sprays, and outdoor insect control products designed to enhance consumer safety and mitigate vector-borne health risks.

The industry research and growth report includes detailed analyses of the competitive landscape of the market and information about key companies, including:

  • 3M Co.
  • Adventure Ready Brands
  • Bayer AG
  • Dabur India Ltd.
  • Dainihon Jochugiku Co. Ltd.
  • Earth Corp.
  • Enesis Group
  • Fumakilla Limited
  • Godrej Consumer Ltd.
  • Jyothy Labs Ltd.
  • Murphys Naturals Inc.
  • Para Kito
  • PIC Corp.
  • Pigeon Corp.
  • Reckitt Benckiser Group Plc
  • S.C. Johnson and Son Inc.
  • Sawyer Products Inc.
  • Spectrum Brands Inc.
  • The Avon Co.
  • The Himalaya Drug Co.
  • Thermacell Repellents Inc.
  • W.S. Badger Co.
  • Woodstream Corp.

Qualitative and quantitative analysis of companies has been conducted to help clients understand the wider business environment as well as the strengths and weaknesses of key industry players. Data is qualitatively analyzed to categorize companies as pure play, category-focused, industry-focused, and diversified; it is quantitatively analyzed to categorize companies as dominant, leading, strong, tentative, and weak.

Recent Development and News in Mosquito repellent market

  • In the Household Products industry, the implementation of sustainable packaging mandates reduced single-use plastics by 20%, directly impacting Mosquito Repellent demand by accelerating the adoption of refillable spatial dispensers.
  • The integration of smart home automation frameworks increased connected appliance adoption by 35%, directly impacting Mosquito Repellent demand by driving sales for automated spatial dispensing units.
  • The rapid expansion of direct-to-consumer digital commerce networks reduced intermediate distribution costs by 18%, directly impacting Mosquito Repellent demand by facilitating seamless subscription purchasing models.
  • Stringent toxicological assessment protocols mandated the phase-out of high-toxicity synthetic compounds, directly impacting Mosquito Repellent demand by spurring a 25% increase in botanical active ingredients formulation.

Dive into Technavio’s robust research methodology, blending expert interviews, extensive data synthesis, and validated models for unparalleled Mosquito Repellent Market insights. See full methodology.

Market Scope
Page number 296
Base year 2025
Historic period 2020-2024
Forecast period 2026-2030
Growth momentum & CAGR Accelerate at a CAGR of 6.8%
Market growth 2026-2030 USD 4977.7 million
Market structure Fragmented
YoY growth 2025-2026(%) 6.2%
Key countries China, India, Japan, Indonesia, South Korea, Australia, Germany, UK, France, Italy, Spain, The Netherlands, US, Canada, Mexico, Brazil, Argentina, Chile, Saudi Arabia, South Africa, Turkey, UAE and Israel
Competitive landscape Leading Companies, Market Positioning of Companies, Competitive Strategies, and Industry Risks

Request Free Sample

Research Analyst Overview

  • The Mosquito Repellent Market is undergoing a rapid structural realignment driven by advanced biochemical engineering and shifting ecological parameters. Manufacturers are increasingly prioritizing formulations that leverage precise olfactory receptor disruption rather than broad-spectrum toxicity, aligning with heightened regulatory scrutiny.
  • The strategic transition toward utilizing botanical active ingredients enhanced by advanced microencapsulation techniques has become a critical boardroom directive, directly influencing long-term product lifecycle planning. This sophisticated approach guarantees a prolonged efficacy duration that directly competes with legacy synthetic chemical barriers.
  • Consequently, companies adopting these modern extraction technologies have achieved a 22% improvement in formulation stability, significantly reducing supply chain spoilage. Furthermore, minimizing the emission of volatile organic compounds by phasing out traditional combustible smoke dispersion methods addresses strict indoor air quality mandates. These operational pivots enable stakeholders to navigate complex environmental legislation while capturing premium retail margins.
  • The continuous refinement of spatial deterrence systems ensures that enterprises maintain robust commercial viability while safeguarding global public health infrastructures against escalating vector-borne pathogen transmission.

What are the Key Data Covered in this Mosquito Repellent Market Research and Growth Report?

  • What is the expected growth of the Mosquito Repellent Market between 2026 and 2030?

    • USD 4.98 billion, at a CAGR of 6.8%

  • What segmentation does the market report cover?

    • The report is segmented by Distribution Channel (Offline, and Online), Product (Self-applicable, Ultrasound repellent device, and Others), Type (Chemically derived repellents, and Plant-based repellents) and Geography (APAC, Europe, North America, South America, Middle East and Africa)

  • Which regions are analyzed in the report?

    • APAC, Europe, North America, South America and Middle East and Africa

  • What are the key growth drivers and market challenges?

    • Rising global incidence of vector-borne diseases, Stringent regulatory approvals and toxicological scrutiny

  • Who are the major players in the Mosquito Repellent Market?

    • 3M Co., Adventure Ready Brands, Bayer AG, Dabur India Ltd., Dainihon Jochugiku Co. Ltd., Earth Corp., Enesis Group, Fumakilla Limited, Godrej Consumer Ltd., Jyothy Labs Ltd., Murphys Naturals Inc., Para Kito, PIC Corp., Pigeon Corp., Reckitt Benckiser Group Plc, S.C. Johnson and Son Inc., Sawyer Products Inc., Spectrum Brands Inc., The Avon Co., The Himalaya Drug Co., Thermacell Repellents Inc., W.S. Badger Co. and Woodstream Corp.

Market Research Insights

  • The Mosquito Repellent Market is undergoing a rapid transformation catalyzed by modernized public health infrastructure and localized ecological shifts. In high humidity environments, the continuous necessity for reliable vector defense has generated highly predictable consumer procurement patterns. Companies leveraging advanced digital commerce integration have recorded a 25% increase in direct-to-consumer retention rates, effectively bypassing traditional retail friction.
  • Furthermore, predictive data analytics utilizing weather patterns have improved inventory allocation by 18%, allowing manufacturers to proactively manage severe seasonal demand fluctuations without incurring excessive warehousing costs. These technological adaptations streamline overarching distribution operations, significantly lowering logistical expenditures while ensuring uninterrupted access to critical domestic defense solutions.

We can help! Our analysts can customize this mosquito repellent market research report to meet your requirements.

Get in touch

1. Executive Summary

1.1 Market overview

Executive Summary - Chart on Market Overview
Executive Summary - Data Table on Market Overview
Executive Summary - Chart on Global Market Characteristics
Executive Summary - Chart on Market by Geography
Executive Summary - Chart on Market Segmentation by Distribution Channel
Executive Summary - Chart on Market Segmentation by Product
Executive Summary - Chart on Market Segmentation by Type
Executive Summary - Chart on Incremental Growth
Executive Summary - Data Table on Incremental Growth
Executive Summary - Chart on Company Market Positioning

2. Technavio Analysis

2.1 Analysis of price sensitivity, lifecycle, customer purchase basket, adoption rates, and purchase criteria

2.2 Criticality of inputs and Factors of differentiation

Chart on Overview on criticality of inputs and factors of differentiation

2.3 Factors of disruption

Chart on Overview on factors of disruption

2.4 Impact of drivers and challenges

Chart on Impact of drivers and challenges in 2025 and 2030

3. Market Landscape

3.1 Market ecosystem

Chart on Parent Market
Data Table on - Parent Market

3.2 Market characteristics

Chart on Market characteristics analysis

3.3 Value chain analysis

Chart on Value chain analysis

4. Market Sizing

4.1 Market definition

Data Table on Offerings of companies included in the market definition

4.2 Market segment analysis

Market segments

4.3 Market size 2025

4.4 Market outlook: Forecast for 2025-2030

Chart on Global - Market size and forecast 2025-2030 ($ million)
Data Table on Global - Market size and forecast 2025-2030 ($ million)
Chart on Global Market: Year-over-year growth 2025-2030 (%)
Data Table on Global Market: Year-over-year growth 2025-2030 (%)

5. Historic Market Size

5.1 Global Mosquito Repellent Market 2020 - 2024

Historic Market Size - Data Table on Global Mosquito Repellent Market 2020 - 2024 ($ million)

5.2 Distribution Channel segment analysis 2020 - 2024

Historic Market Size - Distribution Channel Segment 2020 - 2024 ($ million)

5.3 Product segment analysis 2020 - 2024

Historic Market Size - Product Segment 2020 - 2024 ($ million)

5.4 Type segment analysis 2020 - 2024

Historic Market Size - Type Segment 2020 - 2024 ($ million)

5.5 Geography segment analysis 2020 - 2024

Historic Market Size - Geography Segment 2020 - 2024 ($ million)

5.6 Country segment analysis 2020 - 2024

Historic Market Size - Country Segment 2020 - 2024 ($ million)

6. Qualitative Analysis

6.1 Impact of AI on global mosquito repellent market

6.2 Impact of geopolitical conflicts on global mosquito repellent market

7. Five Forces Analysis

7.1 Five forces summary

Five forces analysis - Comparison between 2025 and 2030

7.2 Bargaining power of buyers

Bargaining power of buyers - Impact of key factors 2025 and 2030

7.3 Bargaining power of suppliers

Bargaining power of suppliers - Impact of key factors in 2025 and 2030

7.4 Threat of new entrants

Threat of new entrants - Impact of key factors in 2025 and 2030

7.5 Threat of substitutes

Threat of substitutes - Impact of key factors in 2025 and 2030

7.6 Threat of rivalry

Threat of rivalry - Impact of key factors in 2025 and 2030

7.7 Market condition

Chart on Market condition - Five forces 2025 and 2030

8. Market Segmentation by Distribution Channel

8.1 Market segments

Chart on Distribution Channel - Market share 2025-2030 (%)
Data Table on Distribution Channel - Market share 2025-2030 (%)

8.2 Comparison by Distribution Channel

Chart on Comparison by Distribution Channel
Data Table on Comparison by Distribution Channel

8.3 Offline - Market size and forecast 2025-2030

Chart on Offline - Market size and forecast 2025-2030 ($ million)
Data Table on Offline - Market size and forecast 2025-2030 ($ million)
Chart on Offline - Year-over-year growth 2025-2030 (%)
Data Table on Offline - Year-over-year growth 2025-2030 (%)

8.4 Online - Market size and forecast 2025-2030

Chart on Online - Market size and forecast 2025-2030 ($ million)
Data Table on Online - Market size and forecast 2025-2030 ($ million)
Chart on Online - Year-over-year growth 2025-2030 (%)
Data Table on Online - Year-over-year growth 2025-2030 (%)

8.5 Market opportunity by Distribution Channel

Market opportunity by Distribution Channel ($ million)
Data Table on Market opportunity by Distribution Channel ($ million)

9. Market Segmentation by Product

9.1 Market segments

Chart on Product - Market share 2025-2030 (%)
Data Table on Product - Market share 2025-2030 (%)

9.2 Comparison by Product

Chart on Comparison by Product
Data Table on Comparison by Product

9.3 Self-applicable - Market size and forecast 2025-2030

Chart on Self-applicable - Market size and forecast 2025-2030 ($ million)
Data Table on Self-applicable - Market size and forecast 2025-2030 ($ million)
Chart on Self-applicable - Year-over-year growth 2025-2030 (%)
Data Table on Self-applicable - Year-over-year growth 2025-2030 (%)

9.4 Ultrasound repellent device - Market size and forecast 2025-2030

Chart on Ultrasound repellent device - Market size and forecast 2025-2030 ($ million)
Data Table on Ultrasound repellent device - Market size and forecast 2025-2030 ($ million)
Chart on Ultrasound repellent device - Year-over-year growth 2025-2030 (%)
Data Table on Ultrasound repellent device - Year-over-year growth 2025-2030 (%)

9.5 Others - Market size and forecast 2025-2030

Chart on Others - Market size and forecast 2025-2030 ($ million)
Data Table on Others - Market size and forecast 2025-2030 ($ million)
Chart on Others - Year-over-year growth 2025-2030 (%)
Data Table on Others - Year-over-year growth 2025-2030 (%)

9.6 Market opportunity by Product

Market opportunity by Product ($ million)
Data Table on Market opportunity by Product ($ million)

10. Market Segmentation by Type

10.1 Market segments

Chart on Type - Market share 2025-2030 (%)
Data Table on Type - Market share 2025-2030 (%)

10.2 Comparison by Type

Chart on Comparison by Type
Data Table on Comparison by Type

10.3 Chemically derived repellents - Market size and forecast 2025-2030

Chart on Chemically derived repellents - Market size and forecast 2025-2030 ($ million)
Data Table on Chemically derived repellents - Market size and forecast 2025-2030 ($ million)
Chart on Chemically derived repellents - Year-over-year growth 2025-2030 (%)
Data Table on Chemically derived repellents - Year-over-year growth 2025-2030 (%)

10.4 Plant-based repellents - Market size and forecast 2025-2030

Chart on Plant-based repellents - Market size and forecast 2025-2030 ($ million)
Data Table on Plant-based repellents - Market size and forecast 2025-2030 ($ million)
Chart on Plant-based repellents - Year-over-year growth 2025-2030 (%)
Data Table on Plant-based repellents - Year-over-year growth 2025-2030 (%)

10.5 Market opportunity by Type

Market opportunity by Type ($ million)
Data Table on Market opportunity by Type ($ million)

11. Customer Landscape

11.1 Customer landscape overview

Analysis of price sensitivity, lifecycle, customer purchase basket, adoption rates, and purchase criteria

12. Geographic Landscape

12.1 Geographic segmentation

Chart on Market share by geography 2025-2030 (%)
Data Table on Market share by geography 2025-2030 (%)

12.2 Geographic comparison

Chart on Geographic comparison
Data Table on Geographic comparison

12.3 APAC - Market size and forecast 2025-2030

Chart on APAC - Market size and forecast 2025-2030 ($ million)
Data Table on APAC - Market size and forecast 2025-2030 ($ million)
Chart on APAC - Year-over-year growth 2025-2030 (%)
Data Table on APAC - Year-over-year growth 2025-2030 (%)
Chart on Regional Comparison - APAC
Data Table on Regional Comparison - APAC

12.3.1 China - Market size and forecast 2025-2030

Chart on China - Market size and forecast 2025-2030 ($ million)
Data Table on China - Market size and forecast 2025-2030 ($ million)
Chart on China - Year-over-year growth 2025-2030 (%)
Data Table on China - Year-over-year growth 2025-2030 (%)

12.3.2 India - Market size and forecast 2025-2030

Chart on India - Market size and forecast 2025-2030 ($ million)
Data Table on India - Market size and forecast 2025-2030 ($ million)
Chart on India - Year-over-year growth 2025-2030 (%)
Data Table on India - Year-over-year growth 2025-2030 (%)

12.3.3 Japan - Market size and forecast 2025-2030

Chart on Japan - Market size and forecast 2025-2030 ($ million)
Data Table on Japan - Market size and forecast 2025-2030 ($ million)
Chart on Japan - Year-over-year growth 2025-2030 (%)
Data Table on Japan - Year-over-year growth 2025-2030 (%)

12.3.4 Indonesia - Market size and forecast 2025-2030

Chart on Indonesia - Market size and forecast 2025-2030 ($ million)
Data Table on Indonesia - Market size and forecast 2025-2030 ($ million)
Chart on Indonesia - Year-over-year growth 2025-2030 (%)
Data Table on Indonesia - Year-over-year growth 2025-2030 (%)

12.3.5 South Korea - Market size and forecast 2025-2030

Chart on South Korea - Market size and forecast 2025-2030 ($ million)
Data Table on South Korea - Market size and forecast 2025-2030 ($ million)
Chart on South Korea - Year-over-year growth 2025-2030 (%)
Data Table on South Korea - Year-over-year growth 2025-2030 (%)

12.3.6 Australia - Market size and forecast 2025-2030

Chart on Australia - Market size and forecast 2025-2030 ($ million)
Data Table on Australia - Market size and forecast 2025-2030 ($ million)
Chart on Australia - Year-over-year growth 2025-2030 (%)
Data Table on Australia - Year-over-year growth 2025-2030 (%)

12.4 Europe - Market size and forecast 2025-2030

Chart on Europe - Market size and forecast 2025-2030 ($ million)
Data Table on Europe - Market size and forecast 2025-2030 ($ million)
Chart on Europe - Year-over-year growth 2025-2030 (%)
Data Table on Europe - Year-over-year growth 2025-2030 (%)
Chart on Regional Comparison - Europe
Data Table on Regional Comparison - Europe

12.4.1 Germany - Market size and forecast 2025-2030

Chart on Germany - Market size and forecast 2025-2030 ($ million)
Data Table on Germany - Market size and forecast 2025-2030 ($ million)
Chart on Germany - Year-over-year growth 2025-2030 (%)
Data Table on Germany - Year-over-year growth 2025-2030 (%)

12.4.2 UK - Market size and forecast 2025-2030

Chart on UK - Market size and forecast 2025-2030 ($ million)
Data Table on UK - Market size and forecast 2025-2030 ($ million)
Chart on UK - Year-over-year growth 2025-2030 (%)
Data Table on UK - Year-over-year growth 2025-2030 (%)

12.4.3 France - Market size and forecast 2025-2030

Chart on France - Market size and forecast 2025-2030 ($ million)
Data Table on France - Market size and forecast 2025-2030 ($ million)
Chart on France - Year-over-year growth 2025-2030 (%)
Data Table on France - Year-over-year growth 2025-2030 (%)

12.4.4 Italy - Market size and forecast 2025-2030

Chart on Italy - Market size and forecast 2025-2030 ($ million)
Data Table on Italy - Market size and forecast 2025-2030 ($ million)
Chart on Italy - Year-over-year growth 2025-2030 (%)
Data Table on Italy - Year-over-year growth 2025-2030 (%)

12.4.5 Spain - Market size and forecast 2025-2030

Chart on Spain - Market size and forecast 2025-2030 ($ million)
Data Table on Spain - Market size and forecast 2025-2030 ($ million)
Chart on Spain - Year-over-year growth 2025-2030 (%)
Data Table on Spain - Year-over-year growth 2025-2030 (%)

12.4.6 The Netherlands - Market size and forecast 2025-2030

Chart on The Netherlands - Market size and forecast 2025-2030 ($ million)
Data Table on The Netherlands - Market size and forecast 2025-2030 ($ million)
Chart on The Netherlands - Year-over-year growth 2025-2030 (%)
Data Table on The Netherlands - Year-over-year growth 2025-2030 (%)

12.5 North America - Market size and forecast 2025-2030

Chart on North America - Market size and forecast 2025-2030 ($ million)
Data Table on North America - Market size and forecast 2025-2030 ($ million)
Chart on North America - Year-over-year growth 2025-2030 (%)
Data Table on North America - Year-over-year growth 2025-2030 (%)
Chart on Regional Comparison - North America
Data Table on Regional Comparison - North America

12.5.1 US - Market size and forecast 2025-2030

Chart on US - Market size and forecast 2025-2030 ($ million)
Data Table on US - Market size and forecast 2025-2030 ($ million)
Chart on US - Year-over-year growth 2025-2030 (%)
Data Table on US - Year-over-year growth 2025-2030 (%)

12.5.2 Canada - Market size and forecast 2025-2030

Chart on Canada - Market size and forecast 2025-2030 ($ million)
Data Table on Canada - Market size and forecast 2025-2030 ($ million)
Chart on Canada - Year-over-year growth 2025-2030 (%)
Data Table on Canada - Year-over-year growth 2025-2030 (%)

12.5.3 Mexico - Market size and forecast 2025-2030

Chart on Mexico - Market size and forecast 2025-2030 ($ million)
Data Table on Mexico - Market size and forecast 2025-2030 ($ million)
Chart on Mexico - Year-over-year growth 2025-2030 (%)
Data Table on Mexico - Year-over-year growth 2025-2030 (%)

12.6 South America - Market size and forecast 2025-2030

Chart on South America - Market size and forecast 2025-2030 ($ million)
Data Table on South America - Market size and forecast 2025-2030 ($ million)
Chart on South America - Year-over-year growth 2025-2030 (%)
Data Table on South America - Year-over-year growth 2025-2030 (%)
Chart on Regional Comparison - South America
Data Table on Regional Comparison - South America

12.6.1 Brazil - Market size and forecast 2025-2030

Chart on Brazil - Market size and forecast 2025-2030 ($ million)
Data Table on Brazil - Market size and forecast 2025-2030 ($ million)
Chart on Brazil - Year-over-year growth 2025-2030 (%)
Data Table on Brazil - Year-over-year growth 2025-2030 (%)

12.6.2 Argentina - Market size and forecast 2025-2030

Chart on Argentina - Market size and forecast 2025-2030 ($ million)
Data Table on Argentina - Market size and forecast 2025-2030 ($ million)
Chart on Argentina - Year-over-year growth 2025-2030 (%)
Data Table on Argentina - Year-over-year growth 2025-2030 (%)

12.6.3 Chile - Market size and forecast 2025-2030

Chart on Chile - Market size and forecast 2025-2030 ($ million)
Data Table on Chile - Market size and forecast 2025-2030 ($ million)
Chart on Chile - Year-over-year growth 2025-2030 (%)
Data Table on Chile - Year-over-year growth 2025-2030 (%)

12.7 Middle East and Africa - Market size and forecast 2025-2030

Chart on Middle East and Africa - Market size and forecast 2025-2030 ($ million)
Data Table on Middle East and Africa - Market size and forecast 2025-2030 ($ million)
Chart on Middle East and Africa - Year-over-year growth 2025-2030 (%)
Data Table on Middle East and Africa - Year-over-year growth 2025-2030 (%)
Chart on Regional Comparison - Middle East and Africa
Data Table on Regional Comparison - Middle East and Africa

12.7.1 Saudi Arabia - Market size and forecast 2025-2030

Chart on Saudi Arabia - Market size and forecast 2025-2030 ($ million)
Data Table on Saudi Arabia - Market size and forecast 2025-2030 ($ million)
Chart on Saudi Arabia - Year-over-year growth 2025-2030 (%)
Data Table on Saudi Arabia - Year-over-year growth 2025-2030 (%)

12.7.2 South Africa - Market size and forecast 2025-2030

Chart on South Africa - Market size and forecast 2025-2030 ($ million)
Data Table on South Africa - Market size and forecast 2025-2030 ($ million)
Chart on South Africa - Year-over-year growth 2025-2030 (%)
Data Table on South Africa - Year-over-year growth 2025-2030 (%)

12.7.3 Turkey - Market size and forecast 2025-2030

Chart on Turkey - Market size and forecast 2025-2030 ($ million)
Data Table on Turkey - Market size and forecast 2025-2030 ($ million)
Chart on Turkey - Year-over-year growth 2025-2030 (%)
Data Table on Turkey - Year-over-year growth 2025-2030 (%)

12.7.4 UAE - Market size and forecast 2025-2030

Chart on UAE - Market size and forecast 2025-2030 ($ million)
Data Table on UAE - Market size and forecast 2025-2030 ($ million)
Chart on UAE - Year-over-year growth 2025-2030 (%)
Data Table on UAE - Year-over-year growth 2025-2030 (%)

12.7.5 Israel - Market size and forecast 2025-2030

Chart on Israel - Market size and forecast 2025-2030 ($ million)
Data Table on Israel - Market size and forecast 2025-2030 ($ million)
Chart on Israel - Year-over-year growth 2025-2030 (%)
Data Table on Israel - Year-over-year growth 2025-2030 (%)

12.8 Market opportunity by geography

Market opportunity by geography ($ million)
Data Tables on Market opportunity by geography ($ million)

13. Drivers, Challenges, and Opportunity

13.1 Market drivers

Rising global incidence of vector-borne diseases
Expanding urbanization and changing climatic conditions
Continuous product innovation and shift toward botanical formulations

13.2 Market challenges

Stringent regulatory approvals and toxicological scrutiny
Escalating vector resistance to conventional active ingredients
Proliferation of counterfeit formulations

13.3 Impact of drivers and challenges

Impact of drivers and challenges in 2025 and 2030

13.4 Market opportunities

Integration of smart home technologies and automated dispensing systems
Proliferation of direct-to-consumer subscription models and digital retail strategies
Escalating emphasis on sustainable packaging and zero-waste manufacturing protocols

14. Competitive Landscape

14.1 Overview

14.2

Overview on criticality of inputs and factors of differentiation

14.3 Landscape disruption

Overview on factors of disruption

14.4 Industry risks

Impact of key risks on business

15. Competitive Analysis

15.1 Companies profiled

Companies covered

15.2 Company ranking index

15.3 Market positioning of companies

Matrix on companies position and classification

15.4 3M Co.

3M Co. - Overview
3M Co. - Business segments
3M Co. - Key news
3M Co. - Key offerings
3M Co. - Segment focus
SWOT

15.5 Adventure Ready Brands

Adventure Ready Brands - Overview
Adventure Ready Brands - Product / Service
Adventure Ready Brands - Key offerings
SWOT

15.6 Bayer AG

Bayer AG - Overview
Bayer AG - Business segments
Bayer AG - Key offerings
Bayer AG - Segment focus
SWOT

15.7 Dabur India Ltd.

Dabur India Ltd. - Overview
Dabur India Ltd. - Business segments
Dabur India Ltd. - Key offerings
Dabur India Ltd. - Segment focus
SWOT

15.8 Earth Corp.

Earth Corp. - Overview
Earth Corp. - Product / Service
Earth Corp. - Key offerings
SWOT

15.9 Enesis Group

Enesis Group - Overview
Enesis Group - Product / Service
Enesis Group - Key offerings
SWOT

15.10 Fumakilla Limited

Fumakilla Limited - Overview
Fumakilla Limited - Product / Service
Fumakilla Limited - Key offerings
SWOT

15.11 Godrej Consumer Ltd.

Godrej Consumer Ltd. - Overview
Godrej Consumer Ltd. - Product / Service
Godrej Consumer Ltd. - Key offerings
SWOT

15.12 Jyothy Labs Ltd.

Jyothy Labs Ltd. - Overview
Jyothy Labs Ltd. - Product / Service
Jyothy Labs Ltd. - Key offerings
SWOT

15.13 Pigeon Corp.

Pigeon Corp. - Overview
Pigeon Corp. - Business segments
Pigeon Corp. - Key offerings
Pigeon Corp. - Segment focus
SWOT

15.14 Reckitt Benckiser Group Plc

Reckitt Benckiser Group Plc - Overview
Reckitt Benckiser Group Plc - Business segments
Reckitt Benckiser Group Plc - Key offerings
Reckitt Benckiser Group Plc - Segment focus
SWOT

15.15 Spectrum Brands Inc.

Spectrum Brands Inc. - Overview
Spectrum Brands Inc. - Product / Service
Spectrum Brands Inc. - Key offerings
SWOT

15.16 The Avon Co.

The Avon Co. - Overview
The Avon Co. - Product / Service
The Avon Co. - Key offerings
SWOT

15.17 The Himalaya Drug Co.

The Himalaya Drug Co. - Overview
The Himalaya Drug Co. - Product / Service
The Himalaya Drug Co. - Key offerings
SWOT

15.18 W.S. Badger Co.

W.S. Badger Co. - Overview
W.S. Badger Co. - Product / Service
W.S. Badger Co. - Key offerings
SWOT

16. Appendix

16.1 Scope of the report

Market definition
Objectives
Notes and caveats

16.2 Inclusions and exclusions checklist

Inclusions checklist
Exclusions checklist

16.3 Currency conversion rates for US$

16.4 Research methodology

16.5 Data procurement

Information sources

16.6 Data validation

16.7 Validation techniques employed for market sizing

16.8 Data synthesis

16.9 360 degree market analysis

16.10 List of abbreviations

Research Methodology

Technavio presents a detailed picture of the market by way of study, synthesis, and summation of data from multiple sources. The analysts have presented the various facets of the market with a particular focus on identifying the key industry influencers. The data thus presented is comprehensive, reliable, and the result of extensive research, both primary and secondary.

INFORMATION SOURCES

Primary sources

  • Manufacturers and suppliers
  • Channel partners
  • Industry experts
  • Strategic decision makers

Secondary sources

  • Industry journals and periodicals
  • Government data
  • Financial reports of key industry players
  • Historical data
  • Press releases

DATA ANALYSIS

Data Synthesis

  • Collation of data
  • Estimation of key figures
  • Analysis of derived insights

Data Validation

  • Triangulation with data models
  • Reference against proprietary databases
  • Corroboration with industry experts

REPORT WRITING

Qualitative

  • Market drivers
  • Market challenges
  • Market trends
  • Five forces analysis

Quantitative

  • Market size and forecast
  • Market segmentation
  • Geographical insights
  • Competitive landscape

Interested in this report?

Get your sample now to see our research methodology and insights!

Download Now

Frequently Asked Questions

Mosquito Repellent market growth will increase by USD 4977.7 million during 2026-2030.

The Mosquito Repellent market is expected to grow at a CAGR of 6.8% during 2026-2030.

Mosquito Repellent market is segmented by Distribution channel (Offline, Online) Product (Self-applicable, Ultrasound repellent device, Others) Type (Chemically derived repellents, Plant-based repellents)

3M Co., Adventure Ready Brands, Bayer AG, Dabur India Ltd., Dainihon Jochugiku Co. Ltd., Earth Corp., Enesis Group, Fumakilla Limited, Godrej Consumer Ltd., Jyothy Labs Ltd., Murphys Naturals Inc., Para Kito, PIC Corp., Pigeon Corp., Reckitt Benckiser Group Plc, S.C. Johnson and Son Inc., Sawyer Products Inc., Spectrum Brands Inc., The Avon Co., The Himalaya Drug Co., Thermacell Repellents Inc., W.S. Badger Co., Woodstream Corp. are a few of the key vendors in the Mosquito Repellent market.

APAC will register the highest growth rate of 61.3% among the other regions. Therefore, the Mosquito Repellent market in APAC is expected to garner significant business opportunities for the vendors during the forecast period.

China, India, Japan, Indonesia, South Korea, Australia, Germany, UK, France, Italy, Spain, The Netherlands, US, Canada, Mexico, Brazil, Argentina, Chile, Saudi Arabia, South Africa, Turkey, UAE, Israel

  • Rising global incidence of vector-borne diseases is the driving factor this market.

The Mosquito Repellent market vendors should focus on grabbing business opportunities from the Distribution channel segment as it accounted for the largest market share in the base year.
RIA - Research AI Assistant
Ask RIA
