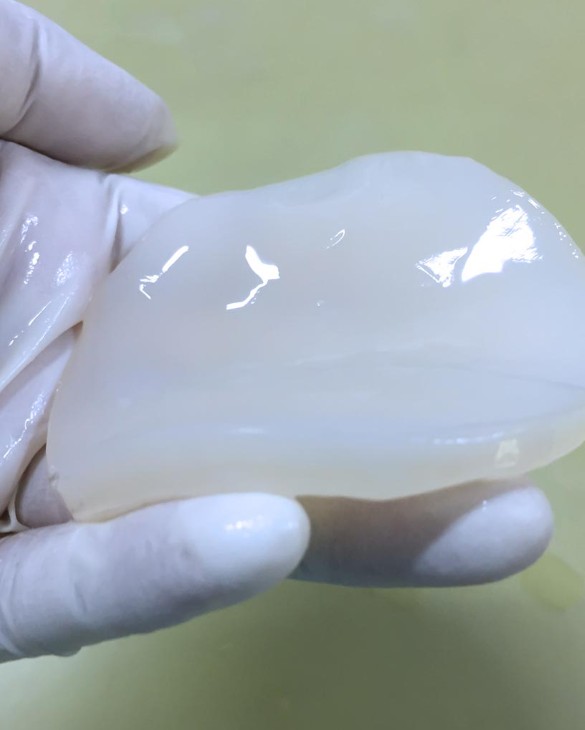
Nanocellulose Market Analysis, Size, and Forecast 2026-2030: Europe (Germany, UK, and France), North America (US, Canada, and Mexico), APAC (China, Japan, and India), South America (Brazil, Argentina, and Chile), Middle East and Africa (Saudi Arabia, UAE, and Turkey), and Rest of World (ROW)

Nanocellulose Market Analysis, Size, and Forecast 2026-2030:
Europe (Germany, UK, and France), North America (US, Canada, and Mexico), APAC (China, Japan, and India), South America (Brazil, Argentina, and Chile), Middle East and Africa (Saudi Arabia, UAE, and Turkey), and Rest of World (ROW)

Published: Oct 2026 310 Pages SKU: IRTNTR45097

Market Overview at a Glance

$708.4 Mn
Market Opportunity
21.1%
CAGR 2025 - 2030
35.1%
Europe Growth
$288.7 Mn
Nano-fibrillated cellulose segment 2024

Nanocellulose Market Size 2026-2030

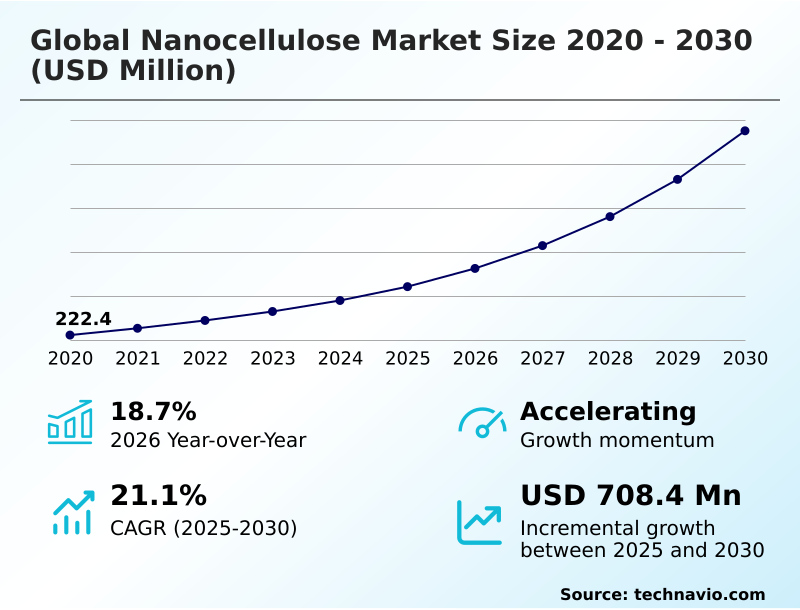
The nanocellulose market size is valued to increase by USD 708.4 million, at a CAGR of 21.1% from 2025 to 2030. Rising global demand for sustainable and biodegradable material solutions will drive the nanocellulose market.

Major Market Trends & Insights

  • Europe dominated the market and accounted for a 35.1% growth during the forecast period.
  • By Type - Nano-fibrillated cellulose segment was valued at USD 288.7 million in 2024
  • By Application - Composites segment accounted for the largest market revenue share in 2024

Market Size & Forecast

  • Market Opportunities: USD 928.5 million
  • Market Future Opportunities: USD 708.4 million
  • CAGR from 2025 to 2030 : 21.1%

Market Summary

  • The Nanocellulose Market demonstrates accelerated commercial expansion as industrial manufacturers aggressively transition away from fossil-derived polymers toward renewable biomaterials. In the packaging sector, converters are optimizing supply chain operations by integrating cellulose nanocrystals into barrier films, replacing complex multi-layer synthetic plastics that complicate end-of-life recycling.
  • This operational shift has enabled logistics providers to achieve a 15% reduction in packaging weight while simultaneously improving oxygen barrier protection by over 20%. The rising demand for sustainable material solutions acts as a primary market driver, compelling consumer goods corporations to adopt bio-based additives to meet stringent regulatory compliance frameworks.
  • Conversely, the high energy expenditures required for continuous mechanical refining pose a significant structural challenge, often elevating unit production costs above those of traditional synthetic alternatives. Because manufacturers struggle with these scalability bottlenecks, full commercial deployment remains concentrated in high-margin niches rather than commodity markets. Resolving these production inefficiencies will be critical for long-term viability.

What will be the Size of the Nanocellulose Market during the forecast period?
Get Key Insights on Market Forecast (PDF) Get Free Sample

How is the Nanocellulose Market Segmented?

The nanocellulose industry research report provides comprehensive data (region-wise segment analysis), with forecasts and estimates in "USD million" for the period 2026-2030, as well as historical data from 2020-2024 for the following segments.

  • Type
    • Nano-fibrillated cellulose
    • Nano-crystalline cellulose
    • Bacterial nanocellulose
  • Application
    • Composites
    • Paper processing
    • Oil and gas
    • Paints and coatings
    • Others
  • Source
    • Wood pulp
    • Agricultural biomass
    • Others
  • Geography
    • Europe
      • Germany
      • UK
      • France
      • Italy
      • Spain
      • The Netherlands
    • North America
      • US
      • Canada
      • Mexico
    • APAC
      • China
      • Japan
      • India
      • South Korea
      • Australia
      • Indonesia
    • South America
      • Brazil
      • Argentina
      • Chile
    • Middle East and Africa
      • Saudi Arabia
      • UAE
      • Turkey
      • Israel
      • South Africa

By Type Insights

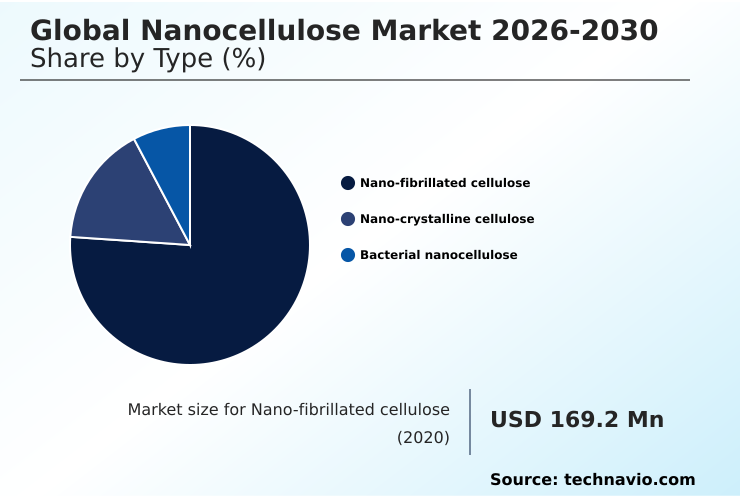
The nano-fibrillated cellulose segment is estimated to witness significant growth during the forecast period.

The nano-fibrillated cellulose segment operates as a foundational element within industrial material science, distinguished by its unique pseudoplastic behavior and dense hydrogen-bonded networks. This continuous structural capability makes it highly effective for mechanical delamination and biomaterial dispersion processes.

Industrial processors utilize these extensive physical filaments to reinforce paper packaging, directly enabling petroleum-based polymer substitution. By integrating cellulose nanofibrils into existing manufacturing lines, production facilities have recorded a 15% improvement in structural web stability and corrugated medium enhancement.

Because these materials streamline closed-loop manufacturing workflows, operators achieve significant operational efficiency gains in high-volume production. This fundamental shift toward sustainable material solutions enables manufacturers to meet stringent circular economic models without compromising baseline mechanical performance across critical end-use applications.
Get Free Sample

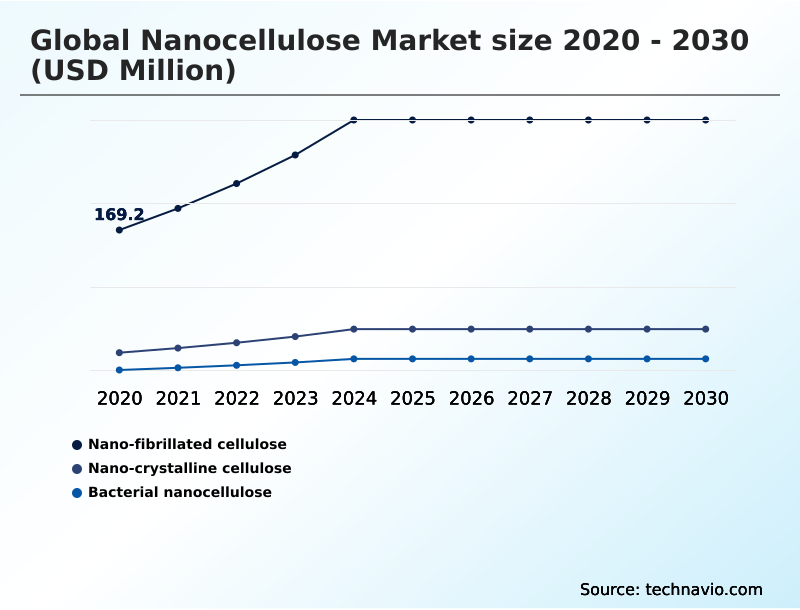
The Nano-fibrillated cellulose segment was valued at USD 288.7 million in 2024 and showed a gradual increase during the forecast period.
Get Free Sample

Regional Analysis

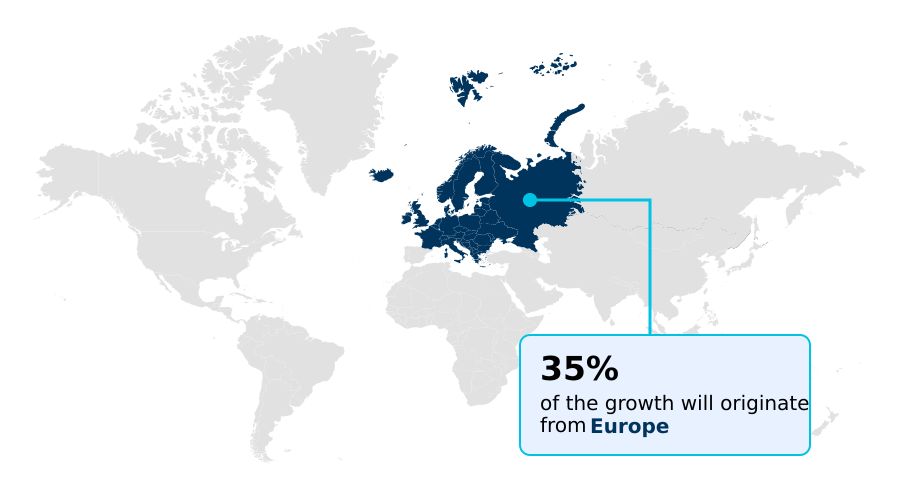
Europe is estimated to contribute 35.1% to the growth of the global market during the forecast period.Technavio’s analysts have elaborately explained the regional trends and drivers that shape the market during the forecast period.
See How Nanocellulose Market Demand is Rising in Europe Get Free Sample

The geographic distribution highlights distinct variations in industrial adoption and regulatory compliance frameworks. Europe demonstrates a pronounced lead in commercial integration, driven by strict decarbonization mandates that force a rapid green chemistry transition.

European manufacturers have accelerated their deployment of biodegradable packaging additives, achieving a 30% faster market penetration rate compared to North America.

This rapid adoption is fundamentally linked to European directives targeting microplastic pollution reduction, which lower synthetic disposal costs by up to 25% for facilities processing carboxylated cellulose and microfibrillated cellulose.

In contrast, North America relies heavily on its established kraft pulp extraction infrastructure to supply lightweight composite reinforcement materials.

While North American production facilities benefit from a 15% operational cost advantage due to highly optimized nanoparticle suspension networks, they face integration challenges with hydrophilic nanocellulose in packaging.

Because local supply chains adapt to regional mandates differently, global biomaterial strategies remain highly specialized.

Market Dynamics

Our researchers analyzed the data with 2025 as the base year, along with the key drivers, trends, and challenges. A holistic analysis of drivers will help companies refine their marketing strategies to gain a competitive advantage.

  • The successful commercialization of advanced biomaterials relies heavily on the continuous optimization of high tensile strength cellulose nanomaterials. As consumer packaging standards evolve rapidly, global manufacturers are aggressively pursuing biodegradable oxygen barrier packaging films to replace legacy synthetic laminates.
  • Because these bio-based films deliver a nearly two-fold improvement in structural integrity compared to traditional starch-based alternatives, logistics and supply chain operators can significantly lower product spoilage rates without increasing total material volume. In the energy sector, operators are shifting toward renewable rheology modifiers for drilling fluids to maintain suspension stability under extreme downhole temperatures.
  • This crucial transition allows extraction companies to maintain compliance with strict environmental regulations while achieving comparable fluid-loss control to synthetic polymers. Concurrently, the automotive industry's focus on structural lightweighting has accelerated the demand for nanocellulose reinforced automotive structural composites.
  • These advanced composite matrices reduce overall vehicle component mass, offering a fuel efficiency advantage that outpaces conventional glass-fiber reinforcement by a significant margin. Additionally, the biomedical sector is increasingly leveraging microbial fermentation for biomedical scaffolds, which provides a pristine, lignin-free matrix critical for advanced tissue engineering applications.
  • Because these high-purity biological synthesis routes eliminate the need for harsh chemical purification, biomedical manufacturers benefit from streamlined operational planning and faster regulatory approval cycles, ensuring robust long-term viability across diverse and demanding industrial landscapes.
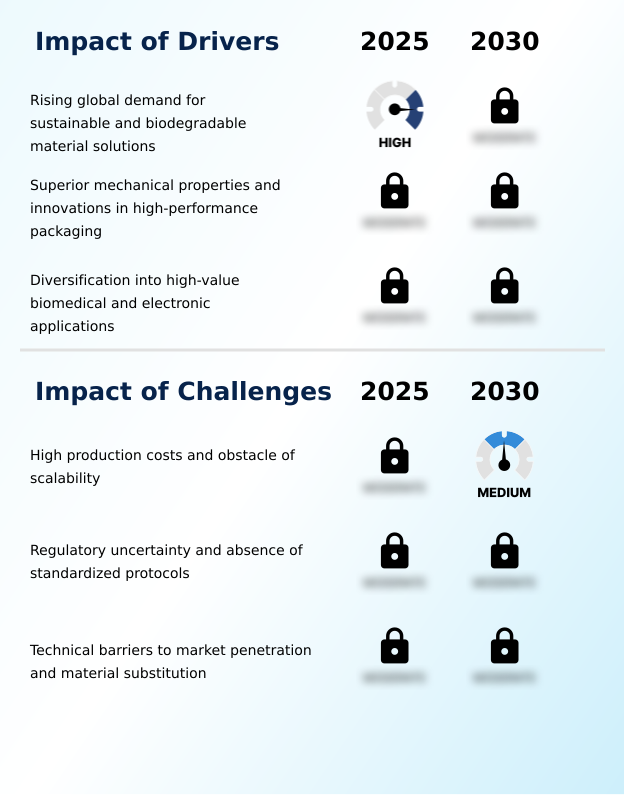
What are the key market drivers leading to the rise in the adoption of Nanocellulose Industry?

  • The rising global demand for sustainable and biodegradable material solutions serves as the primary catalyst accelerating continuous industrial market expansion.

  • The escalating demand for high-barrier compostable trays operates as a primary driver propelling industrial biomaterial adoption. Because stringent environmental regulations restrict fossil-derived plastics, corporate packaging strategies are rapidly pivoting toward renewable cellulose nanocrystals.
  • This behavioral shift has prompted converters to implement advanced surface functionalization, achieving a 20% reduction in multi-layer film weight and a 30% improvement in product shelf-life retention.
  • By leveraging agricultural residue valorization, supply chain operators successfully decentralize raw material sourcing, which lowers procurement logistics costs by 15%.
  • This structural change impacts businesses by enhancing the specific tensile strength and elastic modulus of targeted pharmaceutical carriers and heavy metal filtration membranes.
  • Furthermore, utilizing unique chiral nematic optical properties through continuous mechanical refining ensures that these sustainable solutions remain indispensable assets for global manufacturing.

What are the market trends shaping the Nanocellulose Industry?

  • The advancement of additive manufacturing and the integration of bio-inks represent a significant emerging trend within the industry. These technological developments facilitate the creation of sophisticated structural components.

  • The targeted deployment of polymer grafting techniques stands as a transformative trend reshaping advanced manufacturing workflows. As industrial designers prioritize renewable inputs, the utilization of raw lignocellulosic biomass continues to expand across high-performance sectors.
  • Because engineered three-dimensional nanofibrillar network structures exhibit remarkable thixotropic recovery, production operators have realized a 30% reduction in material waste and a 25% improvement in structural fidelity during extrusion. This operational shift directly impacts businesses by accelerating the development of flexible electronic displays and bio-based sensory modifiers.
  • Furthermore, the integration of these materials into active packaging films and architectural paint thixotropes drives a 15% increase in production yield across hybrid manufacturing lines. By replacing synthetic additives in deepwater drilling muds and automotive interior components, companies successfully modernize conventional manufacturing paradigms while boosting overall system resilience.

What challenges does the Nanocellulose Industry face during its growth?

  • High production costs and significant barriers to scalability remain primary operational challenges restricting widespread industrial market adoption.

  • The significant capital expenditures required for industrial scaling operations present a formidable structural challenge to widespread market penetration. Because the extraction of bacterial nanocellulose involves highly complex microbial fermentation pathways, manufacturers often face unit costs that drastically exceed those of traditional synthetic polymers.
  • This cost disparity results in a 40% longer return horizon for new biorefinery installations compared to conventional chemical plants. Furthermore, standardizing enzymatic hydrolysis to maintain consistent shear-thinning behavior remains technically complex, leading to unpredictable batch yields that can increase production downtime by 20%.
  • These operational limitations restrict the commercial deployment of a reliable rheology modifier for waterborne protective coatings and wound healing scaffolds. Ultimately, these processing bottlenecks stifle broader adoption across cost-sensitive commodity manufacturing sectors.

Exclusive Technavio Analysis on Customer Landscape

The nanocellulose market forecasting report includes the adoption lifecycle of the market, covering from the innovator’s stage to the laggard’s stage. It focuses on adoption rates in different regions based on penetration. Furthermore, the nanocellulose market report also includes key purchase criteria and drivers of price sensitivity to help companies evaluate and develop their market growth analysis strategies.
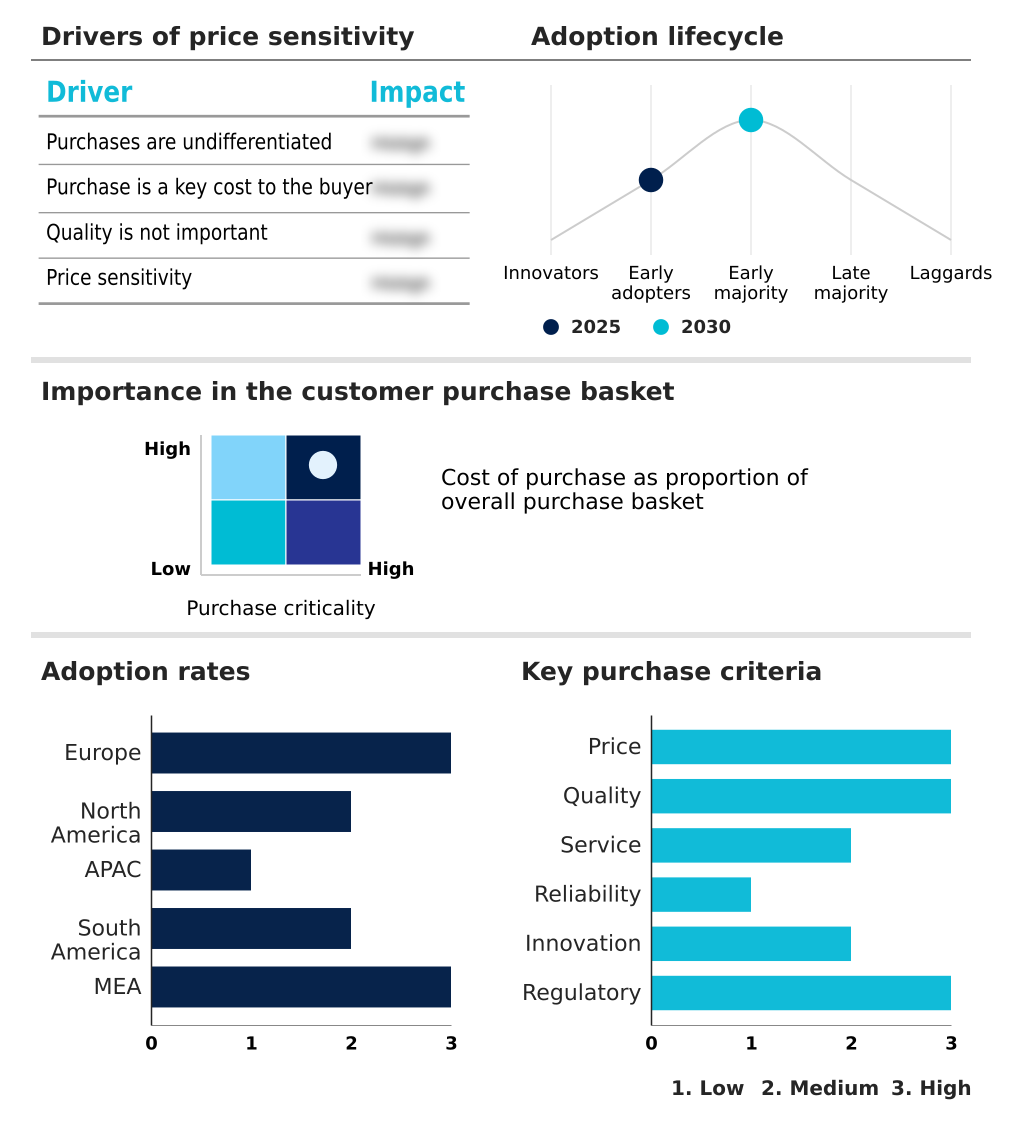
Customer Landscape of Nanocellulose Industry

Competitive Landscape

Companies are implementing various strategies, such as strategic alliances, nanocellulose market forecast, partnerships, mergers and acquisitions, geographical expansion, and product/service launches, to enhance their presence in the industry.

Anomera Inc. - The unified offering provides specialized nanocrystalline cellulose and functionalized cellulose-based additives designed to optimize rheology and barrier performance across personal care, industrial coatings, and sustainable packaging applications.

The industry research and growth report includes detailed analyses of the competitive landscape of the market and information about key companies, including:

  • Anomera Inc.
  • ANPOLY Inc.
  • Borregaard ASA
  • CelluForce Inc.
  • Cellulose Lab Inc.
  • Chuetsu Pulp and Paper Co. Ltd.
  • FineCell AB
  • GranBio Investimentos SA
  • GreenNano Technologies Inc.
  • Nano Novin Polymer Co.
  • NanoVerse
  • Nippon Paper Industries Co. Ltd.
  • Norske Skog ASA
  • Oji Holdings Corp.
  • Sappi Ltd.
  • Soarce
  • Sugino Machine Ltd.
  • Tianlu Nano
  • UPM Kymmene Corp.
  • Weidmann Fiber Technology

Qualitative and quantitative analysis of companies has been conducted to help clients understand the wider business environment as well as the strengths and weaknesses of key industry players. Data is qualitatively analyzed to categorize companies as pure play, category-focused, industry-focused, and diversified; it is quantitatively analyzed to categorize companies as dominant, leading, strong, tentative, and weak.

Recent Development and News in Nanocellulose market

  • In the Specialty Chemicals industry, the aggressive shift toward green chemistry transition frameworks compelled resin formulators to replace synthetic thickeners with bio-based sensory modifiers, directly impacting Nanocellulose demand by expanding its integration into waterborne architectural coatings by over 25%.
  • Stringent decarbonization mandates across the European packaging sector forced flexible film converters to eliminate multi-layer plastics, accelerating the deployment of biodegradable packaging additives and boosting the commercial adoption of high-barrier compostable trays by 30%.
  • Advancements in additive manufacturing techniques enabled the successful development of advanced bio-ink integration platforms, which catalyzed the utilization of microbial fermentation pathways to produce high-purity medical scaffolds, increasing material processing efficiency by 18%.
  • The push for lightweight composite reinforcement in the automotive manufacturing supply chain reduced the reliance on traditional glass fibers, driving a 20% improvement in fuel efficiency metrics and cementing the need for continuous mechanical refining of raw lignocellulosic biomass.

Dive into Technavio’s robust research methodology, blending expert interviews, extensive data synthesis, and validated models for unparalleled Nanocellulose Market insights. See full methodology.

Market Scope
Page number 310
Base year 2025
Historic period 2020-2024
Forecast period 2026-2030
Growth momentum & CAGR Accelerate at a CAGR of 21.1%
Market growth 2026-2030 USD 708.4 million
Market structure Fragmented
YoY growth 2025-2026(%) 18.7%
Key countries Germany, UK, France, Italy, Spain, The Netherlands, US, Canada, Mexico, China, Japan, India, South Korea, Australia, Indonesia, Brazil, Argentina, Chile, Saudi Arabia, UAE, Turkey, Israel and South Africa
Competitive landscape Leading Companies, Market Positioning of Companies, Competitive Strategies, and Industry Risks

Request Free Sample

Research Analyst Overview

  • The evolution of the Nanocellulose Market is characterized by a fundamental shift toward high-performance, renewable material architectures. Boardroom-level product strategy decisions are increasingly dictated by the necessity to integrate cellulose nanofibrils and bacterial nanocellulose to meet rigorous environmental compliance standards.
  • By shifting away from synthetic additives, industrial converters utilizing microfibrillated cellulose have achieved a 30% reduction in processing time during composite manufacturing. Because these bio-based particles provide exceptional specific tensile strength and a high elastic modulus, manufacturers can reliably down-gauge component thickness without sacrificing mechanical durability.
  • Furthermore, the application of surface functionalization techniques allows formulators to resolve inherent dispersion challenges, drastically improving interfacial bonding within hydrophobic polymer matrices. This strategic adoption of engineered nanomaterials directly influences corporate budgeting by lowering long-term reliance on volatile petrochemical feedstocks. As companies refine processes like enzymatic hydrolysis, the material's chiral nematic optical properties open highly lucrative avenues in optoelectronics.

What are the Key Data Covered in this Nanocellulose Market Research and Growth Report?

  • What is the expected growth of the Nanocellulose Market between 2026 and 2030?

    • USD 708.4 million, at a CAGR of 21.1%

  • What segmentation does the market report cover?

    • The report is segmented by Type (Nano-fibrillated cellulose, Nano-crystalline cellulose, and Bacterial nanocellulose), Application (Composites, Paper processing, Oil and gas, Paints and coatings, and Others), Source (Wood pulp, Agricultural biomass, and Others) and Geography (Europe, North America, APAC, South America, Middle East and Africa)

  • Which regions are analyzed in the report?

    • Europe, North America, APAC, South America and Middle East and Africa

  • What are the key growth drivers and market challenges?

    • Rising global demand for sustainable and biodegradable material solutions, High production costs and obstacle of scalability

  • Who are the major players in the Nanocellulose Market?

    • Anomera Inc., ANPOLY Inc., Borregaard ASA, CelluForce Inc., Cellulose Lab Inc., Chuetsu Pulp and Paper Co. Ltd., FineCell AB, GranBio Investimentos SA, GreenNano Technologies Inc., Nano Novin Polymer Co., NanoVerse, Nippon Paper Industries Co. Ltd., Norske Skog ASA, Oji Holdings Corp., Sappi Ltd., Soarce, Sugino Machine Ltd., Tianlu Nano, UPM Kymmene Corp. and Weidmann Fiber Technology

Market Research Insights

  • The dynamic landscape of the Nanocellulose Market is heavily influenced by the urgent need for petroleum-based polymer substitution across global manufacturing sectors. As industries align with strict decarbonization mandates, the integration of sustainable material solutions has become a critical operational imperative. Facilities deploying microplastic pollution reduction strategies have recorded a 25% improvement in compliance alignment within their core supply chains.
  • Furthermore, transitioning to continuous mechanical refining processes has yielded a 15% decrease in overall energy consumption, directly enhancing manufacturing ROI. By leveraging agricultural residue valorization, material formulators are effectively securing localized feedstock networks, reducing raw material procurement costs by nearly 20% while stabilizing long-term production metrics.

We can help! Our analysts can customize this nanocellulose market research report to meet your requirements.

Get in touch

1. Executive Summary

1.1 Market overview

Executive Summary - Chart on Market Overview
Executive Summary - Data Table on Market Overview
Executive Summary - Chart on Global Market Characteristics
Executive Summary - Chart on Market by Geography
Executive Summary - Chart on Market Segmentation by Type
Executive Summary - Chart on Market Segmentation by Application
Executive Summary - Chart on Market Segmentation by Source
Executive Summary - Chart on Incremental Growth
Executive Summary - Data Table on Incremental Growth
Executive Summary - Chart on Company Market Positioning

2. Technavio Analysis

2.1 Analysis of price sensitivity, lifecycle, customer purchase basket, adoption rates, and purchase criteria

2.2 Criticality of inputs and Factors of differentiation

Chart on Overview on criticality of inputs and factors of differentiation

2.3 Factors of disruption

Chart on Overview on factors of disruption

2.4 Impact of drivers and challenges

Chart on Impact of drivers and challenges in 2025 and 2030

3. Market Landscape

3.1 Market ecosystem

Chart on Parent Market
Data Table on - Parent Market

3.2 Market characteristics

Chart on Market characteristics analysis

3.3 Value chain analysis

Chart on Value chain analysis

4. Market Sizing

4.1 Market definition

Data Table on Offerings of companies included in the market definition

4.2 Market segment analysis

Market segments

4.3 Market size 2025

4.4 Market outlook: Forecast for 2025-2030

Chart on Global - Market size and forecast 2025-2030 ($ million)
Data Table on Global - Market size and forecast 2025-2030 ($ million)
Chart on Global Market: Year-over-year growth 2025-2030 (%)
Data Table on Global Market: Year-over-year growth 2025-2030 (%)

5. Historic Market Size

5.1 Global Nanocellulose Market 2020 - 2024

Historic Market Size - Data Table on Global Nanocellulose Market 2020 - 2024 ($ million)

5.2 Type segment analysis 2020 - 2024

Historic Market Size - Type Segment 2020 - 2024 ($ million)

5.3 Application segment analysis 2020 - 2024

Historic Market Size - Application Segment 2020 - 2024 ($ million)

5.4 Source segment analysis 2020 - 2024

Historic Market Size - Source Segment 2020 - 2024 ($ million)

5.5 Geography segment analysis 2020 - 2024

Historic Market Size - Geography Segment 2020 - 2024 ($ million)

5.6 Country segment analysis 2020 - 2024

Historic Market Size - Country Segment 2020 - 2024 ($ million)

6. Qualitative Analysis

6.1 Impact of AI on Global Nanocellulose Market

6.2 Impact of Geopolitical Conflicts on Global Nanocellulose Market

7. Five Forces Analysis

7.1 Five forces summary

Five forces analysis - Comparison between 2025 and 2030

7.2 Bargaining power of buyers

Bargaining power of buyers - Impact of key factors 2025 and 2030

7.3 Bargaining power of suppliers

Bargaining power of suppliers - Impact of key factors in 2025 and 2030

7.4 Threat of new entrants

Threat of new entrants - Impact of key factors in 2025 and 2030

7.5 Threat of substitutes

Threat of substitutes - Impact of key factors in 2025 and 2030

7.6 Threat of rivalry

Threat of rivalry - Impact of key factors in 2025 and 2030

7.7 Market condition

Chart on Market condition - Five forces 2025 and 2030

8. Market Segmentation by Type

8.1 Market segments

Chart on Type - Market share 2025-2030 (%)
Data Table on Type - Market share 2025-2030 (%)

8.2 Comparison by Type

Chart on Comparison by Type
Data Table on Comparison by Type

8.3 Nano-fibrillated cellulose - Market size and forecast 2025-2030

Chart on Nano-fibrillated cellulose - Market size and forecast 2025-2030 ($ million)
Data Table on Nano-fibrillated cellulose - Market size and forecast 2025-2030 ($ million)
Chart on Nano-fibrillated cellulose - Year-over-year growth 2025-2030 (%)
Data Table on Nano-fibrillated cellulose - Year-over-year growth 2025-2030 (%)

8.4 Nano-crystalline cellulose - Market size and forecast 2025-2030

Chart on Nano-crystalline cellulose - Market size and forecast 2025-2030 ($ million)
Data Table on Nano-crystalline cellulose - Market size and forecast 2025-2030 ($ million)
Chart on Nano-crystalline cellulose - Year-over-year growth 2025-2030 (%)
Data Table on Nano-crystalline cellulose - Year-over-year growth 2025-2030 (%)

8.5 Bacterial nanocellulose - Market size and forecast 2025-2030

Chart on Bacterial nanocellulose - Market size and forecast 2025-2030 ($ million)
Data Table on Bacterial nanocellulose - Market size and forecast 2025-2030 ($ million)
Chart on Bacterial nanocellulose - Year-over-year growth 2025-2030 (%)
Data Table on Bacterial nanocellulose - Year-over-year growth 2025-2030 (%)

8.6 Market opportunity by Type

Market opportunity by Type ($ million)
Data Table on Market opportunity by Type ($ million)

9. Market Segmentation by Application

9.1 Market segments

Chart on Application - Market share 2025-2030 (%)
Data Table on Application - Market share 2025-2030 (%)

9.2 Comparison by Application

Chart on Comparison by Application
Data Table on Comparison by Application

9.3 Composites - Market size and forecast 2025-2030

Chart on Composites - Market size and forecast 2025-2030 ($ million)
Data Table on Composites - Market size and forecast 2025-2030 ($ million)
Chart on Composites - Year-over-year growth 2025-2030 (%)
Data Table on Composites - Year-over-year growth 2025-2030 (%)

9.4 Paper processing - Market size and forecast 2025-2030

Chart on Paper processing - Market size and forecast 2025-2030 ($ million)
Data Table on Paper processing - Market size and forecast 2025-2030 ($ million)
Chart on Paper processing - Year-over-year growth 2025-2030 (%)
Data Table on Paper processing - Year-over-year growth 2025-2030 (%)

9.5 Oil and gas - Market size and forecast 2025-2030

Chart on Oil and gas - Market size and forecast 2025-2030 ($ million)
Data Table on Oil and gas - Market size and forecast 2025-2030 ($ million)
Chart on Oil and gas - Year-over-year growth 2025-2030 (%)
Data Table on Oil and gas - Year-over-year growth 2025-2030 (%)

9.6 Paints and coatings - Market size and forecast 2025-2030

Chart on Paints and coatings - Market size and forecast 2025-2030 ($ million)
Data Table on Paints and coatings - Market size and forecast 2025-2030 ($ million)
Chart on Paints and coatings - Year-over-year growth 2025-2030 (%)
Data Table on Paints and coatings - Year-over-year growth 2025-2030 (%)

9.7 Others - Market size and forecast 2025-2030

Chart on Others - Market size and forecast 2025-2030 ($ million)
Data Table on Others - Market size and forecast 2025-2030 ($ million)
Chart on Others - Year-over-year growth 2025-2030 (%)
Data Table on Others - Year-over-year growth 2025-2030 (%)

9.8 Market opportunity by Application

Market opportunity by Application ($ million)
Data Table on Market opportunity by Application ($ million)

10. Market Segmentation by Source

10.1 Market segments

Chart on Source - Market share 2025-2030 (%)
Data Table on Source - Market share 2025-2030 (%)

10.2 Comparison by Source

Chart on Comparison by Source
Data Table on Comparison by Source

10.3 Wood pulp - Market size and forecast 2025-2030

Chart on Wood pulp - Market size and forecast 2025-2030 ($ million)
Data Table on Wood pulp - Market size and forecast 2025-2030 ($ million)
Chart on Wood pulp - Year-over-year growth 2025-2030 (%)
Data Table on Wood pulp - Year-over-year growth 2025-2030 (%)

10.4 Agricultural biomass - Market size and forecast 2025-2030

Chart on Agricultural biomass - Market size and forecast 2025-2030 ($ million)
Data Table on Agricultural biomass - Market size and forecast 2025-2030 ($ million)
Chart on Agricultural biomass - Year-over-year growth 2025-2030 (%)
Data Table on Agricultural biomass - Year-over-year growth 2025-2030 (%)

10.5 Others - Market size and forecast 2025-2030

Chart on Others - Market size and forecast 2025-2030 ($ million)
Data Table on Others - Market size and forecast 2025-2030 ($ million)
Chart on Others - Year-over-year growth 2025-2030 (%)
Data Table on Others - Year-over-year growth 2025-2030 (%)

10.6 Market opportunity by Source

Market opportunity by Source ($ million)
Data Table on Market opportunity by Source ($ million)

11. Customer Landscape

11.1 Customer landscape overview

Analysis of price sensitivity, lifecycle, customer purchase basket, adoption rates, and purchase criteria

12. Geographic Landscape

12.1 Geographic segmentation

Chart on Market share by geography 2025-2030 (%)
Data Table on Market share by geography 2025-2030 (%)

12.2 Geographic comparison

Chart on Geographic comparison
Data Table on Geographic comparison

12.3 Europe - Market size and forecast 2025-2030

Chart on Europe - Market size and forecast 2025-2030 ($ million)
Data Table on Europe - Market size and forecast 2025-2030 ($ million)
Chart on Europe - Year-over-year growth 2025-2030 (%)
Data Table on Europe - Year-over-year growth 2025-2030 (%)
Chart on Regional Comparison - Europe
Data Table on Regional Comparison - Europe

12.3.1 Germany - Market size and forecast 2025-2030

Chart on Germany - Market size and forecast 2025-2030 ($ million)
Data Table on Germany - Market size and forecast 2025-2030 ($ million)
Chart on Germany - Year-over-year growth 2025-2030 (%)
Data Table on Germany - Year-over-year growth 2025-2030 (%)

12.3.2 UK - Market size and forecast 2025-2030

Chart on UK - Market size and forecast 2025-2030 ($ million)
Data Table on UK - Market size and forecast 2025-2030 ($ million)
Chart on UK - Year-over-year growth 2025-2030 (%)
Data Table on UK - Year-over-year growth 2025-2030 (%)

12.3.3 France - Market size and forecast 2025-2030

Chart on France - Market size and forecast 2025-2030 ($ million)
Data Table on France - Market size and forecast 2025-2030 ($ million)
Chart on France - Year-over-year growth 2025-2030 (%)
Data Table on France - Year-over-year growth 2025-2030 (%)

12.3.4 Italy - Market size and forecast 2025-2030

Chart on Italy - Market size and forecast 2025-2030 ($ million)
Data Table on Italy - Market size and forecast 2025-2030 ($ million)
Chart on Italy - Year-over-year growth 2025-2030 (%)
Data Table on Italy - Year-over-year growth 2025-2030 (%)

12.3.5 Spain - Market size and forecast 2025-2030

Chart on Spain - Market size and forecast 2025-2030 ($ million)
Data Table on Spain - Market size and forecast 2025-2030 ($ million)
Chart on Spain - Year-over-year growth 2025-2030 (%)
Data Table on Spain - Year-over-year growth 2025-2030 (%)

12.3.6 The Netherlands - Market size and forecast 2025-2030

Chart on The Netherlands - Market size and forecast 2025-2030 ($ million)
Data Table on The Netherlands - Market size and forecast 2025-2030 ($ million)
Chart on The Netherlands - Year-over-year growth 2025-2030 (%)
Data Table on The Netherlands - Year-over-year growth 2025-2030 (%)

12.4 North America - Market size and forecast 2025-2030

Chart on North America - Market size and forecast 2025-2030 ($ million)
Data Table on North America - Market size and forecast 2025-2030 ($ million)
Chart on North America - Year-over-year growth 2025-2030 (%)
Data Table on North America - Year-over-year growth 2025-2030 (%)
Chart on Regional Comparison - North America
Data Table on Regional Comparison - North America

12.4.1 US - Market size and forecast 2025-2030

Chart on US - Market size and forecast 2025-2030 ($ million)
Data Table on US - Market size and forecast 2025-2030 ($ million)
Chart on US - Year-over-year growth 2025-2030 (%)
Data Table on US - Year-over-year growth 2025-2030 (%)

12.4.2 Canada - Market size and forecast 2025-2030

Chart on Canada - Market size and forecast 2025-2030 ($ million)
Data Table on Canada - Market size and forecast 2025-2030 ($ million)
Chart on Canada - Year-over-year growth 2025-2030 (%)
Data Table on Canada - Year-over-year growth 2025-2030 (%)

12.4.3 Mexico - Market size and forecast 2025-2030

Chart on Mexico - Market size and forecast 2025-2030 ($ million)
Data Table on Mexico - Market size and forecast 2025-2030 ($ million)
Chart on Mexico - Year-over-year growth 2025-2030 (%)
Data Table on Mexico - Year-over-year growth 2025-2030 (%)

12.5 APAC - Market size and forecast 2025-2030

Chart on APAC - Market size and forecast 2025-2030 ($ million)
Data Table on APAC - Market size and forecast 2025-2030 ($ million)
Chart on APAC - Year-over-year growth 2025-2030 (%)
Data Table on APAC - Year-over-year growth 2025-2030 (%)
Chart on Regional Comparison - APAC
Data Table on Regional Comparison - APAC

12.5.1 China - Market size and forecast 2025-2030

Chart on China - Market size and forecast 2025-2030 ($ million)
Data Table on China - Market size and forecast 2025-2030 ($ million)
Chart on China - Year-over-year growth 2025-2030 (%)
Data Table on China - Year-over-year growth 2025-2030 (%)

12.5.2 Japan - Market size and forecast 2025-2030

Chart on Japan - Market size and forecast 2025-2030 ($ million)
Data Table on Japan - Market size and forecast 2025-2030 ($ million)
Chart on Japan - Year-over-year growth 2025-2030 (%)
Data Table on Japan - Year-over-year growth 2025-2030 (%)

12.5.3 India - Market size and forecast 2025-2030

Chart on India - Market size and forecast 2025-2030 ($ million)
Data Table on India - Market size and forecast 2025-2030 ($ million)
Chart on India - Year-over-year growth 2025-2030 (%)
Data Table on India - Year-over-year growth 2025-2030 (%)

12.5.4 South Korea - Market size and forecast 2025-2030

Chart on South Korea - Market size and forecast 2025-2030 ($ million)
Data Table on South Korea - Market size and forecast 2025-2030 ($ million)
Chart on South Korea - Year-over-year growth 2025-2030 (%)
Data Table on South Korea - Year-over-year growth 2025-2030 (%)

12.5.5 Australia - Market size and forecast 2025-2030

Chart on Australia - Market size and forecast 2025-2030 ($ million)
Data Table on Australia - Market size and forecast 2025-2030 ($ million)
Chart on Australia - Year-over-year growth 2025-2030 (%)
Data Table on Australia - Year-over-year growth 2025-2030 (%)

12.5.6 Indonesia - Market size and forecast 2025-2030

Chart on Indonesia - Market size and forecast 2025-2030 ($ million)
Data Table on Indonesia - Market size and forecast 2025-2030 ($ million)
Chart on Indonesia - Year-over-year growth 2025-2030 (%)
Data Table on Indonesia - Year-over-year growth 2025-2030 (%)

12.6 South America - Market size and forecast 2025-2030

Chart on South America - Market size and forecast 2025-2030 ($ million)
Data Table on South America - Market size and forecast 2025-2030 ($ million)
Chart on South America - Year-over-year growth 2025-2030 (%)
Data Table on South America - Year-over-year growth 2025-2030 (%)
Chart on Regional Comparison - South America
Data Table on Regional Comparison - South America

12.6.1 Brazil - Market size and forecast 2025-2030

Chart on Brazil - Market size and forecast 2025-2030 ($ million)
Data Table on Brazil - Market size and forecast 2025-2030 ($ million)
Chart on Brazil - Year-over-year growth 2025-2030 (%)
Data Table on Brazil - Year-over-year growth 2025-2030 (%)

12.6.2 Argentina - Market size and forecast 2025-2030

Chart on Argentina - Market size and forecast 2025-2030 ($ million)
Data Table on Argentina - Market size and forecast 2025-2030 ($ million)
Chart on Argentina - Year-over-year growth 2025-2030 (%)
Data Table on Argentina - Year-over-year growth 2025-2030 (%)

12.6.3 Chile - Market size and forecast 2025-2030

Chart on Chile - Market size and forecast 2025-2030 ($ million)
Data Table on Chile - Market size and forecast 2025-2030 ($ million)
Chart on Chile - Year-over-year growth 2025-2030 (%)
Data Table on Chile - Year-over-year growth 2025-2030 (%)

12.7 Middle East and Africa - Market size and forecast 2025-2030

Chart on Middle East and Africa - Market size and forecast 2025-2030 ($ million)
Data Table on Middle East and Africa - Market size and forecast 2025-2030 ($ million)
Chart on Middle East and Africa - Year-over-year growth 2025-2030 (%)
Data Table on Middle East and Africa - Year-over-year growth 2025-2030 (%)
Chart on Regional Comparison - Middle East and Africa
Data Table on Regional Comparison - Middle East and Africa

12.7.1 Saudi Arabia - Market size and forecast 2025-2030

Chart on Saudi Arabia - Market size and forecast 2025-2030 ($ million)
Data Table on Saudi Arabia - Market size and forecast 2025-2030 ($ million)
Chart on Saudi Arabia - Year-over-year growth 2025-2030 (%)
Data Table on Saudi Arabia - Year-over-year growth 2025-2030 (%)

12.7.2 UAE - Market size and forecast 2025-2030

Chart on UAE - Market size and forecast 2025-2030 ($ million)
Data Table on UAE - Market size and forecast 2025-2030 ($ million)
Chart on UAE - Year-over-year growth 2025-2030 (%)
Data Table on UAE - Year-over-year growth 2025-2030 (%)

12.7.3 Turkey - Market size and forecast 2025-2030

Chart on Turkey - Market size and forecast 2025-2030 ($ million)
Data Table on Turkey - Market size and forecast 2025-2030 ($ million)
Chart on Turkey - Year-over-year growth 2025-2030 (%)
Data Table on Turkey - Year-over-year growth 2025-2030 (%)

12.7.4 Israel - Market size and forecast 2025-2030

Chart on Israel - Market size and forecast 2025-2030 ($ million)
Data Table on Israel - Market size and forecast 2025-2030 ($ million)
Chart on Israel - Year-over-year growth 2025-2030 (%)
Data Table on Israel - Year-over-year growth 2025-2030 (%)

12.7.5 South Africa - Market size and forecast 2025-2030

Chart on South Africa - Market size and forecast 2025-2030 ($ million)
Data Table on South Africa - Market size and forecast 2025-2030 ($ million)
Chart on South Africa - Year-over-year growth 2025-2030 (%)
Data Table on South Africa - Year-over-year growth 2025-2030 (%)

12.8 Market opportunity by geography

Market opportunity by geography ($ million)
Data Tables on Market opportunity by geography ($ million)

13. Drivers, Challenges, and Opportunity

13.1 Market drivers

Rising global demand for sustainable and biodegradable material solutions
Superior mechanical properties and innovations in high-performance packaging
Diversification into high-value biomedical and electronic applications

13.2 Market challenges

High production costs and obstacle of scalability
Regulatory uncertainty and absence of standardized protocols
Technical barriers to market penetration and material substitution

13.3 Impact of drivers and challenges

Impact of drivers and challenges in 2025 and 2030

13.4 Market opportunities

Advancements in additive manufacturing and bio-ink integration
Sophisticated surface functionalization and hybrid material development
Evolution of active packaging and intelligent bio-coating systems

14. Competitive Landscape

14.1 Overview

14.2

Overview on criticality of inputs and factors of differentiation

14.3 Landscape disruption

Overview on factors of disruption

14.4 Industry risks

Impact of key risks on business

15. Competitive Analysis

15.1 Companies profiled

Companies covered

15.2 Company ranking index

15.3 Market positioning of companies

Matrix on companies position and classification

15.4 Anomera Inc.

Anomera Inc. - Overview
Anomera Inc. - Product / Service
Anomera Inc. - Key offerings
SWOT

15.5 ANPOLY Inc.

ANPOLY Inc. - Overview
ANPOLY Inc. - Product / Service
ANPOLY Inc. - Key offerings
SWOT

15.6 Borregaard ASA

Borregaard ASA - Overview
Borregaard ASA - Business segments
Borregaard ASA - Key offerings
Borregaard ASA - Segment focus
SWOT

15.7 Chuetsu Pulp and Paper Co. Ltd.

Chuetsu Pulp and Paper Co. Ltd. - Overview
Chuetsu Pulp and Paper Co. Ltd. - Product / Service
Chuetsu Pulp and Paper Co. Ltd. - Key offerings
SWOT

15.8 FineCell AB

FineCell AB - Overview
FineCell AB - Product / Service
FineCell AB - Key offerings
SWOT

15.9 GranBio Investimentos SA

GranBio Investimentos SA - Overview
GranBio Investimentos SA - Product / Service
GranBio Investimentos SA - Key offerings
SWOT

15.10 Nippon Paper Industries Co. Ltd.

Nippon Paper Industries Co. Ltd. - Overview
Nippon Paper Industries Co. Ltd. - Business segments
Nippon Paper Industries Co. Ltd. - Key offerings
Nippon Paper Industries Co. Ltd. - Segment focus
SWOT

15.11 Norske Skog ASA

Norske Skog ASA - Overview
Norske Skog ASA - Business segments
Norske Skog ASA - Key offerings
Norske Skog ASA - Segment focus
SWOT

15.12 Oji Holdings Corp.

Oji Holdings Corp. - Overview
Oji Holdings Corp. - Business segments
Oji Holdings Corp. - Key offerings
Oji Holdings Corp. - Segment focus
SWOT

15.13 Sappi Ltd.

Sappi Ltd. - Overview
Sappi Ltd. - Business segments
Sappi Ltd. - Key offerings
Sappi Ltd. - Segment focus
SWOT

15.14 Soarce

Soarce - Overview
Soarce - Product / Service
Soarce - Key offerings
SWOT

15.15 Sugino Machine Ltd.

Sugino Machine Ltd. - Overview
Sugino Machine Ltd. - Product / Service
Sugino Machine Ltd. - Key offerings
SWOT

15.16 Tianlu Nano

Tianlu Nano - Overview
Tianlu Nano - Product / Service
Tianlu Nano - Key offerings
SWOT

15.17 UPM Kymmene Corp.

UPM Kymmene Corp. - Overview
UPM Kymmene Corp. - Business segments
UPM Kymmene Corp. - Key offerings
UPM Kymmene Corp. - Segment focus
SWOT

15.18 Weidmann Fiber Technology

Weidmann Fiber Technology - Overview
Weidmann Fiber Technology - Product / Service
Weidmann Fiber Technology - Key offerings
SWOT

16. Appendix

16.1 Scope of the report

Market definition
Objectives
Notes and caveats

16.2 Inclusions and exclusions checklist

Inclusions checklist
Exclusions checklist

16.3 Currency conversion rates for US$

16.4 Research methodology

16.5 Data procurement

Information sources

16.6 Data validation

16.7 Validation techniques employed for market sizing

16.8 Data synthesis

16.9 360 degree market analysis

16.10 List of abbreviations

Research Methodology

Technavio presents a detailed picture of the market by way of study, synthesis, and summation of data from multiple sources. The analysts have presented the various facets of the market with a particular focus on identifying the key industry influencers. The data thus presented is comprehensive, reliable, and the result of extensive research, both primary and secondary.

INFORMATION SOURCES

Primary sources

  • Manufacturers and suppliers
  • Channel partners
  • Industry experts
  • Strategic decision makers

Secondary sources

  • Industry journals and periodicals
  • Government data
  • Financial reports of key industry players
  • Historical data
  • Press releases

DATA ANALYSIS

Data Synthesis

  • Collation of data
  • Estimation of key figures
  • Analysis of derived insights

Data Validation

  • Triangulation with data models
  • Reference against proprietary databases
  • Corroboration with industry experts

REPORT WRITING

Qualitative

  • Market drivers
  • Market challenges
  • Market trends
  • Five forces analysis

Quantitative

  • Market size and forecast
  • Market segmentation
  • Geographical insights
  • Competitive landscape

Interested in this report?

Get your sample now to see our research methodology and insights!

Download Now

Frequently Asked Questions

Nanocellulose market growth will increase by USD 708.4 million during 2026-2030.

The Nanocellulose market is expected to grow at a CAGR of 21.1% during 2026-2030.

Nanocellulose market is segmented by Type (Nano-fibrillated cellulose, Nano-crystalline cellulose, Bacterial nanocellulose) Application (Composites, Paper processing, Oil and gas, Paints and coatings, Others) Source (Wood pulp, Agricultural biomass, Others)

Anomera Inc., ANPOLY Inc., Borregaard ASA, CelluForce Inc., Cellulose Lab Inc., Chuetsu Pulp and Paper Co. Ltd., FineCell AB, GranBio Investimentos SA, GreenNano Technologies Inc., Nano Novin Polymer Co., NanoVerse, Nippon Paper Industries Co. Ltd., Norske Skog ASA, Oji Holdings Corp., Sappi Ltd., Soarce, Sugino Machine Ltd., Tianlu Nano, UPM Kymmene Corp., Weidmann Fiber Technology are a few of the key vendors in the Nanocellulose market.

Europe will register the highest growth rate of 35.1% among the other regions. Therefore, the Nanocellulose market in Europe is expected to garner significant business opportunities for the vendors during the forecast period.

Germany, UK, France, Italy, Spain, The Netherlands, US, Canada, Mexico, China, Japan, India, South Korea, Australia, Indonesia, Brazil, Argentina, Chile, Saudi Arabia, UAE, Turkey, Israel, South Africa

  • Rising global demand for sustainable and biodegradable material solutions is the driving factor this market.

The Nanocellulose market vendors should focus on grabbing business opportunities from the Type segment as it accounted for the largest market share in the base year.
RIA - Research AI Assistant
Ask RIA
