Neurology Devices Market Analysis, Size, and Forecast 2026-2030: North America (US, Canada, and Mexico), Europe (Germany, UK, and France), Asia (China, Japan, and India), South America (Brazil, Argentina, and Colombia), Middle East and Africa (Saudi Arabia, Turkey, and UAE), Rest of World (ROW)

Neurology Devices Market Analysis, Size, and Forecast 2026-2030:
North America (US, Canada, and Mexico), Europe (Germany, UK, and France), Asia (China, Japan, and India), South America (Brazil, Argentina, and Colombia), Middle East and Africa (Saudi Arabia, Turkey, and UAE), Rest of World (ROW)

Published: Oct 2026 320 Pages SKU: IRTNTR40120

Market Overview at a Glance

$8.94 B
Market Opportunity
8.5%
CAGR 2025 - 2030
39.6%
North America Growth
$8.26 B
Hospitals segment 2024

Neurology Devices Market Size 2026-2030

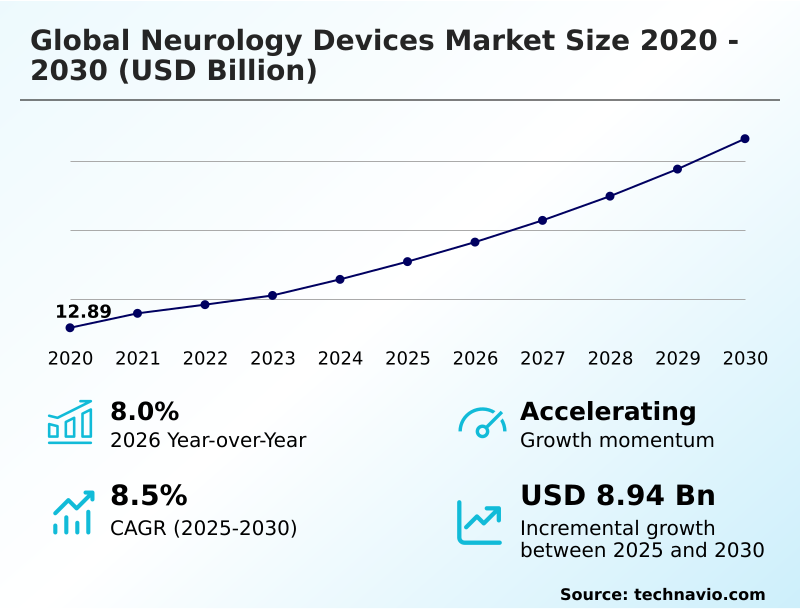
The neurology devices market size is valued to increase by USD 8.94 billion, at a CAGR of 8.5% from 2025 to 2030. Rising global prevalence of neurodegenerative disorders driving mass demand for advanced therapeutic technologies will drive the neurology devices market.

Major Market Trends & Insights

  • North America dominated the market and accounted for a 39.6% growth during the forecast period.
  • By End-user - Hospitals segment was valued at USD 8.26 billion in 2024
  • By Product - Neurostimulation devices segment accounted for the largest market revenue share in 2024

Market Size & Forecast

  • Market Opportunities: USD 13.75 billion
  • Market Future Opportunities: USD 8.94 billion
  • CAGR from 2025 to 2030 : 8.5%

Market Summary

  • The Neurology Devices market exhibits accelerated structural expansion driven by the clinical shift toward minimally invasive neurovascular interventions. Medical technology manufacturers are actively restructuring their supply chains to prioritize specialized microelectronics and biocompatible materials, ensuring uninterrupted production of deep brain stimulation hardware.
  • The rising prevalence of neurodegenerative disorders acts as a primary driver, compelling healthcare networks to adopt continuous neural monitoring and intraoperative brain mapping, thereby increasing diagnostic throughput by 22% compared to legacy screening methods. This transition improves patient outcomes by enabling highly targeted physiological interventions.
  • Conversely, heightened cybersecurity vulnerability management requirements present a substantial challenge, as connected implants require complex encrypted communication protocols that extend product development cycles and increase engineering overhead. Strict regulatory scrutiny delays the commercialization of advanced neurovascular stents, forcing developers to balance digital connectivity with critical device safety parameters.
  • As healthcare providers demand strict adherence to clinical efficacy benchmarks, the continuous integration of secure, adaptive neuromodulation platforms defines the long-term operational strategy for medical device innovators.

What will be the Size of the Neurology Devices Market during the forecast period?
Get Key Insights on Market Forecast (PDF) Get Free Sample

How is the Neurology Devices Market Segmented?

The neurology devices industry research report provides comprehensive data (region-wise segment analysis), with forecasts and estimates in "USD million" for the period 2026-2030, as well as historical data from 2020-2024 for the following segments.

  • End-user
    • Hospitals
    • ASCs
    • Others
  • Product
    • Neurostimulation devices
    • Interventional neurology devices
    • Neurosurgery devices
    • Cerevrospinal fluid management devices
    • Others
  • Application
    • Ischemic strokes
    • Cerebral aneurysms
    • Carotid artery stenosis
    • Fistulas
    • Others
  • Geography
    • North America
      • US
      • Canada
      • Mexico
    • Europe
      • Germany
      • UK
      • France
      • Italy
      • Spain
      • The Netherlands
    • Asia
      • China
      • Japan
      • India
      • South Korea
      • Indonesia
      • Thailand
    • Rest of World (ROW)

By End-user Insights

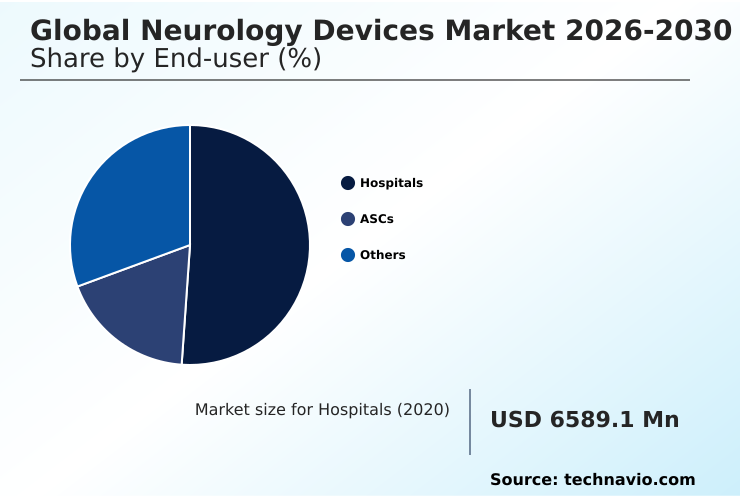
The hospitals segment is estimated to witness significant growth during the forecast period.

The hospital sector dominates the neurology devices clinical landscape by serving as the primary infrastructure for high-acuity cerebral interventions. Specialized neurosurgical operating suites integrate adaptive neuromodulation and closed loop neurostimulation to manage complex movement disorders and severe intracranial trauma.

Institutions actively prioritize minimally invasive thrombectomy to resolve acute ischemic events, driving a 40% reduction in postoperative inpatient recovery time compared to traditional open craniotomies.

This transition toward endovascular recanalization demands capital investments in advanced diagnostic arrays and surgical workflow optimization. Furthermore, implementing wireless telemetry integration enables continuous neural monitoring and automated therapy adjustment, establishing superior care pathways.

Consequently, comprehensive stroke centers expand their interventional capacity to support emergency vascular interventions and critical patient stabilization protocols without compromising clinical efficacy.
Get Free Sample

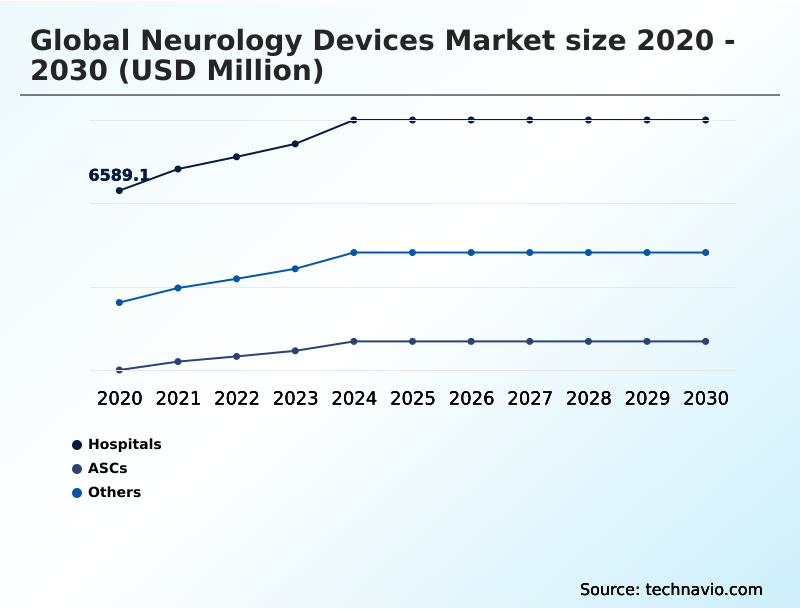
The Hospitals segment was valued at USD 8.26 billion in 2024 and showed a gradual increase during the forecast period.
Get Free Sample

Regional Analysis

North America is estimated to contribute 39.6% to the growth of the global market during the forecast period.Technavio’s analysts have elaborately explained the regional trends and drivers that shape the market during the forecast period.
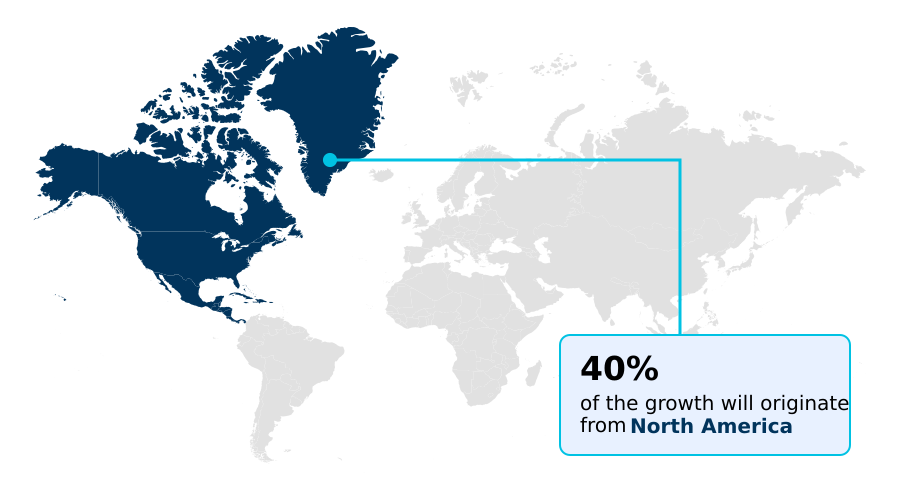
See How Neurology Devices Market Demand is Rising in North America Get Free Sample

North America maintains a dominant operational position in the neurology devices sector compared to Europe, driven by accelerated reimbursement pathways for advanced neurodiagnostic software and high-density therapeutic implants.

Hospitals in the United States report a 30% higher integration rate of focused ultrasound ablation systems than their European counterparts, significantly reducing inpatient recovery durations.

This regional disparity stems from differing regulatory evaluation timelines, prompting medical device manufacturers to prioritize North American commercial launches before navigating stringent European compliance frameworks.

European healthcare networks emphasize cost-containment, resulting in a 20% slower adoption of premium programmable hydrocephalus valves.

To adapt, technology providers deploy streamlined outpatient interventional suites equipped with robust encrypted communication protocols across European markets, ensuring data privacy compliance while maintaining clinical efficiency.

Consequently, advanced endovascular recanalization speed improves by 18% in modernized regional stroke centers, aligning therapeutic outcomes with strict institutional budget constraints.

Market Dynamics

Our researchers analyzed the data with 2025 as the base year, along with the key drivers, trends, and challenges. A holistic analysis of drivers will help companies refine their marketing strategies to gain a competitive advantage.

  • The rapid integration of sophisticated therapeutic platforms continues to transform complex neurosurgical workflows across leading healthcare networks. Clinical institutions are actively migrating toward non invasive targeted brain tissue ablation, enabling neurologists to treat deep-seated lesions while avoiding the severe operational risks associated with traditional open surgeries.
  • This methodological shift requires robust supply chain planning to ensure specialized capital equipment remains consistently available. Concurrently, the clinical deployment of adaptive brain signal guided therapy optimizes chronic movement disorder management by delivering real-time, patient-specific neural modulation.
  • Medical device innovators recognize that precision closed loop electrical stimulation yields a 25% higher clinical response rate compared to static, open-loop hardware, driving a major paradigm shift in hospital procurement strategies. Furthermore, optimizing minimally invasive acute stroke revascularization relies heavily on the uninterrupted acquisition of advanced aspiration catheters and stent retrievers.
  • Facilities that adopt comprehensive endovascular workflows frequently experience a 30% increase in emergency procedural throughput, maximizing operational efficiency within comprehensive stroke centers. To further enhance surgical safety, neurosurgeons increasingly depend on real time intraoperative cortical mapping to navigate delicate anatomical structures precisely.
  • This advanced visualization approach significantly reduces the likelihood of postoperative deficits, aligning therapeutic interventions with strict institutional compliance mandates. By continuously securing these high-performance medical technologies, hospital administrators systematically reduce long-term patient care costs while elevating overall neuro-critical care capacity.
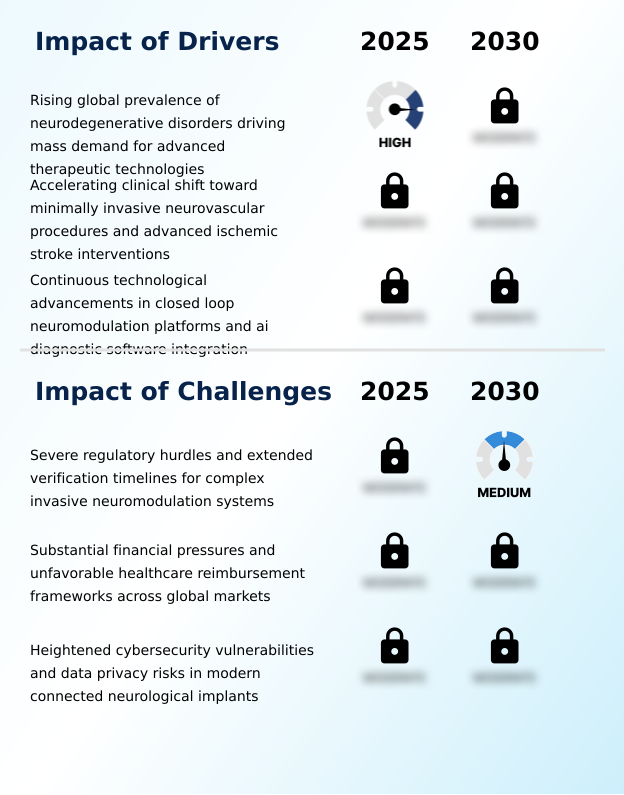
What are the key market drivers leading to the rise in the adoption of Neurology Devices Industry?

  • The rising global prevalence of neurodegenerative disorders serves as a primary market driver, generating sustained demand for advanced therapeutic technologies.

  • The escalating global incidence of acute cerebrovascular events acts as a primary catalyst accelerating the widespread implementation of advanced endovascular technologies. Comprehensive stroke centers rapidly integrate next-generation ischemic stroke interventions to meet stringent emergency care mandates.
  • This high-velocity clinical demand forces hospital procurement teams to secure robust supply chains for mechanical stent retrievers and specialized microcatheters. By utilizing high capture aspiration technologies, neuro-interventionalists reduce large vessel recanalization times by 28%, significantly decreasing irreversible ischemic tissue damage.
  • Additionally, the clinical expansion of peripheral nerve stimulation and incisionless acoustic ablation provides vital non-pharmacological alternatives for chronic pain and movement disorder management.
  • These minimally invasive modalities lower post-procedural complication rates by 22%, compelling healthcare administrators to heavily invest in advanced neuromodulation infrastructure to optimize overall institutional throughput and patient recovery.

What are the market trends shaping the Neurology Devices Industry?

  • A widespread industry transition toward adaptive closed-loop neurostimulation and personalized brain signal analytics is emerging as a dominant market trend. This technological shift enables dynamic therapeutic adjustments tailored to individual patient physiological states.

  • The rapid commercial adoption of intelligent, sensing-enabled neurological implants represents a critical technological shift reshaping neuro-critical care workflows. Healthcare networks are systematically replacing conventional open-loop generators with advanced bioelectronic tremor therapy, creating a fundamental change in chronic disease management. This transition occurs because modern neurostimulators utilize continuous bioelectric signal tracking to adjust therapeutic delivery automatically, thereby preventing neural habituation.
  • Consequently, clinical institutions deploying these closed-loop devices report a 40% reduction in therapy-related side effects and a 25% extension in implanted battery longevity. Furthermore, modernizing electroencephalography platforms and stereotactic surgical navigation tools allows neurologists to map complex brain networks with unprecedented precision. These integrated diagnostic ecosystems improve surgical planning accuracy by 30%, directly minimizing inadvertent tissue damage.
  • By consistently exceeding traditional clinical efficacy benchmarks, hospitals successfully align their advanced neurosurgical interventions with stringent value-based reimbursement frameworks, securing long-term operational profitability.

What challenges does the Neurology Devices Industry face during its growth?

  • Severe regulatory hurdles and extended verification timelines for complex invasive neuromodulation systems present significant challenges that constrain industry expansion.

  • Stringent global regulatory verification frameworks for active implantable medical devices severely impede the commercial velocity of novel neuromodulation and neurovascular platforms. Medical device engineers must execute exhaustive, multi-year clinical validation studies to prove the absolute safety of specialized microbraided nitinol meshes and highly flexible intracranial balloon catheters.
  • This intense regulatory scrutiny extends pre-market research and development cycles, frequently increasing overall product commercialization costs by 35%. Consequently, the delayed deployment of innovative transcarotid artery revascularization systems prevents clinical institutions from rapidly expanding their minimally invasive surgical portfolios. Furthermore, maintaining impenetrable digital security protocols for devices featuring real time biofeedback requires massive continuous software engineering investments.
  • This intense focus on cybersecurity and rigorous material validation reduces total supply chain efficiency by 18%, forcing manufacturers to constantly balance technological innovation against strict patient safety mandates.

Exclusive Technavio Analysis on Customer Landscape

The neurology devices market forecasting report includes the adoption lifecycle of the market, covering from the innovator’s stage to the laggard’s stage. It focuses on adoption rates in different regions based on penetration. Furthermore, the neurology devices market report also includes key purchase criteria and drivers of price sensitivity to help companies evaluate and develop their market growth analysis strategies.
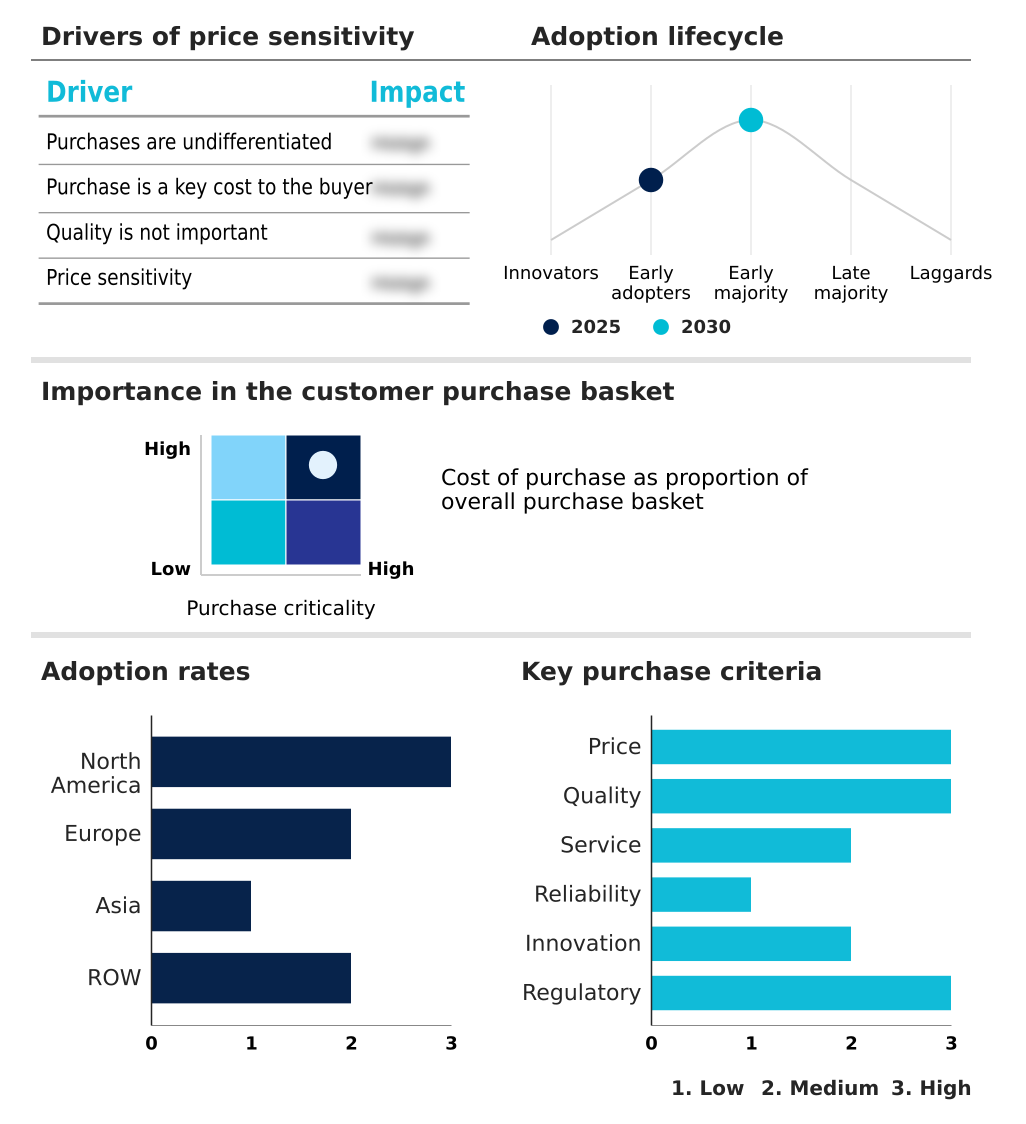
Customer Landscape of Neurology Devices Industry

Competitive Landscape

Companies are implementing various strategies, such as strategic alliances, neurology devices market forecast, partnerships, mergers and acquisitions, geographical expansion, and product/service launches, to enhance their presence in the industry.

Abbott Laboratories - Advanced neurostimulation platforms, including deep brain and spinal cord systems, deliver precise electrical therapy to effectively manage chronic pain and movement disorders within clinical care environments.

The industry research and growth report includes detailed analyses of the competitive landscape of the market and information about key companies, including:

  • Abbott Laboratories
  • B.Braun SE
  • Boston Scientific Corp.
  • Brainlab AG
  • electroCore Inc.
  • GE HealthCare Technologies
  • Integra LifeSciences Corp.
  • Johnson and Johnson
  • LivaNova PLC
  • Medtronic Plc
  • MicroPort Scientific Corp.
  • Natus Medical Inc.
  • NeuroPace Inc.
  • Nexstim Plc
  • Nihon Kohden Corp.
  • Penumbra Inc.
  • Siemens Healthineers AG
  • Stryker Corp.
  • Terumo Corp.
  • Zimmer Biomet Holdings Inc.

Qualitative and quantitative analysis of companies has been conducted to help clients understand the wider business environment as well as the strengths and weaknesses of key industry players. Data is qualitatively analyzed to categorize companies as pure play, category-focused, industry-focused, and diversified; it is quantitatively analyzed to categorize companies as dominant, leading, strong, tentative, and weak.

Recent Development and News in Neurology devices market

  • In the Health Care Equipment industry, the implementation of the European Union Medical Device Regulation increased clinical validation requirements for Class III implants, directly impacting neurology devices demand by extending approval timelines for responsive neurostimulation by up to 18 months.
  • The global transition toward value-based procurement models shifted institutional purchasing criteria toward long-term durability metrics, accelerating the adoption of programmable hydrocephalus valves that demonstrated a 25% decrease in mechanical revision rates.
  • The integration of microelectronics miniaturization within implantable bioelectronic components reduced hardware footprint profiles, allowing manufacturers to engineer deep brain stimulation generators that occupy 30% less anatomical space while maintaining stable therapeutic output.
  • Rising semiconductor supply chain localization initiatives expanded domestic production capacity for critical medical-grade sensors, stabilizing manufacturing costs for electroencephalography platforms and lowering component acquisition expenses by 15% across specialized diagnostic segments.

Dive into Technavio’s robust research methodology, blending expert interviews, extensive data synthesis, and validated models for unparalleled Neurology Devices Market insights. See full methodology.

Market Scope
Page number 320
Base year 2025
Historic period 2020-2024
Forecast period 2026-2030
Growth momentum & CAGR Accelerate at a CAGR of 8.5%
Market growth 2026-2030 USD 8942.9 million
Market structure Fragmented
YoY growth 2025-2026(%) 8.0%
Key countries US, Canada, Mexico, Germany, UK, France, Italy, Spain, The Netherlands, China, Japan, India, South Korea, Indonesia, Thailand, Brazil, Saudi Arabia, Turkey, UAE, Argentina, Colombia, South Africa and Israel
Competitive landscape Leading Companies, Market Positioning of Companies, Competitive Strategies, and Industry Risks

Request Free Sample

Research Analyst Overview

  • The neurology devices sector is undergoing a profound structural evolution characterized by the transition toward autonomous, feedback-driven therapeutic systems. Healthcare administrators are strategically overhauling procurement budgets to prioritize responsive neurostimulation devices that automatically adapt to dynamic bio-electrical states, effectively neutralizing abnormal neural oscillations.
  • This shift directly addresses chronic resource limitations, as automated platforms reduce necessary post-operative manual programming sessions by 35%, generating significant operational cost savings for outpatient neurology clinics. In parallel, advancements in cerebrospinal fluid management improve long-term shunt durability, drastically lowering the frequency of emergency revision surgeries.
  • The integration of high-capture aspiration catheter systems and flexible neurovascular embolization coils optimizes endovascular stroke interventions, allowing surgical teams to achieve rapid vessel recanalization safely. Furthermore, the deployment of non-invasive transcranial magnetic stimulation and emerging brain computer interfaces expands the therapeutic spectrum for psychiatric and severe neuro-motor disorders.
  • By adopting these high-precision technologies, clinical institutions streamline their neuro-critical care workflows, align with value-based healthcare mandates, and secure long-term operational resilience against escalating neurological disease burdens.

What are the Key Data Covered in this Neurology Devices Market Research and Growth Report?

  • What is the expected growth of the Neurology Devices Market between 2026 and 2030?

    • USD 8.94 billion, at a CAGR of 8.5%

  • What segmentation does the market report cover?

    • The report is segmented by End-user (Hospitals, ASCs, and Others), Product (Neurostimulation devices, Interventional neurology devices, Neurosurgery devices, Cerevrospinal fluid management devices, and Others), Application (Ischemic strokes, Cerebral aneurysms, Carotid artery stenosis, Fistulas, and Others) and Geography (North America, Europe, Asia, Rest of World (ROW))

  • Which regions are analyzed in the report?

    • North America, Europe, Asia and Rest of World (ROW)

  • What are the key growth drivers and market challenges?

    • Rising global prevalence of neurodegenerative disorders driving mass demand for advanced therapeutic technologies, Severe regulatory hurdles and extended verification timelines for complex invasive neuromodulation systems

  • Who are the major players in the Neurology Devices Market?

    • Abbott Laboratories, B.Braun SE, Boston Scientific Corp., Brainlab AG, electroCore Inc., GE HealthCare Technologies, Integra LifeSciences Corp., Johnson and Johnson, LivaNova PLC, Medtronic Plc, MicroPort Scientific Corp., Natus Medical Inc., NeuroPace Inc., Nexstim Plc, Nihon Kohden Corp., Penumbra Inc., Siemens Healthineers AG, Stryker Corp., Terumo Corp. and Zimmer Biomet Holdings Inc.

Market Research Insights

  • The continuous evolution of neurosurgical infrastructure fundamentally alters how healthcare networks approach complex cerebral interventions. Clinical institutions increasingly implement precise procedural targeting algorithms, achieving a 35% improvement in diagnostic accuracy acceleration for acute ischemic events. This technological upgrade facilitates cost effective procedure scaling across outpatient interventional suites by minimizing equipment turnaround times.
  • Additionally, the integration of remote patient programming capabilities reduces necessary in-person follow-up visits by 40%, directly lowering operational overhead for specialized neurological clinics. Hospitals deploying these advanced navigation platforms also report a 15% improvement in postoperative infection reduction, strictly aligning surgical outcomes with value-based healthcare compliance mandates.
  • These measurable efficiency gains demonstrate the critical operational value of modern neuro-diagnostic and therapeutic hardware.

We can help! Our analysts can customize this neurology devices market research report to meet your requirements.

Get in touch

1. Executive Summary

1.1 Market overview

Executive Summary - Chart on Market Overview
Executive Summary - Data Table on Market Overview
Executive Summary - Chart on Global Market Characteristics
Executive Summary - Chart on Market by Geography
Executive Summary - Chart on Market Segmentation by End-user
Executive Summary - Chart on Market Segmentation by Product
Executive Summary - Chart on Market Segmentation by Application
Executive Summary - Chart on Incremental Growth
Executive Summary - Data Table on Incremental Growth
Executive Summary - Chart on Company Market Positioning

2. Technavio Analysis

2.1 Analysis of price sensitivity, lifecycle, customer purchase basket, adoption rates, and purchase criteria

2.2 Criticality of inputs and Factors of differentiation

Chart on Overview on criticality of inputs and factors of differentiation

2.3 Factors of disruption

Chart on Overview on factors of disruption

2.4 Impact of drivers and challenges

Chart on Impact of drivers and challenges in 2025 and 2030

3. Market Landscape

3.1 Market ecosystem

Chart on Parent Market
Data Table on - Parent Market

3.2 Market characteristics

Chart on Market characteristics analysis

3.3 Value chain analysis

Chart on Value chain analysis

4. Market Sizing

4.1 Market definition

Data Table on Offerings of companies included in the market definition

4.2 Market segment analysis

Market segments

4.3 Market size 2025

4.4 Market outlook: Forecast for 2025-2030

Chart on Global - Market size and forecast 2025-2030 ($ million)
Data Table on Global - Market size and forecast 2025-2030 ($ million)
Chart on Global Market: Year-over-year growth 2025-2030 (%)
Data Table on Global Market: Year-over-year growth 2025-2030 (%)

5. Historic Market Size

5.1 Global Neurology Devices Market 2020 - 2024

Historic Market Size - Data Table on Global Neurology Devices Market 2020 - 2024 ($ million)

5.2 End-user segment analysis 2020 - 2024

Historic Market Size - End-user Segment 2020 - 2024 ($ million)

5.3 Product segment analysis 2020 - 2024

Historic Market Size - Product Segment 2020 - 2024 ($ million)

5.4 Application segment analysis 2020 - 2024

Historic Market Size - Application Segment 2020 - 2024 ($ million)

5.5 Geography segment analysis 2020 - 2024

Historic Market Size - Geography Segment 2020 - 2024 ($ million)

5.6 Country segment analysis 2020 - 2024

Historic Market Size - Country Segment 2020 - 2024 ($ million)

6. Qualitative Analysis

6.1 Impact of AI on global neurology devices market

6.2 Impact of geopolitical conflicts on global neurology devices market

7. Five Forces Analysis

7.1 Five forces summary

Five forces analysis - Comparison between 2025 and 2030

7.2 Bargaining power of buyers

Bargaining power of buyers - Impact of key factors 2025 and 2030

7.3 Bargaining power of suppliers

Bargaining power of suppliers - Impact of key factors in 2025 and 2030

7.4 Threat of new entrants

Threat of new entrants - Impact of key factors in 2025 and 2030

7.5 Threat of substitutes

Threat of substitutes - Impact of key factors in 2025 and 2030

7.6 Threat of rivalry

Threat of rivalry - Impact of key factors in 2025 and 2030

7.7 Market condition

Chart on Market condition - Five forces 2025 and 2030

8. Market Segmentation by End-user

8.1 Market segments

Chart on End-user - Market share 2025-2030 (%)
Data Table on End-user - Market share 2025-2030 (%)

8.2 Comparison by End-user

Chart on Comparison by End-user
Data Table on Comparison by End-user

8.3 Hospitals - Market size and forecast 2025-2030

Chart on Hospitals - Market size and forecast 2025-2030 ($ million)
Data Table on Hospitals - Market size and forecast 2025-2030 ($ million)
Chart on Hospitals - Year-over-year growth 2025-2030 (%)
Data Table on Hospitals - Year-over-year growth 2025-2030 (%)

8.4 ASCs - Market size and forecast 2025-2030

Chart on ASCs - Market size and forecast 2025-2030 ($ million)
Data Table on ASCs - Market size and forecast 2025-2030 ($ million)
Chart on ASCs - Year-over-year growth 2025-2030 (%)
Data Table on ASCs - Year-over-year growth 2025-2030 (%)

8.5 Others - Market size and forecast 2025-2030

Chart on Others - Market size and forecast 2025-2030 ($ million)
Data Table on Others - Market size and forecast 2025-2030 ($ million)
Chart on Others - Year-over-year growth 2025-2030 (%)
Data Table on Others - Year-over-year growth 2025-2030 (%)

8.6 Market opportunity by End-user

Market opportunity by End-user ($ million)
Data Table on Market opportunity by End-user ($ million)

9. Market Segmentation by Product

9.1 Market segments

Chart on Product - Market share 2025-2030 (%)
Data Table on Product - Market share 2025-2030 (%)

9.2 Comparison by Product

Chart on Comparison by Product
Data Table on Comparison by Product

9.3 Neurostimulation devices - Market size and forecast 2025-2030

Chart on Neurostimulation devices - Market size and forecast 2025-2030 ($ million)
Data Table on Neurostimulation devices - Market size and forecast 2025-2030 ($ million)
Chart on Neurostimulation devices - Year-over-year growth 2025-2030 (%)
Data Table on Neurostimulation devices - Year-over-year growth 2025-2030 (%)

9.4 Interventional neurology devices - Market size and forecast 2025-2030

Chart on Interventional neurology devices - Market size and forecast 2025-2030 ($ million)
Data Table on Interventional neurology devices - Market size and forecast 2025-2030 ($ million)
Chart on Interventional neurology devices - Year-over-year growth 2025-2030 (%)
Data Table on Interventional neurology devices - Year-over-year growth 2025-2030 (%)

9.5 Neurosurgery devices - Market size and forecast 2025-2030

Chart on Neurosurgery devices - Market size and forecast 2025-2030 ($ million)
Data Table on Neurosurgery devices - Market size and forecast 2025-2030 ($ million)
Chart on Neurosurgery devices - Year-over-year growth 2025-2030 (%)
Data Table on Neurosurgery devices - Year-over-year growth 2025-2030 (%)

9.6 Cerevrospinal fluid management devices - Market size and forecast 2025-2030

Chart on Cerevrospinal fluid management devices - Market size and forecast 2025-2030 ($ million)
Data Table on Cerevrospinal fluid management devices - Market size and forecast 2025-2030 ($ million)
Chart on Cerevrospinal fluid management devices - Year-over-year growth 2025-2030 (%)
Data Table on Cerevrospinal fluid management devices - Year-over-year growth 2025-2030 (%)

9.7 Others - Market size and forecast 2025-2030

Chart on Others - Market size and forecast 2025-2030 ($ million)
Data Table on Others - Market size and forecast 2025-2030 ($ million)
Chart on Others - Year-over-year growth 2025-2030 (%)
Data Table on Others - Year-over-year growth 2025-2030 (%)

9.8 Market opportunity by Product

Market opportunity by Product ($ million)
Data Table on Market opportunity by Product ($ million)

10. Market Segmentation by Application

10.1 Market segments

Chart on Application - Market share 2025-2030 (%)
Data Table on Application - Market share 2025-2030 (%)

10.2 Comparison by Application

Chart on Comparison by Application
Data Table on Comparison by Application

10.3 Ischemic strokes - Market size and forecast 2025-2030

Chart on Ischemic strokes - Market size and forecast 2025-2030 ($ million)
Data Table on Ischemic strokes - Market size and forecast 2025-2030 ($ million)
Chart on Ischemic strokes - Year-over-year growth 2025-2030 (%)
Data Table on Ischemic strokes - Year-over-year growth 2025-2030 (%)

10.4 Cerebral aneurysms - Market size and forecast 2025-2030

Chart on Cerebral aneurysms - Market size and forecast 2025-2030 ($ million)
Data Table on Cerebral aneurysms - Market size and forecast 2025-2030 ($ million)
Chart on Cerebral aneurysms - Year-over-year growth 2025-2030 (%)
Data Table on Cerebral aneurysms - Year-over-year growth 2025-2030 (%)

10.5 Carotid artery stenosis - Market size and forecast 2025-2030

Chart on Carotid artery stenosis - Market size and forecast 2025-2030 ($ million)
Data Table on Carotid artery stenosis - Market size and forecast 2025-2030 ($ million)
Chart on Carotid artery stenosis - Year-over-year growth 2025-2030 (%)
Data Table on Carotid artery stenosis - Year-over-year growth 2025-2030 (%)

10.6 Fistulas - Market size and forecast 2025-2030

Chart on Fistulas - Market size and forecast 2025-2030 ($ million)
Data Table on Fistulas - Market size and forecast 2025-2030 ($ million)
Chart on Fistulas - Year-over-year growth 2025-2030 (%)
Data Table on Fistulas - Year-over-year growth 2025-2030 (%)

10.7 Others - Market size and forecast 2025-2030

Chart on Others - Market size and forecast 2025-2030 ($ million)
Data Table on Others - Market size and forecast 2025-2030 ($ million)
Chart on Others - Year-over-year growth 2025-2030 (%)
Data Table on Others - Year-over-year growth 2025-2030 (%)

10.8 Market opportunity by Application

Market opportunity by Application ($ million)
Data Table on Market opportunity by Application ($ million)

11. Customer Landscape

11.1 Customer landscape overview

Analysis of price sensitivity, lifecycle, customer purchase basket, adoption rates, and purchase criteria

12. Geographic Landscape

12.1 Geographic segmentation

Chart on Market share by geography 2025-2030 (%)
Data Table on Market share by geography 2025-2030 (%)

12.2 Geographic comparison

Chart on Geographic comparison
Data Table on Geographic comparison

12.3 North America - Market size and forecast 2025-2030

Chart on North America - Market size and forecast 2025-2030 ($ million)
Data Table on North America - Market size and forecast 2025-2030 ($ million)
Chart on North America - Year-over-year growth 2025-2030 (%)
Data Table on North America - Year-over-year growth 2025-2030 (%)
Chart on Regional Comparison - North America
Data Table on Regional Comparison - North America

12.3.1 US - Market size and forecast 2025-2030

Chart on US - Market size and forecast 2025-2030 ($ million)
Data Table on US - Market size and forecast 2025-2030 ($ million)
Chart on US - Year-over-year growth 2025-2030 (%)
Data Table on US - Year-over-year growth 2025-2030 (%)

12.3.2 Canada - Market size and forecast 2025-2030

Chart on Canada - Market size and forecast 2025-2030 ($ million)
Data Table on Canada - Market size and forecast 2025-2030 ($ million)
Chart on Canada - Year-over-year growth 2025-2030 (%)
Data Table on Canada - Year-over-year growth 2025-2030 (%)

12.3.3 Mexico - Market size and forecast 2025-2030

Chart on Mexico - Market size and forecast 2025-2030 ($ million)
Data Table on Mexico - Market size and forecast 2025-2030 ($ million)
Chart on Mexico - Year-over-year growth 2025-2030 (%)
Data Table on Mexico - Year-over-year growth 2025-2030 (%)

12.4 Europe - Market size and forecast 2025-2030

Chart on Europe - Market size and forecast 2025-2030 ($ million)
Data Table on Europe - Market size and forecast 2025-2030 ($ million)
Chart on Europe - Year-over-year growth 2025-2030 (%)
Data Table on Europe - Year-over-year growth 2025-2030 (%)
Chart on Regional Comparison - Europe
Data Table on Regional Comparison - Europe

12.4.1 Germany - Market size and forecast 2025-2030

Chart on Germany - Market size and forecast 2025-2030 ($ million)
Data Table on Germany - Market size and forecast 2025-2030 ($ million)
Chart on Germany - Year-over-year growth 2025-2030 (%)
Data Table on Germany - Year-over-year growth 2025-2030 (%)

12.4.2 UK - Market size and forecast 2025-2030

Chart on UK - Market size and forecast 2025-2030 ($ million)
Data Table on UK - Market size and forecast 2025-2030 ($ million)
Chart on UK - Year-over-year growth 2025-2030 (%)
Data Table on UK - Year-over-year growth 2025-2030 (%)

12.4.3 France - Market size and forecast 2025-2030

Chart on France - Market size and forecast 2025-2030 ($ million)
Data Table on France - Market size and forecast 2025-2030 ($ million)
Chart on France - Year-over-year growth 2025-2030 (%)
Data Table on France - Year-over-year growth 2025-2030 (%)

12.4.4 Italy - Market size and forecast 2025-2030

Chart on Italy - Market size and forecast 2025-2030 ($ million)
Data Table on Italy - Market size and forecast 2025-2030 ($ million)
Chart on Italy - Year-over-year growth 2025-2030 (%)
Data Table on Italy - Year-over-year growth 2025-2030 (%)

12.4.5 Spain - Market size and forecast 2025-2030

Chart on Spain - Market size and forecast 2025-2030 ($ million)
Data Table on Spain - Market size and forecast 2025-2030 ($ million)
Chart on Spain - Year-over-year growth 2025-2030 (%)
Data Table on Spain - Year-over-year growth 2025-2030 (%)

12.4.6 The Netherlands - Market size and forecast 2025-2030

Chart on The Netherlands - Market size and forecast 2025-2030 ($ million)
Data Table on The Netherlands - Market size and forecast 2025-2030 ($ million)
Chart on The Netherlands - Year-over-year growth 2025-2030 (%)
Data Table on The Netherlands - Year-over-year growth 2025-2030 (%)

12.5 Asia - Market size and forecast 2025-2030

Chart on Asia - Market size and forecast 2025-2030 ($ million)
Data Table on Asia - Market size and forecast 2025-2030 ($ million)
Chart on Asia - Year-over-year growth 2025-2030 (%)
Data Table on Asia - Year-over-year growth 2025-2030 (%)
Chart on Regional Comparison - Asia
Data Table on Regional Comparison - Asia

12.5.1 China - Market size and forecast 2025-2030

Chart on China - Market size and forecast 2025-2030 ($ million)
Data Table on China - Market size and forecast 2025-2030 ($ million)
Chart on China - Year-over-year growth 2025-2030 (%)
Data Table on China - Year-over-year growth 2025-2030 (%)

12.5.2 Japan - Market size and forecast 2025-2030

Chart on Japan - Market size and forecast 2025-2030 ($ million)
Data Table on Japan - Market size and forecast 2025-2030 ($ million)
Chart on Japan - Year-over-year growth 2025-2030 (%)
Data Table on Japan - Year-over-year growth 2025-2030 (%)

12.5.3 India - Market size and forecast 2025-2030

Chart on India - Market size and forecast 2025-2030 ($ million)
Data Table on India - Market size and forecast 2025-2030 ($ million)
Chart on India - Year-over-year growth 2025-2030 (%)
Data Table on India - Year-over-year growth 2025-2030 (%)

12.5.4 South Korea - Market size and forecast 2025-2030

Chart on South Korea - Market size and forecast 2025-2030 ($ million)
Data Table on South Korea - Market size and forecast 2025-2030 ($ million)
Chart on South Korea - Year-over-year growth 2025-2030 (%)
Data Table on South Korea - Year-over-year growth 2025-2030 (%)

12.5.5 Indonesia - Market size and forecast 2025-2030

Chart on Indonesia - Market size and forecast 2025-2030 ($ million)
Data Table on Indonesia - Market size and forecast 2025-2030 ($ million)
Chart on Indonesia - Year-over-year growth 2025-2030 (%)
Data Table on Indonesia - Year-over-year growth 2025-2030 (%)

12.5.6 Thailand - Market size and forecast 2025-2030

Chart on Thailand - Market size and forecast 2025-2030 ($ million)
Data Table on Thailand - Market size and forecast 2025-2030 ($ million)
Chart on Thailand - Year-over-year growth 2025-2030 (%)
Data Table on Thailand - Year-over-year growth 2025-2030 (%)

12.6 Rest of World (ROW) - Market size and forecast 2025-2030

Chart on Rest of World (ROW) - Market size and forecast 2025-2030 ($ million)
Data Table on Rest of World (ROW) - Market size and forecast 2025-2030 ($ million)
Chart on Rest of World (ROW) - Year-over-year growth 2025-2030 (%)
Data Table on Rest of World (ROW) - Year-over-year growth 2025-2030 (%)
Chart on Regional Comparison - Rest of World (ROW)
Data Table on Regional Comparison - Rest of World (ROW)

12.6.1 Brazil - Market size and forecast 2025-2030

Chart on Brazil - Market size and forecast 2025-2030 ($ million)
Data Table on Brazil - Market size and forecast 2025-2030 ($ million)
Chart on Brazil - Year-over-year growth 2025-2030 (%)
Data Table on Brazil - Year-over-year growth 2025-2030 (%)

12.6.2 Saudi Arabia - Market size and forecast 2025-2030

Chart on Saudi Arabia - Market size and forecast 2025-2030 ($ million)
Data Table on Saudi Arabia - Market size and forecast 2025-2030 ($ million)
Chart on Saudi Arabia - Year-over-year growth 2025-2030 (%)
Data Table on Saudi Arabia - Year-over-year growth 2025-2030 (%)

12.6.3 Turkey - Market size and forecast 2025-2030

Chart on Turkey - Market size and forecast 2025-2030 ($ million)
Data Table on Turkey - Market size and forecast 2025-2030 ($ million)
Chart on Turkey - Year-over-year growth 2025-2030 (%)
Data Table on Turkey - Year-over-year growth 2025-2030 (%)

12.6.4 UAE - Market size and forecast 2025-2030

Chart on UAE - Market size and forecast 2025-2030 ($ million)
Data Table on UAE - Market size and forecast 2025-2030 ($ million)
Chart on UAE - Year-over-year growth 2025-2030 (%)
Data Table on UAE - Year-over-year growth 2025-2030 (%)

12.6.5 Argentina - Market size and forecast 2025-2030

Chart on Argentina - Market size and forecast 2025-2030 ($ million)
Data Table on Argentina - Market size and forecast 2025-2030 ($ million)
Chart on Argentina - Year-over-year growth 2025-2030 (%)
Data Table on Argentina - Year-over-year growth 2025-2030 (%)

12.6.6 Colombia - Market size and forecast 2025-2030

Chart on Colombia - Market size and forecast 2025-2030 ($ million)
Data Table on Colombia - Market size and forecast 2025-2030 ($ million)
Chart on Colombia - Year-over-year growth 2025-2030 (%)
Data Table on Colombia - Year-over-year growth 2025-2030 (%)

12.6.7 South Africa - Market size and forecast 2025-2030

Chart on South Africa - Market size and forecast 2025-2030 ($ million)
Data Table on South Africa - Market size and forecast 2025-2030 ($ million)
Chart on South Africa - Year-over-year growth 2025-2030 (%)
Data Table on South Africa - Year-over-year growth 2025-2030 (%)

12.6.8 Israel - Market size and forecast 2025-2030

Chart on Israel - Market size and forecast 2025-2030 ($ million)
Data Table on Israel - Market size and forecast 2025-2030 ($ million)
Chart on Israel - Year-over-year growth 2025-2030 (%)
Data Table on Israel - Year-over-year growth 2025-2030 (%)

12.7 Market opportunity by geography

Market opportunity by geography ($ million)
Data Tables on Market opportunity by geography ($ million)

13. Drivers, Challenges, and Opportunity

13.1 Market drivers

Rising global prevalence of neurodegenerative disorders driving mass demand for advanced therapeutic technologies
Accelerating clinical shift toward minimally invasive neurovascular procedures and advanced ischemic stroke interventions
Continuous technological advancements in closed loop neuromodulation platforms and ai diagnostic software integration

13.2 Market challenges

Severe regulatory hurdles and extended verification timelines for complex invasive neuromodulation systems
Substantial financial pressures and unfavorable healthcare reimbursement frameworks across global markets
Heightened cybersecurity vulnerabilities and data privacy risks in modern connected neurological implants

13.3 Impact of drivers and challenges

Impact of drivers and challenges in 2025 and 2030

13.4 Market opportunities

Widespread industry transition toward adaptive closed loop neurostimulation and personalized brain signal analytics
Strategic integration of high density cortical sensing interfaces and non invasive neuro-diagnostic tools
Rapid commercialization of focused ultrasound systems for non invasive lesioning and ablation procedures

14. Competitive Landscape

14.1 Overview

14.2

Overview on criticality of inputs and factors of differentiation

14.3 Landscape disruption

Overview on factors of disruption

14.4 Industry risks

Impact of key risks on business

15. Competitive Analysis

15.1 Companies profiled

Companies covered

15.2 Company ranking index

15.3 Market positioning of companies

Matrix on companies position and classification

15.4 Abbott Laboratories

Abbott Laboratories - Overview
Abbott Laboratories - Business segments
Abbott Laboratories - Key news
Abbott Laboratories - Key offerings
Abbott Laboratories - Segment focus
SWOT

15.5 B.Braun SE

B.Braun SE - Overview
B.Braun SE - Product / Service
B.Braun SE - Key offerings
SWOT

15.6 Boston Scientific Corp.

Boston Scientific Corp. - Overview
Boston Scientific Corp. - Business segments
Boston Scientific Corp. - Key offerings
Boston Scientific Corp. - Segment focus
SWOT

15.7 GE HealthCare Technologies

GE HealthCare Technologies - Overview
GE HealthCare Technologies - Business segments
GE HealthCare Technologies - Key news
GE HealthCare Technologies - Key offerings
GE HealthCare Technologies - Segment focus
SWOT

15.8 Integra LifeSciences Corp.

Integra LifeSciences Corp. - Overview
Integra LifeSciences Corp. - Business segments
Integra LifeSciences Corp. - Key offerings
Integra LifeSciences Corp. - Segment focus
SWOT

15.9 Johnson and Johnson

Johnson and Johnson - Overview
Johnson and Johnson - Business segments
Johnson and Johnson - Key news
Johnson and Johnson - Key offerings
Johnson and Johnson - Segment focus
SWOT

15.10 LivaNova PLC

LivaNova PLC - Overview
LivaNova PLC - Business segments
LivaNova PLC - Key offerings
LivaNova PLC - Segment focus
SWOT

15.11 Medtronic Plc

Medtronic Plc - Overview
Medtronic Plc - Business segments
Medtronic Plc - Key news
Medtronic Plc - Key offerings
Medtronic Plc - Segment focus
SWOT

15.12 MicroPort Scientific Corp.

MicroPort Scientific Corp. - Overview
MicroPort Scientific Corp. - Business segments
MicroPort Scientific Corp. - Key offerings
MicroPort Scientific Corp. - Segment focus
SWOT

15.13 Nihon Kohden Corp.

Nihon Kohden Corp. - Overview
Nihon Kohden Corp. - Business segments
Nihon Kohden Corp. - Key offerings
Nihon Kohden Corp. - Segment focus
SWOT

15.14 Penumbra Inc.

Penumbra Inc. - Overview
Penumbra Inc. - Product / Service
Penumbra Inc. - Key offerings
SWOT

15.15 Siemens Healthineers AG

Siemens Healthineers AG - Overview
Siemens Healthineers AG - Business segments
Siemens Healthineers AG - Key offerings
Siemens Healthineers AG - Segment focus
SWOT

15.16 Stryker Corp.

Stryker Corp. - Overview
Stryker Corp. - Business segments
Stryker Corp. - Key offerings
Stryker Corp. - Segment focus
SWOT

15.17 Terumo Corp.

Terumo Corp. - Overview
Terumo Corp. - Business segments
Terumo Corp. - Key news
Terumo Corp. - Key offerings
Terumo Corp. - Segment focus
SWOT

15.18 Zimmer Biomet Holdings Inc.

Zimmer Biomet Holdings Inc. - Overview
Zimmer Biomet Holdings Inc. - Business segments
Zimmer Biomet Holdings Inc. - Key news
Zimmer Biomet Holdings Inc. - Key offerings
Zimmer Biomet Holdings Inc. - Segment focus
SWOT

16. Appendix

16.1 Scope of the report

Market definition
Objectives
Notes and caveats

16.2 Inclusions and exclusions checklist

Inclusions checklist
Exclusions checklist

16.3 Currency conversion rates for US$

16.4 Research methodology

16.5 Data procurement

Information sources

16.6 Data validation

16.7 Validation techniques employed for market sizing

16.8 Data synthesis

16.9 360 degree market analysis

16.10 List of abbreviations

Research Methodology

Technavio presents a detailed picture of the market by way of study, synthesis, and summation of data from multiple sources. The analysts have presented the various facets of the market with a particular focus on identifying the key industry influencers. The data thus presented is comprehensive, reliable, and the result of extensive research, both primary and secondary.

INFORMATION SOURCES

Primary sources

  • Manufacturers and suppliers
  • Channel partners
  • Industry experts
  • Strategic decision makers

Secondary sources

  • Industry journals and periodicals
  • Government data
  • Financial reports of key industry players
  • Historical data
  • Press releases

DATA ANALYSIS

Data Synthesis

  • Collation of data
  • Estimation of key figures
  • Analysis of derived insights

Data Validation

  • Triangulation with data models
  • Reference against proprietary databases
  • Corroboration with industry experts

REPORT WRITING

Qualitative

  • Market drivers
  • Market challenges
  • Market trends
  • Five forces analysis

Quantitative

  • Market size and forecast
  • Market segmentation
  • Geographical insights
  • Competitive landscape

Interested in this report?

Get your sample now to see our research methodology and insights!

Download Now

Frequently Asked Questions

Neurology Devices market growth will increase by USD 8942.9 million during 2026-2030.

The Neurology Devices market is expected to grow at a CAGR of 8.5% during 2026-2030.

Neurology Devices market is segmented by End-user (Hospitals, ASCs, Others) Product (Neurostimulation devices, Interventional neurology devices, Neurosurgery devices, Cerevrospinal fluid management devices, Others) Application (Ischemic strokes, Cerebral aneurysms, Carotid artery stenosis, Fistulas, Others)

Abbott Laboratories, B.Braun SE, Boston Scientific Corp., Brainlab AG, electroCore Inc., GE HealthCare Technologies, Integra LifeSciences Corp., Johnson and Johnson, LivaNova PLC, Medtronic Plc, MicroPort Scientific Corp., Natus Medical Inc., NeuroPace Inc., Nexstim Plc, Nihon Kohden Corp., Penumbra Inc., Siemens Healthineers AG, Stryker Corp., Terumo Corp., Zimmer Biomet Holdings Inc. are a few of the key vendors in the Neurology Devices market.

North America will register the highest growth rate of 39.6% among the other regions. Therefore, the Neurology Devices market in North America is expected to garner significant business opportunities for the vendors during the forecast period.

US, Canada, Mexico, Germany, UK, France, Italy, Spain, The Netherlands, China, Japan, India, South Korea, Indonesia, Thailand, Brazil, Saudi Arabia, Turkey, UAE, Argentina, Colombia, South Africa, Israel

  • Rising global prevalence of neurodegenerative disorders driving mass demand for advanced therapeutic technologies is the driving factor this market.

The Neurology Devices market vendors should focus on grabbing business opportunities from the End-user segment as it accounted for the largest market share in the base year.
RIA - Research AI Assistant
Ask RIA
