
Next Generation Integrated Circuit (IC) Market Analysis, Size, and Forecast 2026-2030: APAC (China, Taiwan, and South Korea), North America (US, Canada, and Mexico), Europe (Germany, France, and The Netherlands), Middle East and Africa (Israel, UAE, and Saudi Arabia), South America (Brazil, Argentina, and Colombia), and Rest of World (ROW)

Next Generation Integrated Circuit (IC) Market Analysis, Size, and Forecast 2026-2030:
APAC (China, Taiwan, and South Korea), North America (US, Canada, and Mexico), Europe (Germany, France, and The Netherlands), Middle East and Africa (Israel, UAE, and Saudi Arabia), South America (Brazil, Argentina, and Colombia), and Rest of World (ROW)

Published: Oct 2026 315 Pages SKU: IRTNTR81770

Market Overview at a Glance

$2.01 B
Market Opportunity
14.7%
CAGR 2025 - 2030
46%
APAC Growth
$1.04 B
Digital integrated circuits segment 2024

Next Generation Integrated Circuit (Ic) Market Size 2026-2030

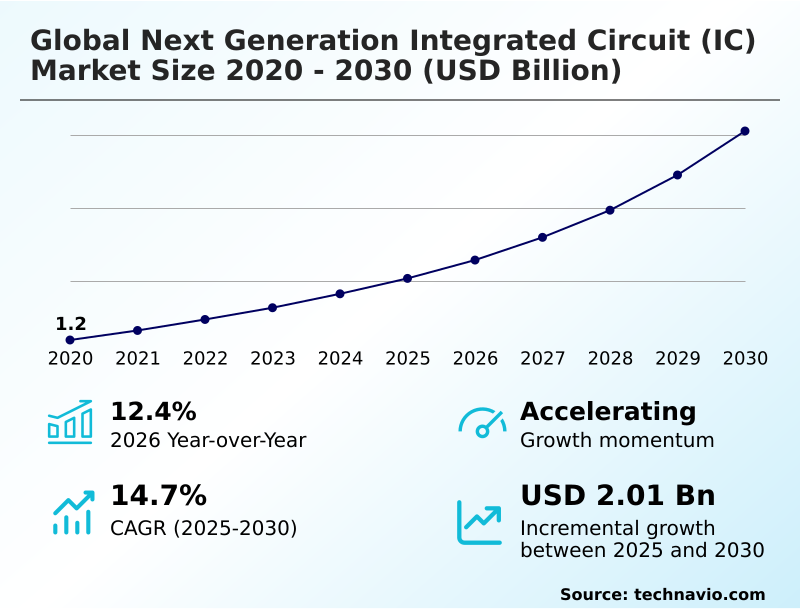
The next generation integrated circuit (ic) market size is valued to increase by USD 2.01 billion, at a CAGR of 14.7% from 2025 to 2030. Explosive proliferation of edge AI accelerators will drive the next generation integrated circuit (ic) market.

Major Market Trends & Insights

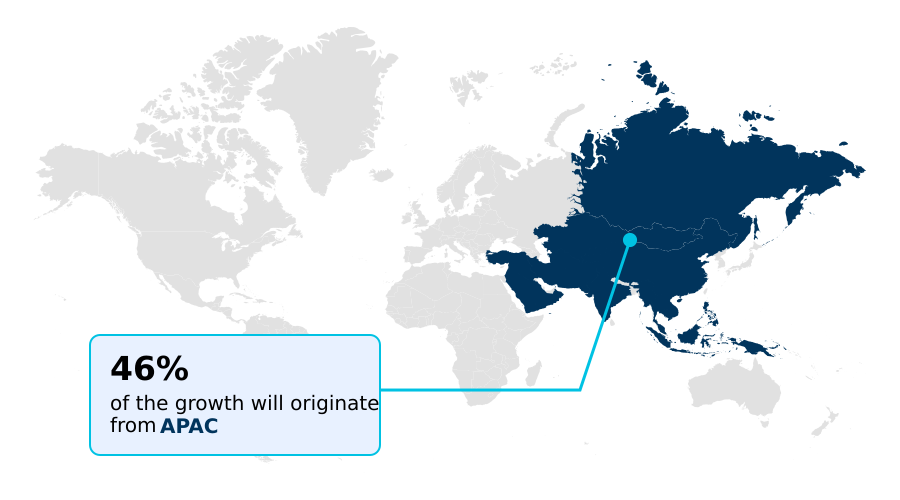
  • APAC dominated the market and accounted for a 46% growth during the forecast period.
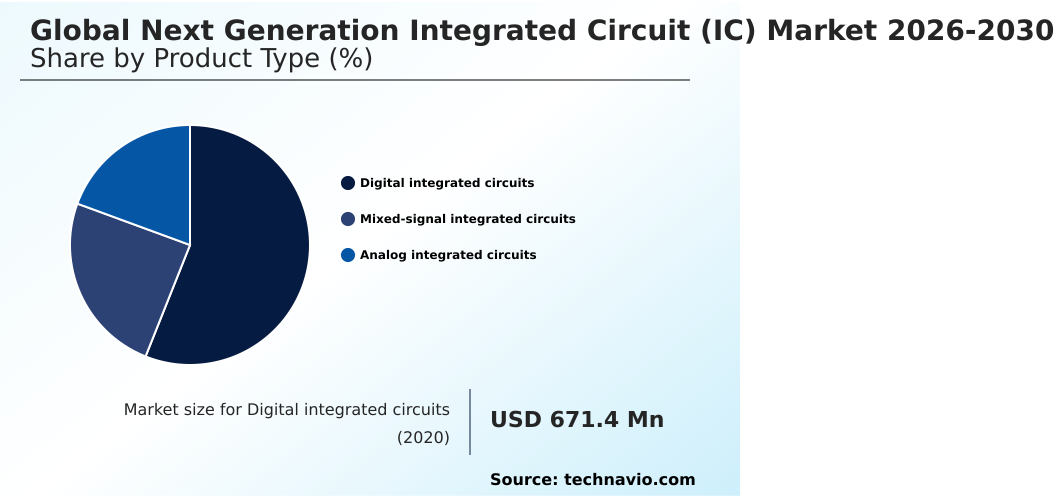
  • By Product Type - Digital integrated circuits segment was valued at USD 1.04 billion in 2024
  • By Technology - Beyond 7nm segment accounted for the largest market revenue share in 2024

Market Size & Forecast

  • Market Opportunities: USD 2.85 billion
  • Market Future Opportunities: USD 2.01 billion
  • CAGR from 2025 to 2030 : 14.7%

Market Summary

  • The Next Generation Integrated Circuit (IC) ecosystem is undergoing a fundamental architectural transformation driven by the extreme computational demands of modern digital infrastructure. As enterprise workloads migrate to the edge, the integration of neural processing units directly onto silicon dies enables localized, real-time data analysis.
  • For instance, in automated manufacturing supply chains, implementing multi chiplet packaging solutions reduces system latency, allowing robotics to execute instantaneous predictive maintenance diagnostics. This modular approach yields a 30% reduction in chip fabrication waste compared to traditional monolithic silicon fabrication. The market is primarily propelled by the explosive proliferation of artificial intelligence accelerators, which decentralize processing and reduce bandwidth consumption.
  • Conversely, severe thermal management hurdles in three-dimensional stacking act as a critical challenge, causing structural micro-cracking during extreme thermal ranges. As foundries invest heavily in electronic design automation to mitigate these thermal anomalies, advanced heterogeneous integration remains central to scaling transistor density without compromising operational integrity.

What will be the Size of the Next Generation Integrated Circuit (Ic) Market during the forecast period?
Get Key Insights on Market Forecast (PDF) Get Free Sample

How is the Next Generation Integrated Circuit (Ic) Market Segmented?

The next generation integrated circuit (ic) industry research report provides comprehensive data (region-wise segment analysis), with forecasts and estimates in "USD million" for the period 2026-2030, as well as historical data from 2020-2024 for the following segments.

  • Product type
    • Digital integrated circuits
    • Mixed-signal integrated circuits
    • Analog integrated circuits
  • Technology
    • Beyond 7nm
    • More than 5nm to 7nm
    • Below 3nm and 3nm
  • End-user
    • IT and telecommunications
    • Consumer electronics
    • Automotive
    • Healthcare
    • Others
  • Geography
    • APAC
      • China
      • Taiwan
      • South Korea
      • Japan
      • Singapore
      • India
    • North America
      • US
      • Canada
      • Mexico
    • Europe
      • Germany
      • France
      • The Netherlands
      • UK
      • Italy
      • Spain
    • Middle East and Africa
      • Israel
      • UAE
      • Saudi Arabia
      • South Africa
      • Turkey
    • South America
      • Brazil
      • Argentina
      • Colombia

By Product Type Insights

The digital integrated circuits segment is estimated to witness significant growth during the forecast period.

Digital integrated circuits form the architectural foundation of the Next Generation Integrated Circuit (IC) ecosystem, executing complex logic operations for enterprise computing.

Driven by the need for zero latency inferences in edge computing architecture, micro-architects are transitioning to gate all around nanosheet logic, drastically reducing leakage current.

This shift to advanced packaging enables a 15% improvement in processing throughput compared to legacy finfet transistor topologies. Furthermore, application specific integrated circuits handle deep learning matrix multiplications efficiently, minimizing thermal dissipation.

The integration of static random access memory arrays directly onto the processing die eliminates data transfer bottlenecks, which improves overall power efficiency by 20%.

As autonomous automotive platforms demand rigorous real-time computation, digital logic components enforce strict functional safety standards, making them indispensable for next-generation hardware software co design frameworks.
Get Free Sample

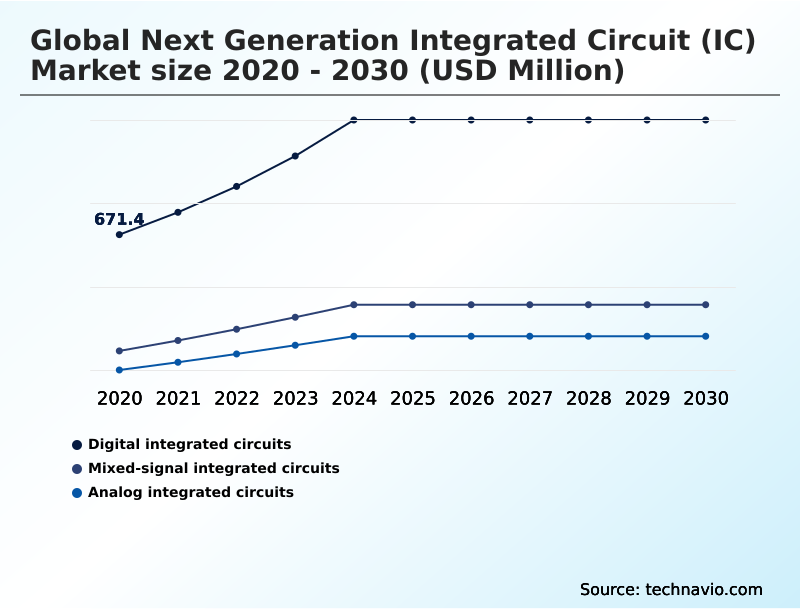
The Digital integrated circuits segment was valued at USD 1.04 billion in 2024 and showed a gradual increase during the forecast period.
Get Free Sample

Regional Analysis

APAC is estimated to contribute 46% to the growth of the global market during the forecast period.Technavio’s analysts have elaborately explained the regional trends and drivers that shape the market during the forecast period.
See How Next Generation Integrated Circuit (Ic) Market Demand is Rising in APAC Get Free Sample

The Next Generation Integrated Circuit (IC) landscape exhibits stark regional variations heavily influenced by manufacturing infrastructure and state-backed technological sovereignty initiatives.

APAC commands the manufacturing forefront, leveraging established foundry clusters and massive raw material pipelines to produce complementary field effect transistor architectures at scale.

By centralizing wafer fabrication and testing, foundries in APAC achieve a 25% cost reduction in production overhead compared to facilities in North America.

North America focuses primarily on intellectual property creation and fabless design, pioneering generative artificial intelligence hardware and universal chiplet interconnect express protocols.

The implementation of automated yield-tracking software in North American fabs has improved defect detection by 18%, partially offsetting higher labor costs.

While APAC excels in high-volume production of mixed signal devices and dynamic random access memory, North America prioritizes customized application-specific hardware, creating a highly interdependent global supply chain characterized by distinct regional competencies.

Market Dynamics

Our researchers analyzed the data with 2025 as the base year, along with the key drivers, trends, and challenges. A holistic analysis of drivers will help companies refine their marketing strategies to gain a competitive advantage.

  • The Next Generation Integrated Circuit (IC) sector is rapidly transitioning to overcome the physical barriers of Moore's Law, fundamentally redefining enterprise hardware capabilities. Foundries are aggressively implementing gate all around nanosheet fabrication to mitigate electron leakage, achieving superior electrostatic control over legacy architectures.
  • As monolithic scaling reaches prohibitive cost thresholds, designers are pivoting toward chiplet based heterogeneous packaging architecture, partitioning distinct logic and memory functions onto specialized silicon tiles. This modular strategy drastically improves production yield, delivering a 40% enhancement in hardware customization speed for supply chain procurement teams matching specific enterprise workloads.
  • Furthermore, pushing physical boundaries requires extreme ultraviolet lithography multipatterning to etch sub-three-nanometer geometries accurately, though this exponentially increases cleanroom operational complexity. To support the electrification of transport and renewable energy grids, manufacturers rely heavily on wide bandgap compound semiconductor materials, enabling power modules to handle significantly higher voltages with minimal thermal loss.
  • Simultaneously, AI-driven data centers require massive data throughput, driving the adoption of high bandwidth memory memory stacks that sit adjacent to processing cores, effectively eliminating latency bottlenecks. By harmonizing these disparate technologies, the integrated circuit landscape ensures sustained computational evolution, equipping industries with the resilient silicon necessary for autonomous and highly automated futures.
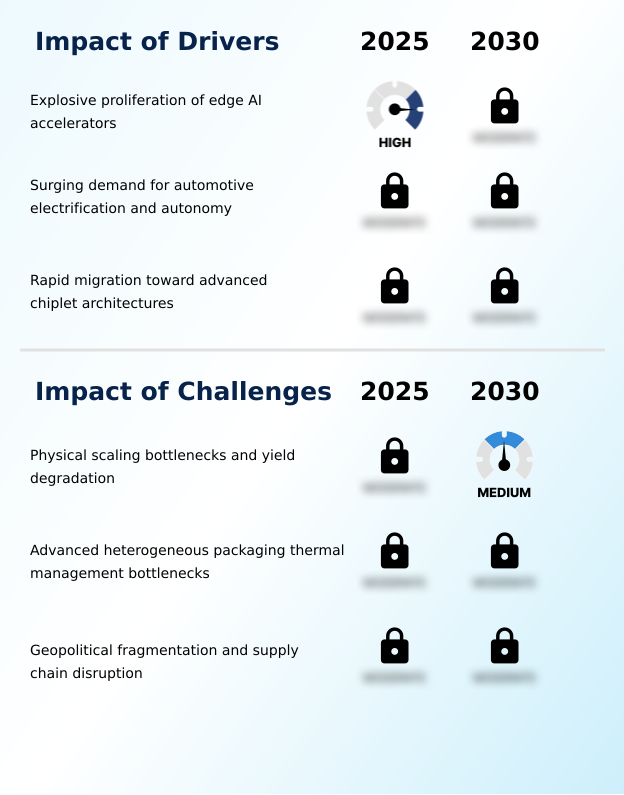
What are the key market drivers leading to the rise in the adoption of Next Generation Integrated Circuit (Ic) Industry?

  • The explosive proliferation of edge artificial intelligence accelerators serves as a primary driver, fundamentally decentralizing computational workloads from cloud data centers directly to localized endpoint devices.

  • The Next Generation Integrated Circuit (IC) demand is heavily catalyzed by the relentless expansion of generative artificial intelligence and the decentralization of enterprise data processing.
  • The imperative to execute complex deep learning matrix multiplications requires processors that deliver maximum teraflops per watt. Consequently, the proliferation of specialized neural processing units has reduced centralized server reliance, lowering network transmission costs by 20%.
  • Simultaneously, the rapid evolution of autonomous automotive platforms mandates real-time sensor fusion, necessitating highly reliable application specific integrated circuits.
  • The integration of zero latency inferences into industrial robotics has improved predictive maintenance accuracy by 15%, driving rapid behavioral shifts across manufacturing operations. This continuous need for localized, low-power intelligence compels foundries to accelerate sub-nanometer node commercialization.

What are the market trends shaping the Next Generation Integrated Circuit (Ic) Industry?

  • The mass acceleration of domain-specific semiconductor architectures represents a pivotal market trend. This structural shift prioritizes customized processing pipelines to maximize computational throughput and energy efficiency.

  • The Next Generation Integrated Circuit (IC) ecosystem is structurally shifting toward heterogeneous integration, fundamentally altering how enterprise hardware is conceptualized and assembled. By fracturing massive monolithic dies into specialized functional blocks, semiconductor designers utilize multi chiplet packaging to optimize each component on its most efficient process node.
  • This modular trend reduces initial prototype design cycle times by 30%, allowing product teams to rapidly adapt to shifting algorithmic demands. Furthermore, the structural adoption of compound semiconductor materials, specifically gallium nitride, has revolutionized power delivery networks, enabling a 25% improvement in thermal dissipation management.
  • As hyperscale cloud infrastructure demands unprecedented computational density, these advanced packaging techniques allow for the seamless incorporation of high bandwidth memory directly alongside processing units, drastically lowering latency.

What challenges does the Next Generation Integrated Circuit (Ic) Industry face during its growth?

  • Physical scaling bottlenecks and subsequent yield degradation present substantial industry challenges as manufacturing processes approach the extreme limits of sub-nanometer lithography.

  • The Next Generation Integrated Circuit (IC) architecture faces severe operational limitations associated with sub-nanometer physical scaling and advanced heterogeneous packaging. As fabricators transition to gate all around nanosheet designs, they encounter extreme thermal expansion coefficient mismatches among stacked silicon dies and organic interposers.
  • These structural stresses induce mechanical warpage during reflow cycles, which can degrade overall production yields by 18% in early commercialization phases. Additionally, the astronomical non recurring engineering costs associated with extreme ultraviolet lithography mask sets create formidable barriers for emerging fabless designers.
  • The intense localized heat accumulation in tightly packed artificial intelligence accelerators necessitates complex backside power delivery networks, increasing design verification times by 25% and delaying enterprise time-to-market for mission-critical hardware.

Exclusive Technavio Analysis on Customer Landscape

The next generation integrated circuit (ic) market forecasting report includes the adoption lifecycle of the market, covering from the innovator’s stage to the laggard’s stage. It focuses on adoption rates in different regions based on penetration. Furthermore, the next generation integrated circuit (ic) market report also includes key purchase criteria and drivers of price sensitivity to help companies evaluate and develop their market growth analysis strategies.
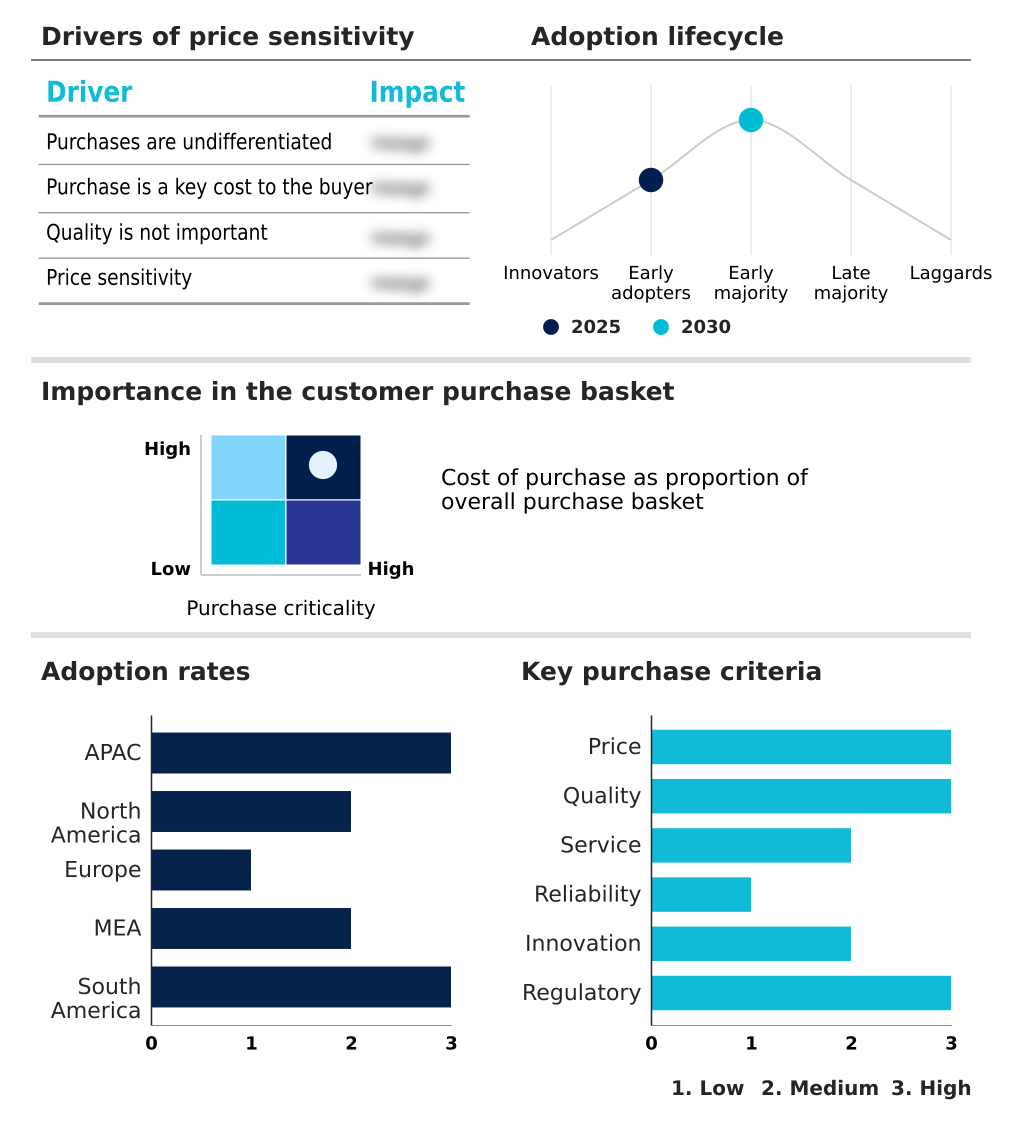
Customer Landscape of Next Generation Integrated Circuit (Ic) Industry

Competitive Landscape

Companies are implementing various strategies, such as strategic alliances, next generation integrated circuit (ic) market forecast, partnerships, mergers and acquisitions, geographical expansion, and product/service launches, to enhance their presence in the industry.

Advanced Micro Devices Inc. - The provider delivers high-performance Next Generation Integrated Circuit (IC) solutions, including advanced server processors, enterprise accelerators, and adaptive system-on-chip architectures optimized for robust computing environments.

The industry research and growth report includes detailed analyses of the competitive landscape of the market and information about key companies, including:

  • Advanced Micro Devices Inc.
  • Analog Devices Inc.
  • Broadcom Inc.
  • GlobalFoundaries Inc.
  • Infineon Technologies AG
  • Intel Corp.
  • Marvell Technology Inc.
  • MediaTek Inc.
  • Micron Technology Inc.
  • Navitas Semiconductor Inc.
  • NVIDIA Corp.
  • NXP Semiconductors NV
  • ON Semiconductor Corp.
  • Qualcomm Inc.
  • Renesas Electronics Corp.
  • Samsung Electronics Co. Ltd.
  • Sony Semiconductor Solutions
  • STMicroelectronics NV
  • Taiwan Semiconductor Co. Ltd.
  • Texas Instruments Inc.

Qualitative and quantitative analysis of companies has been conducted to help clients understand the wider business environment as well as the strengths and weaknesses of key industry players. Data is qualitatively analyzed to categorize companies as pure play, category-focused, industry-focused, and diversified; it is quantitatively analyzed to categorize companies as dominant, leading, strong, tentative, and weak.

Recent Development and News in Next generation integrated circuit (ic) market

  • In the Semiconductors industry, the rapid deployment of hyperscale cloud infrastructure has forced operators to adopt high bandwidth memory, directly impacting Next Generation Integrated Circuit (IC) demand by increasing requirements for ultra-fast interconnects.
  • The mandatory transition to zero trust governance models across global enterprise networks has necessitated embedded hardware root of trust implementations, pulling demand for Next Generation Integrated Circuit (IC) components that offer physical unclonable functions.
  • Structural power management mandates within electric vehicle manufacturing have accelerated the use of wide bandgap materials, significantly increasing the adoption of Next Generation Integrated Circuit (IC) solutions fabricated with silicon carbide.
  • The continuous miniaturization of telecommunications backhaul networks has pushed foundries toward extreme ultraviolet lithography, boosting Next Generation Integrated Circuit (IC) supply capabilities by reducing mask-set complexities by 25%.

Dive into Technavio’s robust research methodology, blending expert interviews, extensive data synthesis, and validated models for unparalleled Next Generation Integrated Circuit (Ic) Market insights. See full methodology.

Market Scope
Page number 315
Base year 2025
Historic period 2020-2024
Forecast period 2026-2030
Growth momentum & CAGR Accelerate at a CAGR of 14.7%
Market growth 2026-2030 USD 2010.3 million
Market structure Fragmented
YoY growth 2025-2026(%) 12.4%
Key countries China, Taiwan, South Korea, Japan, Singapore, India, US, Canada, Mexico, Germany, France, The Netherlands, UK, Italy, Spain, Israel, UAE, Saudi Arabia, South Africa, Turkey, Brazil, Argentina and Colombia
Competitive landscape Leading Companies, Market Positioning of Companies, Competitive Strategies, and Industry Risks

Request Free Sample

Research Analyst Overview

  • The Next Generation Integrated Circuit (IC) environment is navigating a critical transition from general-purpose processing to highly specialized, workload-specific silicon optimization. Enterprise architects are aggressively deploying neuromorphic computing paradigms to execute complex sensory data fusion with unprecedented energy efficiency.
  • This architectural pivot directly influences corporate product strategy, enabling hardware vendors to reduce edge device power consumption by 35% while maintaining robust processing capabilities. The continuous evolution of silicon photonics has revolutionized inter-chip communication, virtually eliminating the electromagnetic interference associated with conventional copper traces.
  • Additionally, integrating hardware root of trust modules into the silicon layer resolves critical enterprise compliance requirements, ensuring unalterable hardware identity in high-risk operational sectors. The adoption of double data rate memory interfaces ensures that localized computational clusters can handle surging data volumes without incurring latency penalties.
  • As physical manufacturing boundaries tighten, the utilization of electronic design automation tools allows engineers to simulate advanced packaging thermals pre-fabrication, reducing costly design iterations and accelerating the commercialization of mission-critical processing hardware.

What are the Key Data Covered in this Next Generation Integrated Circuit (Ic) Market Research and Growth Report?

  • What is the expected growth of the Next Generation Integrated Circuit (Ic) Market between 2026 and 2030?

    • USD 2.01 billion, at a CAGR of 14.7%

  • What segmentation does the market report cover?

    • The report is segmented by Product Type (Digital integrated circuits, Mixed-signal integrated circuits, and Analog integrated circuits), Technology (Beyond 7nm, More than 5nm to 7nm, and Below 3nm and 3nm), End-user (IT and telecommunications, Consumer electronics, Automotive, Healthcare, and Others) and Geography (APAC, North America, Europe, Middle East and Africa, South America)

  • Which regions are analyzed in the report?

    • APAC, North America, Europe, Middle East and Africa and South America

  • What are the key growth drivers and market challenges?

    • Explosive proliferation of edge AI accelerators, Physical scaling bottlenecks and yield degradation

  • Who are the major players in the Next Generation Integrated Circuit (Ic) Market?

    • Advanced Micro Devices Inc., Analog Devices Inc., Broadcom Inc., GlobalFoundaries Inc., Infineon Technologies AG, Intel Corp., Marvell Technology Inc., MediaTek Inc., Micron Technology Inc., Navitas Semiconductor Inc., NVIDIA Corp., NXP Semiconductors NV, ON Semiconductor Corp., Qualcomm Inc., Renesas Electronics Corp., Samsung Electronics Co. Ltd., Sony Semiconductor Solutions, STMicroelectronics NV, Taiwan Semiconductor Co. Ltd. and Texas Instruments Inc.

Market Research Insights

  • The Next Generation Integrated Circuit (IC) ecosystem is characterized by rapid technological displacement and localized processing demands. The transition toward on device artificial intelligence has revolutionized mobile computing, reducing latency by 40% and minimizing cloud data transmission costs.
  • Concurrently, the deployment of software defined vehicles has accelerated the integration of robust battery management system chips, improving energy conversion efficiency by 15% across electric mobility fleets. As optical transceiver controllers replace standard copper interconnects in data centers, rack-level bandwidth density increases by over 30%, alleviating critical transmission bottlenecks.
  • Driven by the imperative to establish zero trust governance models at the hardware level, silicon architects are systematically embedding advanced cryptographic engines directly into enterprise hardware frameworks.

We can help! Our analysts can customize this next generation integrated circuit (ic) market research report to meet your requirements.

Get in touch

1. Executive Summary

1.1 Market overview

Executive Summary - Chart on Market Overview
Executive Summary - Data Table on Market Overview
Executive Summary - Chart on Global Market Characteristics
Executive Summary - Chart on Market by Geography
Executive Summary - Chart on Market Segmentation by Product Type
Executive Summary - Chart on Market Segmentation by Technology
Executive Summary - Chart on Market Segmentation by End-user
Executive Summary - Chart on Incremental Growth
Executive Summary - Data Table on Incremental Growth
Executive Summary - Chart on Company Market Positioning

2. Technavio Analysis

2.1 Analysis of price sensitivity, lifecycle, customer purchase basket, adoption rates, and purchase criteria

2.2 Criticality of inputs and Factors of differentiation

Chart on Overview on criticality of inputs and factors of differentiation

2.3 Factors of disruption

Chart on Overview on factors of disruption

2.4 Impact of drivers and challenges

Chart on Impact of drivers and challenges in 2025 and 2030

3. Market Landscape

3.1 Market ecosystem

Chart on Parent Market
Data Table on - Parent Market

3.2 Market characteristics

Chart on Market characteristics analysis

3.3 Value chain analysis

Chart on Value chain analysis

4. Market Sizing

4.1 Market definition

Data Table on Offerings of companies included in the market definition

4.2 Market segment analysis

Market segments

4.3 Market size 2025

4.4 Market outlook: Forecast for 2025-2030

Chart on Global - Market size and forecast 2025-2030 ($ million)
Data Table on Global - Market size and forecast 2025-2030 ($ million)
Chart on Global Market: Year-over-year growth 2025-2030 (%)
Data Table on Global Market: Year-over-year growth 2025-2030 (%)

5. Historic Market Size

5.1 Global Next Generation Integrated Circuit (IC) Market 2020 - 2024

Historic Market Size - Data Table on Global Next Generation Integrated Circuit (IC) Market 2020 - 2024 ($ million)

5.2 Product Type segment analysis 2020 - 2024

Historic Market Size - Product Type Segment 2020 - 2024 ($ million)

5.3 Technology segment analysis 2020 - 2024

Historic Market Size - Technology Segment 2020 - 2024 ($ million)

5.4 End-user segment analysis 2020 - 2024

Historic Market Size - End-user Segment 2020 - 2024 ($ million)

5.5 Geography segment analysis 2020 - 2024

Historic Market Size - Geography Segment 2020 - 2024 ($ million)

5.6 Country segment analysis 2020 - 2024

Historic Market Size - Country Segment 2020 - 2024 ($ million)

6. Qualitative Analysis

6.1 Impact of AI on Global Next Generation Integrated Circuit (IC) Market

6.2 Impact of geopolitical conflicts on Global Next Generation Integrated Circuit (IC) Market

7. Five Forces Analysis

7.1 Five forces summary

Five forces analysis - Comparison between 2025 and 2030

7.2 Bargaining power of buyers

Bargaining power of buyers - Impact of key factors 2025 and 2030

7.3 Bargaining power of suppliers

Bargaining power of suppliers - Impact of key factors in 2025 and 2030

7.4 Threat of new entrants

Threat of new entrants - Impact of key factors in 2025 and 2030

7.5 Threat of substitutes

Threat of substitutes - Impact of key factors in 2025 and 2030

7.6 Threat of rivalry

Threat of rivalry - Impact of key factors in 2025 and 2030

7.7 Market condition

Chart on Market condition - Five forces 2025 and 2030

8. Market Segmentation by Product Type

8.1 Market segments

Chart on Product Type - Market share 2025-2030 (%)
Data Table on Product Type - Market share 2025-2030 (%)

8.2 Comparison by Product Type

Chart on Comparison by Product Type
Data Table on Comparison by Product Type

8.3 Digital integrated circuits - Market size and forecast 2025-2030

Chart on Digital integrated circuits - Market size and forecast 2025-2030 ($ million)
Data Table on Digital integrated circuits - Market size and forecast 2025-2030 ($ million)
Chart on Digital integrated circuits - Year-over-year growth 2025-2030 (%)
Data Table on Digital integrated circuits - Year-over-year growth 2025-2030 (%)

8.4 Mixed-signal integrated circuits - Market size and forecast 2025-2030

Chart on Mixed-signal integrated circuits - Market size and forecast 2025-2030 ($ million)
Data Table on Mixed-signal integrated circuits - Market size and forecast 2025-2030 ($ million)
Chart on Mixed-signal integrated circuits - Year-over-year growth 2025-2030 (%)
Data Table on Mixed-signal integrated circuits - Year-over-year growth 2025-2030 (%)

8.5 Analog integrated circuits - Market size and forecast 2025-2030

Chart on Analog integrated circuits - Market size and forecast 2025-2030 ($ million)
Data Table on Analog integrated circuits - Market size and forecast 2025-2030 ($ million)
Chart on Analog integrated circuits - Year-over-year growth 2025-2030 (%)
Data Table on Analog integrated circuits - Year-over-year growth 2025-2030 (%)

8.6 Market opportunity by Product Type

Market opportunity by Product Type ($ million)
Data Table on Market opportunity by Product Type ($ million)

9. Market Segmentation by Technology

9.1 Market segments

Chart on Technology - Market share 2025-2030 (%)
Data Table on Technology - Market share 2025-2030 (%)

9.2 Comparison by Technology

Chart on Comparison by Technology
Data Table on Comparison by Technology

9.3 Beyond 7nm - Market size and forecast 2025-2030

Chart on Beyond 7nm - Market size and forecast 2025-2030 ($ million)
Data Table on Beyond 7nm - Market size and forecast 2025-2030 ($ million)
Chart on Beyond 7nm - Year-over-year growth 2025-2030 (%)
Data Table on Beyond 7nm - Year-over-year growth 2025-2030 (%)

9.4 More than 5nm to 7nm - Market size and forecast 2025-2030

Chart on More than 5nm to 7nm - Market size and forecast 2025-2030 ($ million)
Data Table on More than 5nm to 7nm - Market size and forecast 2025-2030 ($ million)
Chart on More than 5nm to 7nm - Year-over-year growth 2025-2030 (%)
Data Table on More than 5nm to 7nm - Year-over-year growth 2025-2030 (%)

9.5 Below 3nm and 3nm - Market size and forecast 2025-2030

Chart on Below 3nm and 3nm - Market size and forecast 2025-2030 ($ million)
Data Table on Below 3nm and 3nm - Market size and forecast 2025-2030 ($ million)
Chart on Below 3nm and 3nm - Year-over-year growth 2025-2030 (%)
Data Table on Below 3nm and 3nm - Year-over-year growth 2025-2030 (%)

9.6 Market opportunity by Technology

Market opportunity by Technology ($ million)
Data Table on Market opportunity by Technology ($ million)

10. Market Segmentation by End-user

10.1 Market segments

Chart on End-user - Market share 2025-2030 (%)
Data Table on End-user - Market share 2025-2030 (%)

10.2 Comparison by End-user

Chart on Comparison by End-user
Data Table on Comparison by End-user

10.3 IT and telecommunications - Market size and forecast 2025-2030

Chart on IT and telecommunications - Market size and forecast 2025-2030 ($ million)
Data Table on IT and telecommunications - Market size and forecast 2025-2030 ($ million)
Chart on IT and telecommunications - Year-over-year growth 2025-2030 (%)
Data Table on IT and telecommunications - Year-over-year growth 2025-2030 (%)

10.4 Consumer electronics - Market size and forecast 2025-2030

Chart on Consumer electronics - Market size and forecast 2025-2030 ($ million)
Data Table on Consumer electronics - Market size and forecast 2025-2030 ($ million)
Chart on Consumer electronics - Year-over-year growth 2025-2030 (%)
Data Table on Consumer electronics - Year-over-year growth 2025-2030 (%)

10.5 Automotive - Market size and forecast 2025-2030

Chart on Automotive - Market size and forecast 2025-2030 ($ million)
Data Table on Automotive - Market size and forecast 2025-2030 ($ million)
Chart on Automotive - Year-over-year growth 2025-2030 (%)
Data Table on Automotive - Year-over-year growth 2025-2030 (%)

10.6 Healthcare - Market size and forecast 2025-2030

Chart on Healthcare - Market size and forecast 2025-2030 ($ million)
Data Table on Healthcare - Market size and forecast 2025-2030 ($ million)
Chart on Healthcare - Year-over-year growth 2025-2030 (%)
Data Table on Healthcare - Year-over-year growth 2025-2030 (%)

10.7 Others - Market size and forecast 2025-2030

Chart on Others - Market size and forecast 2025-2030 ($ million)
Data Table on Others - Market size and forecast 2025-2030 ($ million)
Chart on Others - Year-over-year growth 2025-2030 (%)
Data Table on Others - Year-over-year growth 2025-2030 (%)

10.8 Market opportunity by End-user

Market opportunity by End-user ($ million)
Data Table on Market opportunity by End-user ($ million)

11. Customer Landscape

11.1 Customer landscape overview

Analysis of price sensitivity, lifecycle, customer purchase basket, adoption rates, and purchase criteria

12. Geographic Landscape

12.1 Geographic segmentation

Chart on Market share by geography 2025-2030 (%)
Data Table on Market share by geography 2025-2030 (%)

12.2 Geographic comparison

Chart on Geographic comparison
Data Table on Geographic comparison

12.3 APAC - Market size and forecast 2025-2030

Chart on APAC - Market size and forecast 2025-2030 ($ million)
Data Table on APAC - Market size and forecast 2025-2030 ($ million)
Chart on APAC - Year-over-year growth 2025-2030 (%)
Data Table on APAC - Year-over-year growth 2025-2030 (%)
Chart on Regional Comparison - APAC
Data Table on Regional Comparison - APAC

12.3.1 China - Market size and forecast 2025-2030

Chart on China - Market size and forecast 2025-2030 ($ million)
Data Table on China - Market size and forecast 2025-2030 ($ million)
Chart on China - Year-over-year growth 2025-2030 (%)
Data Table on China - Year-over-year growth 2025-2030 (%)

12.3.2 Taiwan - Market size and forecast 2025-2030

Chart on Taiwan - Market size and forecast 2025-2030 ($ million)
Data Table on Taiwan - Market size and forecast 2025-2030 ($ million)
Chart on Taiwan - Year-over-year growth 2025-2030 (%)
Data Table on Taiwan - Year-over-year growth 2025-2030 (%)

12.3.3 South Korea - Market size and forecast 2025-2030

Chart on South Korea - Market size and forecast 2025-2030 ($ million)
Data Table on South Korea - Market size and forecast 2025-2030 ($ million)
Chart on South Korea - Year-over-year growth 2025-2030 (%)
Data Table on South Korea - Year-over-year growth 2025-2030 (%)

12.3.4 Japan - Market size and forecast 2025-2030

Chart on Japan - Market size and forecast 2025-2030 ($ million)
Data Table on Japan - Market size and forecast 2025-2030 ($ million)
Chart on Japan - Year-over-year growth 2025-2030 (%)
Data Table on Japan - Year-over-year growth 2025-2030 (%)

12.3.5 Singapore - Market size and forecast 2025-2030

Chart on Singapore - Market size and forecast 2025-2030 ($ million)
Data Table on Singapore - Market size and forecast 2025-2030 ($ million)
Chart on Singapore - Year-over-year growth 2025-2030 (%)
Data Table on Singapore - Year-over-year growth 2025-2030 (%)

12.3.6 India - Market size and forecast 2025-2030

Chart on India - Market size and forecast 2025-2030 ($ million)
Data Table on India - Market size and forecast 2025-2030 ($ million)
Chart on India - Year-over-year growth 2025-2030 (%)
Data Table on India - Year-over-year growth 2025-2030 (%)

12.4 North America - Market size and forecast 2025-2030

Chart on North America - Market size and forecast 2025-2030 ($ million)
Data Table on North America - Market size and forecast 2025-2030 ($ million)
Chart on North America - Year-over-year growth 2025-2030 (%)
Data Table on North America - Year-over-year growth 2025-2030 (%)
Chart on Regional Comparison - North America
Data Table on Regional Comparison - North America

12.4.1 US - Market size and forecast 2025-2030

Chart on US - Market size and forecast 2025-2030 ($ million)
Data Table on US - Market size and forecast 2025-2030 ($ million)
Chart on US - Year-over-year growth 2025-2030 (%)
Data Table on US - Year-over-year growth 2025-2030 (%)

12.4.2 Canada - Market size and forecast 2025-2030

Chart on Canada - Market size and forecast 2025-2030 ($ million)
Data Table on Canada - Market size and forecast 2025-2030 ($ million)
Chart on Canada - Year-over-year growth 2025-2030 (%)
Data Table on Canada - Year-over-year growth 2025-2030 (%)

12.4.3 Mexico - Market size and forecast 2025-2030

Chart on Mexico - Market size and forecast 2025-2030 ($ million)
Data Table on Mexico - Market size and forecast 2025-2030 ($ million)
Chart on Mexico - Year-over-year growth 2025-2030 (%)
Data Table on Mexico - Year-over-year growth 2025-2030 (%)

12.5 Europe - Market size and forecast 2025-2030

Chart on Europe - Market size and forecast 2025-2030 ($ million)
Data Table on Europe - Market size and forecast 2025-2030 ($ million)
Chart on Europe - Year-over-year growth 2025-2030 (%)
Data Table on Europe - Year-over-year growth 2025-2030 (%)
Chart on Regional Comparison - Europe
Data Table on Regional Comparison - Europe

12.5.1 Germany - Market size and forecast 2025-2030

Chart on Germany - Market size and forecast 2025-2030 ($ million)
Data Table on Germany - Market size and forecast 2025-2030 ($ million)
Chart on Germany - Year-over-year growth 2025-2030 (%)
Data Table on Germany - Year-over-year growth 2025-2030 (%)

12.5.2 France - Market size and forecast 2025-2030

Chart on France - Market size and forecast 2025-2030 ($ million)
Data Table on France - Market size and forecast 2025-2030 ($ million)
Chart on France - Year-over-year growth 2025-2030 (%)
Data Table on France - Year-over-year growth 2025-2030 (%)

12.5.3 The Netherlands - Market size and forecast 2025-2030

Chart on The Netherlands - Market size and forecast 2025-2030 ($ million)
Data Table on The Netherlands - Market size and forecast 2025-2030 ($ million)
Chart on The Netherlands - Year-over-year growth 2025-2030 (%)
Data Table on The Netherlands - Year-over-year growth 2025-2030 (%)

12.5.4 UK - Market size and forecast 2025-2030

Chart on UK - Market size and forecast 2025-2030 ($ million)
Data Table on UK - Market size and forecast 2025-2030 ($ million)
Chart on UK - Year-over-year growth 2025-2030 (%)
Data Table on UK - Year-over-year growth 2025-2030 (%)

12.5.5 Italy - Market size and forecast 2025-2030

Chart on Italy - Market size and forecast 2025-2030 ($ million)
Data Table on Italy - Market size and forecast 2025-2030 ($ million)
Chart on Italy - Year-over-year growth 2025-2030 (%)
Data Table on Italy - Year-over-year growth 2025-2030 (%)

12.5.6 Spain - Market size and forecast 2025-2030

Chart on Spain - Market size and forecast 2025-2030 ($ million)
Data Table on Spain - Market size and forecast 2025-2030 ($ million)
Chart on Spain - Year-over-year growth 2025-2030 (%)
Data Table on Spain - Year-over-year growth 2025-2030 (%)

12.6 Middle East and Africa - Market size and forecast 2025-2030

Chart on Middle East and Africa - Market size and forecast 2025-2030 ($ million)
Data Table on Middle East and Africa - Market size and forecast 2025-2030 ($ million)
Chart on Middle East and Africa - Year-over-year growth 2025-2030 (%)
Data Table on Middle East and Africa - Year-over-year growth 2025-2030 (%)
Chart on Regional Comparison - Middle East and Africa
Data Table on Regional Comparison - Middle East and Africa

12.6.1 Israel - Market size and forecast 2025-2030

Chart on Israel - Market size and forecast 2025-2030 ($ million)
Data Table on Israel - Market size and forecast 2025-2030 ($ million)
Chart on Israel - Year-over-year growth 2025-2030 (%)
Data Table on Israel - Year-over-year growth 2025-2030 (%)

12.6.2 UAE - Market size and forecast 2025-2030

Chart on UAE - Market size and forecast 2025-2030 ($ million)
Data Table on UAE - Market size and forecast 2025-2030 ($ million)
Chart on UAE - Year-over-year growth 2025-2030 (%)
Data Table on UAE - Year-over-year growth 2025-2030 (%)

12.6.3 Saudi Arabia - Market size and forecast 2025-2030

Chart on Saudi Arabia - Market size and forecast 2025-2030 ($ million)
Data Table on Saudi Arabia - Market size and forecast 2025-2030 ($ million)
Chart on Saudi Arabia - Year-over-year growth 2025-2030 (%)
Data Table on Saudi Arabia - Year-over-year growth 2025-2030 (%)

12.6.4 South Africa - Market size and forecast 2025-2030

Chart on South Africa - Market size and forecast 2025-2030 ($ million)
Data Table on South Africa - Market size and forecast 2025-2030 ($ million)
Chart on South Africa - Year-over-year growth 2025-2030 (%)
Data Table on South Africa - Year-over-year growth 2025-2030 (%)

12.6.5 Turkey - Market size and forecast 2025-2030

Chart on Turkey - Market size and forecast 2025-2030 ($ million)
Data Table on Turkey - Market size and forecast 2025-2030 ($ million)
Chart on Turkey - Year-over-year growth 2025-2030 (%)
Data Table on Turkey - Year-over-year growth 2025-2030 (%)

12.7 South America - Market size and forecast 2025-2030

Chart on South America - Market size and forecast 2025-2030 ($ million)
Data Table on South America - Market size and forecast 2025-2030 ($ million)
Chart on South America - Year-over-year growth 2025-2030 (%)
Data Table on South America - Year-over-year growth 2025-2030 (%)
Chart on Regional Comparison - South America
Data Table on Regional Comparison - South America

12.7.1 Brazil - Market size and forecast 2025-2030

Chart on Brazil - Market size and forecast 2025-2030 ($ million)
Data Table on Brazil - Market size and forecast 2025-2030 ($ million)
Chart on Brazil - Year-over-year growth 2025-2030 (%)
Data Table on Brazil - Year-over-year growth 2025-2030 (%)

12.7.2 Argentina - Market size and forecast 2025-2030

Chart on Argentina - Market size and forecast 2025-2030 ($ million)
Data Table on Argentina - Market size and forecast 2025-2030 ($ million)
Chart on Argentina - Year-over-year growth 2025-2030 (%)
Data Table on Argentina - Year-over-year growth 2025-2030 (%)

12.7.3 Colombia - Market size and forecast 2025-2030

Chart on Colombia - Market size and forecast 2025-2030 ($ million)
Data Table on Colombia - Market size and forecast 2025-2030 ($ million)
Chart on Colombia - Year-over-year growth 2025-2030 (%)
Data Table on Colombia - Year-over-year growth 2025-2030 (%)

12.8 Market opportunity by geography

Market opportunity by geography ($ million)
Data Tables on Market opportunity by geography ($ million)

13. Drivers, Challenges, and Opportunity

13.1 Market drivers

Explosive proliferation of edge AI accelerators
Surging demand for automotive electrification and autonomy
Rapid migration toward advanced chiplet architectures

13.2 Market challenges

Physical scaling bottlenecks and yield degradation
Advanced heterogeneous packaging thermal management bottlenecks
Geopolitical fragmentation and supply chain disruption

13.3 Impact of drivers and challenges

Impact of drivers and challenges in 2025 and 2030

13.4 Market opportunities

Mass acceleration of domain specific semiconductor architectures
Structural adoption of photonic integrated circuit architecture
Pervasive integration of automated hardware security architecture

14. Competitive Landscape

14.1 Overview

14.2

Overview on criticality of inputs and factors of differentiation

14.3 Landscape disruption

Overview on factors of disruption

14.4 Industry risks

Impact of key risks on business

15. Competitive Analysis

15.1 Companies profiled

Companies covered

15.2 Company ranking index

15.3 Market positioning of companies

Matrix on companies position and classification

15.4 Advanced Micro Devices Inc.

Advanced Micro Devices Inc. - Overview
Advanced Micro Devices Inc. - Business segments
Advanced Micro Devices Inc. - Key news
Advanced Micro Devices Inc. - Key offerings
Advanced Micro Devices Inc. - Segment focus
SWOT

15.5 Analog Devices Inc.

Analog Devices Inc. - Overview
Analog Devices Inc. - Business segments
Analog Devices Inc. - Key offerings
Analog Devices Inc. - Segment focus
SWOT

15.6 Broadcom Inc.

Broadcom Inc. - Overview
Broadcom Inc. - Business segments
Broadcom Inc. - Key news
Broadcom Inc. - Key offerings
Broadcom Inc. - Segment focus
SWOT

15.7 Infineon Technologies AG

Infineon Technologies AG - Overview
Infineon Technologies AG - Business segments
Infineon Technologies AG - Key news
Infineon Technologies AG - Key offerings
Infineon Technologies AG - Segment focus
SWOT

15.8 Intel Corp.

Intel Corp. - Overview
Intel Corp. - Business segments
Intel Corp. - Key news
Intel Corp. - Key offerings
Intel Corp. - Segment focus
SWOT

15.9 Marvell Technology Inc.

Marvell Technology Inc. - Overview
Marvell Technology Inc. - Product / Service
Marvell Technology Inc. - Key news
Marvell Technology Inc. - Key offerings
SWOT

15.10 MediaTek Inc.

MediaTek Inc. - Overview
MediaTek Inc. - Business segments
MediaTek Inc. - Key news
MediaTek Inc. - Key offerings
MediaTek Inc. - Segment focus
SWOT

15.11 NVIDIA Corp.

NVIDIA Corp. - Overview
NVIDIA Corp. - Business segments
NVIDIA Corp. - Key news
NVIDIA Corp. - Key offerings
NVIDIA Corp. - Segment focus
SWOT

15.12 NXP Semiconductors NV

NXP Semiconductors NV - Overview
NXP Semiconductors NV - Business segments
NXP Semiconductors NV - Key news
NXP Semiconductors NV - Key offerings
NXP Semiconductors NV - Segment focus
SWOT

15.13 ON Semiconductor Corp.

ON Semiconductor Corp. - Overview
ON Semiconductor Corp. - Business segments
ON Semiconductor Corp. - Key news
ON Semiconductor Corp. - Key offerings
ON Semiconductor Corp. - Segment focus
SWOT

15.14 Qualcomm Inc.

Qualcomm Inc. - Overview
Qualcomm Inc. - Business segments
Qualcomm Inc. - Key news
Qualcomm Inc. - Key offerings
Qualcomm Inc. - Segment focus
SWOT

15.15 Renesas Electronics Corp.

Renesas Electronics Corp. - Overview
Renesas Electronics Corp. - Business segments
Renesas Electronics Corp. - Key news
Renesas Electronics Corp. - Key offerings
Renesas Electronics Corp. - Segment focus
SWOT

15.16 Sony Semiconductor Solutions

Sony Semiconductor Solutions - Overview
Sony Semiconductor Solutions - Product / Service
Sony Semiconductor Solutions - Key offerings
SWOT

15.17 STMicroelectronics NV

STMicroelectronics NV - Overview
STMicroelectronics NV - Business segments
STMicroelectronics NV - Key news
STMicroelectronics NV - Key offerings
STMicroelectronics NV - Segment focus
SWOT

15.18 Texas Instruments Inc.

Texas Instruments Inc. - Overview
Texas Instruments Inc. - Business segments
Texas Instruments Inc. - Key news
Texas Instruments Inc. - Key offerings
Texas Instruments Inc. - Segment focus
SWOT

16. Appendix

16.1 Scope of the report

Market definition
Objectives
Notes and caveats

16.2 Inclusions and exclusions checklist

Inclusions checklist
Exclusions checklist

16.3 Currency conversion rates for US$

16.4 Research methodology

16.5 Data procurement

Information sources

16.6 Data validation

16.7 Validation techniques employed for market sizing

16.8 Data synthesis

16.9 360 degree market analysis

16.10 List of abbreviations

Research Methodology

Technavio presents a detailed picture of the market by way of study, synthesis, and summation of data from multiple sources. The analysts have presented the various facets of the market with a particular focus on identifying the key industry influencers. The data thus presented is comprehensive, reliable, and the result of extensive research, both primary and secondary.

INFORMATION SOURCES

Primary sources

  • Manufacturers and suppliers
  • Channel partners
  • Industry experts
  • Strategic decision makers

Secondary sources

  • Industry journals and periodicals
  • Government data
  • Financial reports of key industry players
  • Historical data
  • Press releases

DATA ANALYSIS

Data Synthesis

  • Collation of data
  • Estimation of key figures
  • Analysis of derived insights

Data Validation

  • Triangulation with data models
  • Reference against proprietary databases
  • Corroboration with industry experts

REPORT WRITING

Qualitative

  • Market drivers
  • Market challenges
  • Market trends
  • Five forces analysis

Quantitative

  • Market size and forecast
  • Market segmentation
  • Geographical insights
  • Competitive landscape

Interested in this report?

Get your sample now to see our research methodology and insights!

Download Now

Frequently Asked Questions

Next Generation Integrated Circuit (Ic) market growth will increase by USD 2010.3 million during 2026-2030.

The Next Generation Integrated Circuit (Ic) market is expected to grow at a CAGR of 14.7% during 2026-2030.

Next Generation Integrated Circuit (Ic) market is segmented by Product type (Digital integrated circuits, Mixed-signal integrated circuits, Analog integrated circuits) Technology (Beyond 7nm, More than 5nm to 7nm, Below 3nm and 3nm) End-user (IT and telecommunications, Consumer electronics, Automotive, Healthcare, Others)

Advanced Micro Devices Inc., Analog Devices Inc., Broadcom Inc., GlobalFoundaries Inc., Infineon Technologies AG, Intel Corp., Marvell Technology Inc., MediaTek Inc., Micron Technology Inc., Navitas Semiconductor Inc., NVIDIA Corp., NXP Semiconductors NV, ON Semiconductor Corp., Qualcomm Inc., Renesas Electronics Corp., Samsung Electronics Co. Ltd., Sony Semiconductor Solutions, STMicroelectronics NV, Taiwan Semiconductor Co. Ltd., Texas Instruments Inc. are a few of the key vendors in the Next Generation Integrated Circuit (Ic) market.

APAC will register the highest growth rate of 46% among the other regions. Therefore, the Next Generation Integrated Circuit (Ic) market in APAC is expected to garner significant business opportunities for the vendors during the forecast period.

China, Taiwan, South Korea, Japan, Singapore, India, US, Canada, Mexico, Germany, France, The Netherlands, UK, Italy, Spain, Israel, UAE, Saudi Arabia, South Africa, Turkey, Brazil, Argentina, Colombia

  • Explosive proliferation of edge AI accelerators is the driving factor this market.

The Next Generation Integrated Circuit (Ic) market vendors should focus on grabbing business opportunities from the Product type segment as it accounted for the largest market share in the base year.
RIA - Research AI Assistant
Ask RIA
