
Nutraceutical Ingredients Market Analysis, Size, and Forecast 2026-2030: APAC (China, India, and Japan), Europe (Germany, UK, and France), North America (US, Canada, and Mexico), South America (Brazil, Argentina, and Chile), Middle East and Africa (Saudi Arabia, UAE, and South Africa), and Rest of World (ROW)

Nutraceutical Ingredients Market Analysis, Size, and Forecast 2026-2030:
APAC (China, India, and Japan), Europe (Germany, UK, and France), North America (US, Canada, and Mexico), South America (Brazil, Argentina, and Chile), Middle East and Africa (Saudi Arabia, UAE, and South Africa), and Rest of World (ROW)

Published: Oct 2026 301 Pages SKU: IRTNTR43261

Market Overview at a Glance

$10.14 B
Market Opportunity
3.7%
CAGR 2025 - 2030
29.8%
North America Growth
$27.27 B
Functional food and beverage segment 2024

Nutraceutical Ingredients Market Size 2026-2030

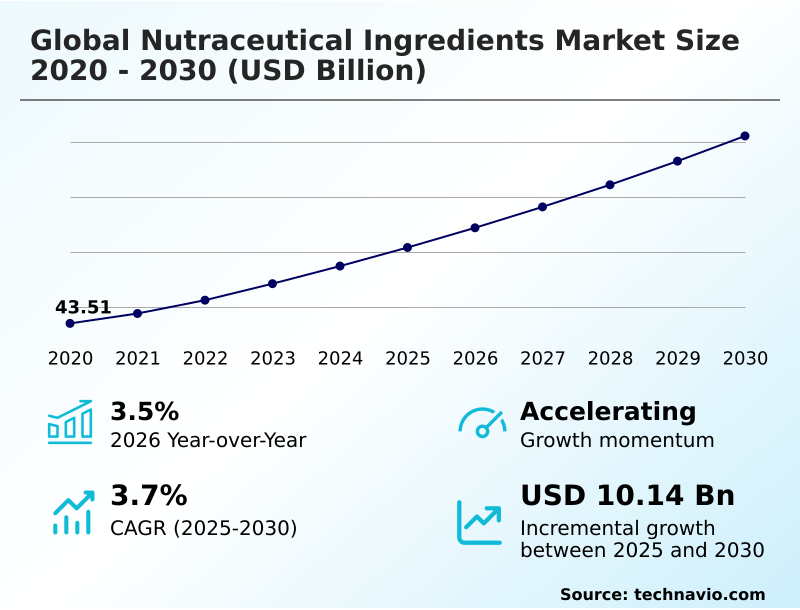
The nutraceutical ingredients market size is valued to increase by USD 10.14 billion, at a CAGR of 3.7% from 2025 to 2030. Rising demand for preventive healthcare and validated formulations will drive the nutraceutical ingredients market.

Major Market Trends & Insights

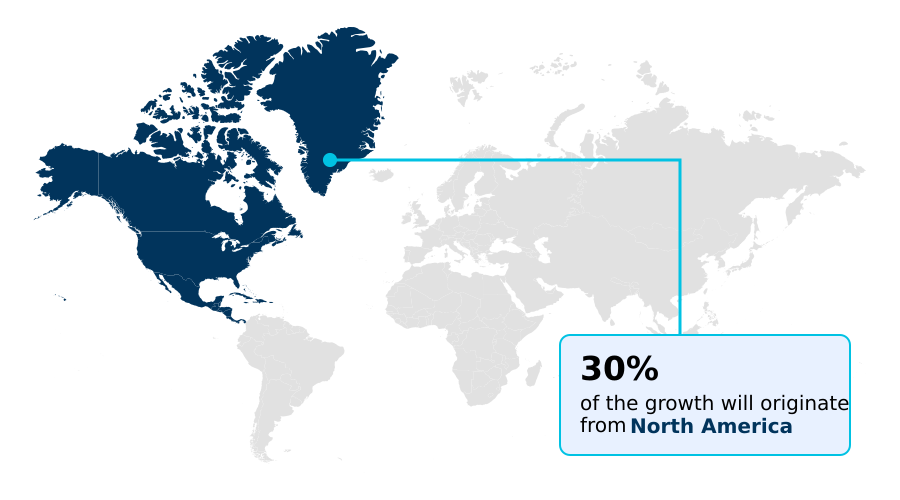
  • North America dominated the market and accounted for a 29.8% growth during the forecast period.
  • By Application - Functional food and beverage segment was valued at USD 27.27 billion in 2024
  • By Form Factor - Dry segment accounted for the largest market revenue share in 2024

Market Size & Forecast

  • Market Opportunities: USD 17.05 billion
  • Market Future Opportunities: USD 10.14 billion
  • CAGR from 2025 to 2030 : 3.7%

Market Summary

  • Nutraceutical Ingredients undergo continuous evolution as modern populations shift from reactive treatments toward proactive health management. This behavioral transformation drives the rapid integration of advanced biological compounds into daily dietary routines. Formulators increasingly rely on precision extraction to secure vital components that support immune resilience and metabolic function.
  • A major catalyst for this demand is the rising consumer preference for clinically validated formulations, compelling manufacturers to invest heavily in scientific substantiation to verify physiological efficacy. Conversely, the market faces significant operational constraints due to fragmented international regulatory frameworks. Establishing compliance across divergent legal jurisdictions significantly inflates administrative overhead and extends product launch timelines.
  • In response to supply chain volatility, processing facilities have implemented automated tracking protocols for raw botanical sourcing. This strategic operational upgrade has reduced raw material procurement delays by 18% compared to conventional manual auditing systems, ensuring continuous production of high-value components. Enhanced bioavailability protocols allow active compounds to withstand rigorous manufacturing conditions, directly improving final product stability.
  • The alignment of ethical sourcing with technological innovation ensures sustained integration of these specialized elements into everyday wellness regimens.

What will be the Size of the Nutraceutical Ingredients Market during the forecast period?
Get Key Insights on Market Forecast (PDF) Get Free Sample

How is the Nutraceutical Ingredients Market Segmented?

The nutraceutical ingredients industry research report provides comprehensive data (region-wise segment analysis), with forecasts and estimates in "USD million" for the period 2026-2030, as well as historical data from 2020-2024 for the following segments.

  • Application
    • Functional food and beverage
    • Dietary supplements
    • Others
  • Form factor
    • Dry
    • Liquid
  • Source
    • Plant-based
    • Animal-based
    • Others
  • Geography
    • APAC
      • China
      • India
      • Japan
      • South Korea
      • Australia
      • Indonesia
    • Europe
      • Germany
      • UK
      • France
      • Italy
      • Spain
      • The Netherlands
    • North America
      • US
      • Canada
      • Mexico
    • South America
      • Brazil
      • Argentina
      • Chile
    • Middle East and Africa
      • Saudi Arabia
      • UAE
      • South Africa
      • Egypt
      • Nigeria

By Application Insights

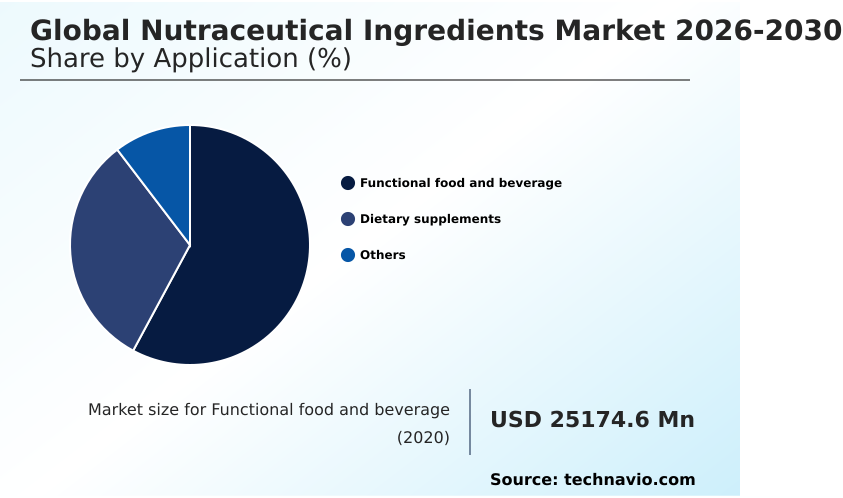
The functional food and beverage segment is estimated to witness significant growth during the forecast period.

The integration of specialized ingredients into daily dietary formats represents a structural shift toward proactive wellness management.

Manufacturers face distinct operational hurdles when formulating consumer products, particularly regarding thermal stability during intense processing and ensuring precise dosage uniformity without phase separation.

To overcome these barriers, formulators deploy advanced nanoemulsions and specialized carriers that enhance the solubility of hydrophobic active compounds. This technological shift has yielded a 22% improvement in batch consistency across high-speed packaging lines compared to traditional dry blending methods.

Consequently, organizations effectively scale the production of complex formulations containing human milk oligosaccharides and baker yeast beta glucans.

Supporting the broad vegan diet transition, these advanced processing techniques ensure that models for bioefficacy prediction translate directly into measurable physiological benefits, driving higher consumer retention in premium retail channels.
Get Free Sample

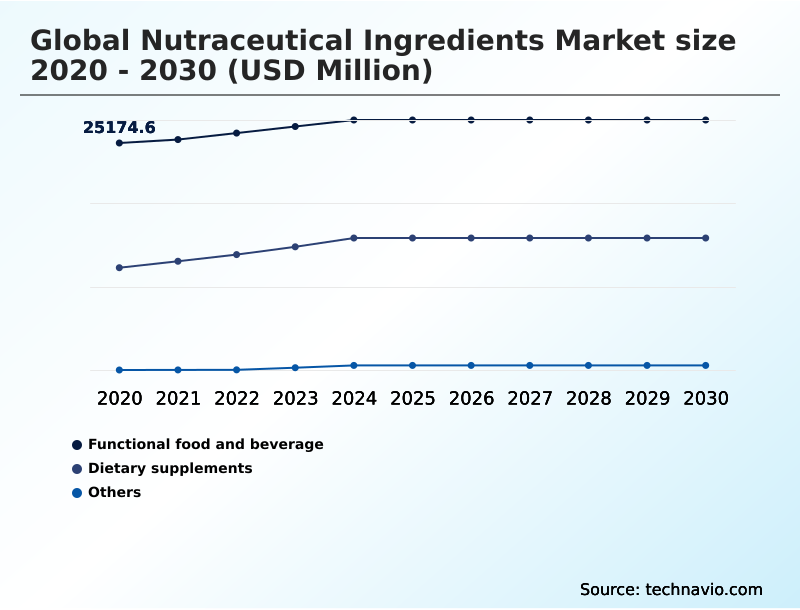
The Functional food and beverage segment was valued at USD 27.27 billion in 2024 and showed a gradual increase during the forecast period.
Get Free Sample

Regional Analysis

North America is estimated to contribute 29.8% to the growth of the global market during the forecast period.Technavio’s analysts have elaborately explained the regional trends and drivers that shape the market during the forecast period.
See How Nutraceutical Ingredients Market Demand is Rising in North America Get Free Sample

Regional supply chains for Nutraceutical Ingredients demonstrate distinct operational variances driven by consumer dietary sensitivities and established manufacturing infrastructure.

North America prioritizes the rapid commercialization of advanced probiotic cultures and hydrolyzed whey proteins, achieving a 28% higher adoption rate in sports nutrition applications compared to the European sector.

This efficiency stems from highly integrated domestic processing facilities that optimize the extraction of complex phytonutrients designed for oxidative stress reduction.

Conversely, Europe enforces stringent validation mandates for gut microbiome modulation claims, extending developmental timelines but yielding a 15% reduction in compliance-related product reformulations.

European formulators invest heavily in the sustainable isolation of fermented metabolites to achieve highly predictable, targeted outcomes that satisfy strict environmental standards.

By adapting to these regional nuances, multinational ingredient suppliers strategically allocate capital toward localized extraction hubs, reducing cross-border transit degradation by 12%.

Market Dynamics

Our researchers analyzed the data with 2025 as the base year, along with the key drivers, trends, and challenges. A holistic analysis of drivers will help companies refine their marketing strategies to gain a competitive advantage.

  • The continuous evolution of Nutraceutical Ingredients requires sophisticated manufacturing strategies to address complex consumer health demands and supply chain vulnerabilities. Modern formulators are actively transitioning away from conventional animal-derived sources, necessitating highly optimized plant based protein isolate extraction to ensure complete amino acid profiles and neutral sensory characteristics. Simultaneously, manufacturers must secure fragile micronutrients during intense manufacturing cycles.
  • Implementing advanced microencapsulated vitamin thermal stability processing protects delicate molecules from heat degradation, achieving a 35% higher active compound retention rate compared to traditional blending methods. This specific operational improvement directly reduces raw material overages and standardizes batch quality.
  • Furthermore, the industry is mitigating marine ecosystem depletion by scaling up algae derived omega fatty acid solutions, which offer a highly controlled, contaminant-free lipid supply. To accelerate product pipelines, research departments rely on ai powered novel bioactive discovery to digitally simulate molecular interactions, bypassing years of expensive manual laboratory screening.
  • This computational approach seamlessly integrates with advanced precision fermentation probiotic strain cultivation, allowing facilities to produce targeted, highly viable microbial cultures with minimal environmental footprint. By prioritizing these structural innovations, ingredient suppliers fortify their logistical resilience and compliance readiness, ensuring continuous delivery of highly efficacious wellness components to discerning international markets.
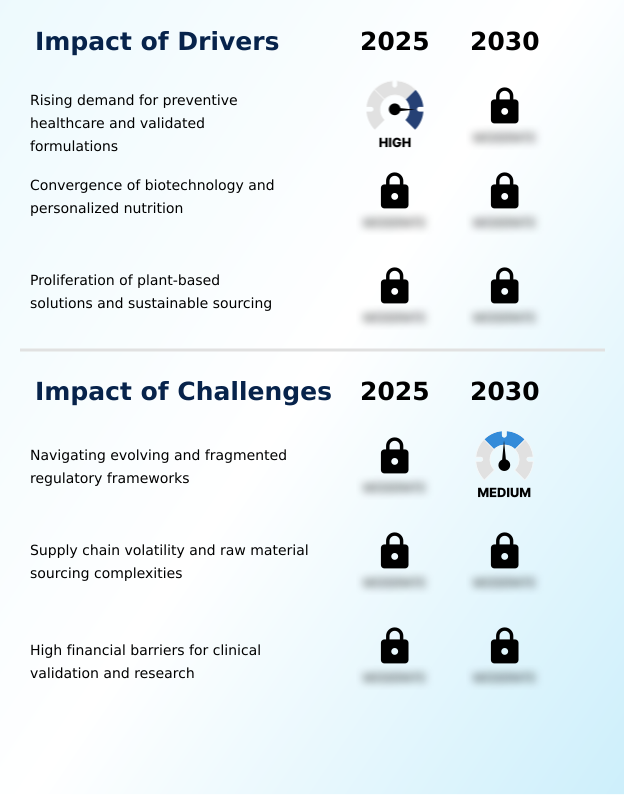
What are the key market drivers leading to the rise in the adoption of Nutraceutical Ingredients Industry?

  • The escalating demand for preventive healthcare solutions and clinically validated formulations acts as a primary catalyst accelerating market expansion.

  • The surging consumer mandate for targeted health optimization acts as a powerful driver accelerating the deployment of specialized Nutraceutical Ingredients.
  • Aging demographics and health-conscious professionals actively demand interventions that support cognitive performance, maintain joint mobility, and bolster both metabolic health and immune system resilience.
  • Because wild-harvesting rare herbs is ecologically taxing, manufacturers are shifting production methodologies toward precision fermentation and advanced cellular agriculture. This strategic operational pivot yields a 40% reduction in land and water resource utilization compared to traditional agricultural sourcing.
  • Furthermore, utilizing highly standardized botanical extracts and cultivating sustainable marine derived omega fatty acids minimizes supply chain disruption, improving raw material processing efficiency by 18%. By adopting these biotechnological processes, businesses secure a resilient, scalable supply of high-purity functional components.

What are the market trends shaping the Nutraceutical Ingredients Industry?

  • Rising global consumer focus on preventive wellness and immunity constitutes a primary trend shaping the industry landscape. This structural shift drives the continuous development of scientifically validated functional formulations.

  • The adoption of advanced delivery mechanisms represents a critical evolutionary trend within the Nutraceutical Ingredients sector. Formulators increasingly rely on microencapsulation technology and specialized liposomal structures because traditional raw extracts suffer from severe degradation in acidic digestive environments. This transition drives massive bioavailability enhancement, enabling a 32% improvement in systemic absorption.
  • Furthermore, research divisions are deploying digital twin technology to precisely map and predict pharmacokinetic behavior before physical manufacturing begins. This computational approach reduces formulation trial-and-error phases by 26%, accelerating the timeline for commercializing clean label formulations. By integrating these innovations, manufacturers efficiently cater to hyper-targeted personalized nutrition initiatives while simultaneously masking bitter tastes to improve overall sensory profiles.
  • Ultimately, these technological shifts allow businesses to deliver validated, high-performance nutritional interventions that command strong loyalty.

What challenges does the Nutraceutical Ingredients Industry face during its growth?

  • Navigating constantly evolving and heavily fragmented international regulatory frameworks remains a critical operational challenge that significantly constrains seamless global expansion.

  • Sourcing consistency and intense regulatory scrutiny present formidable challenges for the integration of Nutraceutical Ingredients. International food safety authorities mandate exhaustive health claims substantiation, forcing suppliers to conduct costly clinical trials to ensure strict regulatory compliance before commercialization. Simultaneously, manufacturers battle severe supply chain volatility driven by erratic climate patterns that disrupt the yield of raw natural inputs.
  • To stabilize operations, facilities are compelled to implement rigorous traceability frameworks and transition toward suppliers utilizing regenerative agricultural practices. Upgrading processing infrastructure to incorporate green extraction technologies and advanced microbial conversion methods increases initial capital expenditures but ultimately yields a 14% improvement in the recovery of high purity bioactives.
  • Overcoming these logistical barriers requires a 22% increase in dedicated quality assurance spending, heavily straining operational margins.

Exclusive Technavio Analysis on Customer Landscape

The nutraceutical ingredients market forecasting report includes the adoption lifecycle of the market, covering from the innovator’s stage to the laggard’s stage. It focuses on adoption rates in different regions based on penetration. Furthermore, the nutraceutical ingredients market report also includes key purchase criteria and drivers of price sensitivity to help companies evaluate and develop their market growth analysis strategies.
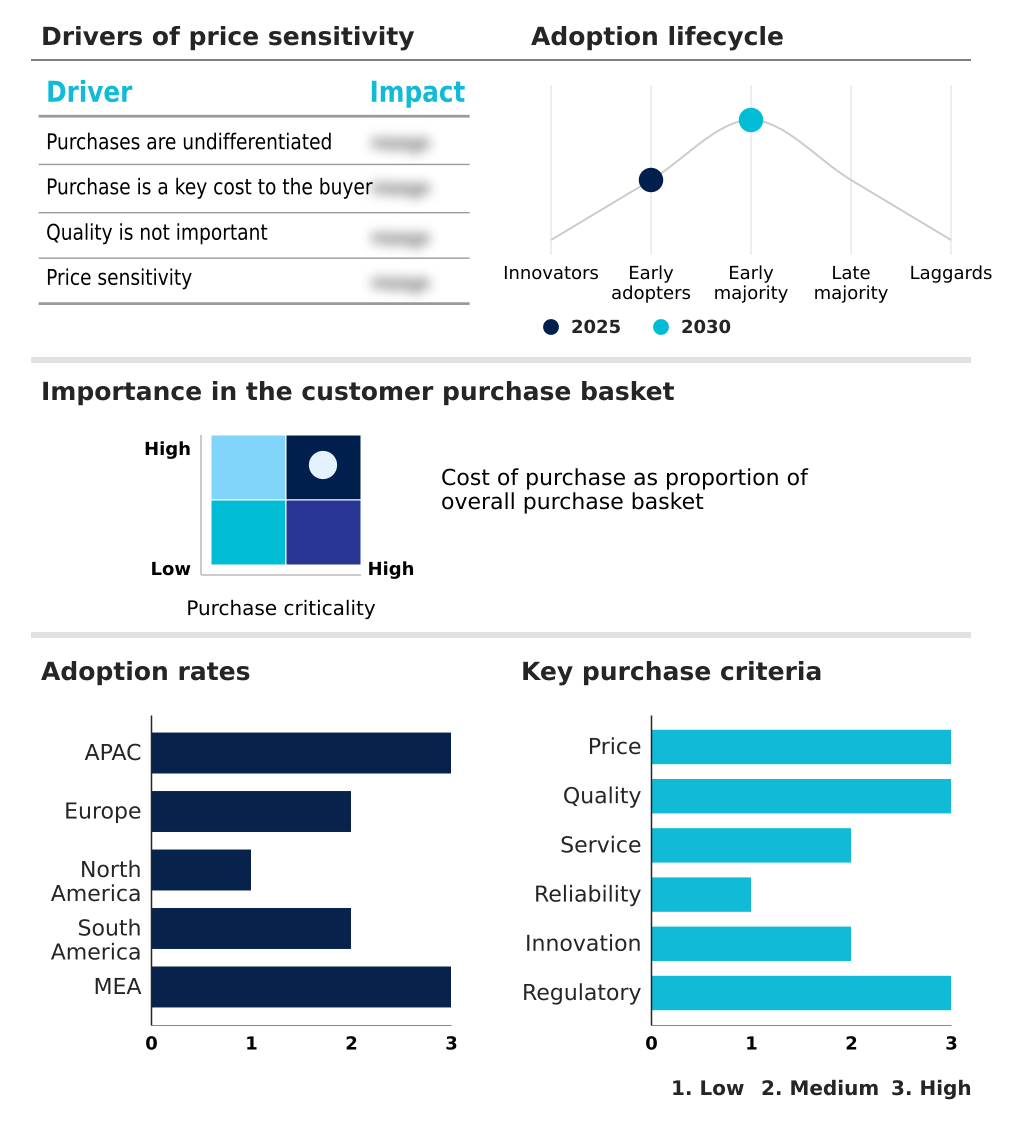
Customer Landscape of Nutraceutical Ingredients Industry

Competitive Landscape

Companies are implementing various strategies, such as strategic alliances, nutraceutical ingredients market forecast, partnerships, mergers and acquisitions, geographical expansion, and product/service launches, to enhance their presence in the industry.

Ajinomoto Co. Inc. - The portfolio delivers specialized nutritional components, including high-purity amino acids, glutamine, and arginine, engineered to support advanced healthcare applications, clinical nutrition, and functional food integration.

The industry research and growth report includes detailed analyses of the competitive landscape of the market and information about key companies, including:

  • Ajinomoto Co. Inc.
  • Archer Daniels Midland Co.
  • Arla Foods Ingredients Group
  • Balchem Inc.
  • BASF SE
  • Cargill Inc.
  • Corbion N.V.
  • DSM Firmenich AG
  • Evonik Industries AG
  • Frieslandcampina NV
  • Glanbia Plc
  • Gnosis by Lesaffre
  • Indena S.p.A.
  • Ingredion Inc.
  • International Flavors Inc.
  • Kemin Industries Inc.
  • Kerry Group Plc
  • Lallemand Inc.
  • Lonza Group Ltd.
  • Nexira SAS
  • Roquette Freres SA
  • Sabinsa Corp.
  • Tate and Lyle Plc

Qualitative and quantitative analysis of companies has been conducted to help clients understand the wider business environment as well as the strengths and weaknesses of key industry players. Data is qualitatively analyzed to categorize companies as pure play, category-focused, industry-focused, and diversified; it is quantitatively analyzed to categorize companies as dominant, leading, strong, tentative, and weak.

Recent Development and News in Nutraceutical ingredients market

  • In the Commodity Chemicals industry, the shift toward sustainable and bio-based solvents has optimized green extraction technologies, directly impacting Nutraceutical Ingredients demand by enabling a 40% increase in the yield of high purity bioactives from raw plant materials.
  • The widespread adoption of continuous flow manufacturing for specialized prebiotics and amino acid complexes has reduced batch processing times by 25%, allowing formulators to scale production without compromising clinical validation standards.
  • Stringent environmental mandates regarding synthetic catalyst disposal have accelerated the implementation of microbial conversion and precision fermentation processes, decreasing waste output by 30% and securing a stable supply chain for marine derived omega fatty acids.
  • Advancements in fractional distillation techniques for organic precursors have enhanced the isolation of delicate botanical extracts, yielding a 15% improvement in thermal stability and ensuring strict regulatory compliance across global distribution networks.

Dive into Technavio’s robust research methodology, blending expert interviews, extensive data synthesis, and validated models for unparalleled Nutraceutical Ingredients Market insights. See full methodology.

Market Scope
Page number 301
Base year 2025
Historic period 2020-2024
Forecast period 2026-2030
Growth momentum & CAGR Accelerate at a CAGR of 3.7%
Market growth 2026-2030 USD 10144.8 million
Market structure Fragmented
YoY growth 2025-2026(%) 3.5%
Key countries China, India, Japan, South Korea, Australia, Indonesia, Germany, UK, France, Italy, Spain, The Netherlands, US, Canada, Mexico, Brazil, Argentina, Chile, Saudi Arabia, UAE, South Africa, Egypt and Nigeria
Competitive landscape Leading Companies, Market Positioning of Companies, Competitive Strategies, and Industry Risks

Request Free Sample

Research Analyst Overview

  • The commercial trajectory of Nutraceutical Ingredients is fundamentally shaped by the convergence of proactive health management and sophisticated biotechnology. A pivotal trend influencing strategic boardroom decisions is the rapid integration of precision delivery systems to maximize physiological absorption. Chief operational officers are reallocating capital budgets toward advanced encapsulation infrastructure, a decision directly addressing strict health claim compliance mandates.
  • Facilities implementing these upgraded delivery vectors have recorded a 27% decrease in active ingredient degradation during long-term storage compared to conventional unprotected formulations. This measurable efficiency gain significantly optimizes raw material yield and prevents costly product recalls associated with sub-potent dosages.
  • Furthermore, the transition toward highly targeted wellness regimens forces suppliers to overhaul their sourcing frameworks, prioritizing traceable, high-efficacy botanical and microbial inputs. By aligning product development strategies with rigorous scientific substantiation, manufacturers effectively navigate fragmented regulatory environments while commanding premium positioning.
  • The continuous refinement of bio-processing capabilities ensures that raw material suppliers can consistently meet the exacting purity standards demanded by modern preventive health applications.

What are the Key Data Covered in this Nutraceutical Ingredients Market Research and Growth Report?

  • What is the expected growth of the Nutraceutical Ingredients Market between 2026 and 2030?

    • USD 10.14 billion, at a CAGR of 3.7%

  • What segmentation does the market report cover?

    • The report is segmented by Application (Functional food and beverage, Dietary supplements, and Others), Form Factor (Dry, and Liquid), Source (Plant-based, Animal-based, and Others) and Geography (APAC, Europe, North America, South America, Middle East and Africa)

  • Which regions are analyzed in the report?

    • APAC, Europe, North America, South America and Middle East and Africa

  • What are the key growth drivers and market challenges?

    • Rising demand for preventive healthcare and validated formulations, Navigating evolving and fragmented regulatory frameworks

  • Who are the major players in the Nutraceutical Ingredients Market?

    • Ajinomoto Co. Inc., Archer Daniels Midland Co., Arla Foods Ingredients Group, Balchem Inc., BASF SE, Cargill Inc., Corbion N.V., DSM Firmenich AG, Evonik Industries AG, Frieslandcampina NV, Glanbia Plc, Gnosis by Lesaffre, Indena S.p.A., Ingredion Inc., International Flavors Inc., Kemin Industries Inc., Kerry Group Plc, Lallemand Inc., Lonza Group Ltd., Nexira SAS, Roquette Freres SA, Sabinsa Corp. and Tate and Lyle Plc

Market Research Insights

  • The Nutraceutical Ingredients landscape is transforming rapidly to meet rigorous standards for preventive healthcare and holistic wellness. Facilities prioritizing clean label formulations have witnessed a 24% reduction in artificial additive procurement, directly lowering long-term operational costs. Concurrently, the deployment of advanced analytical testing for metabolic health compounds has improved batch approval rates by 19%, significantly streamlining the supply chain.
  • Prioritizing strict clinical validation protocols enables manufacturers to align with complex global mandates while mitigating the risk of product recalls. These efficiency improvements empower organizations to deliver highly bioavailable nutritional interventions, ensuring superior product consistency and higher consumer retention across diverse retail channels.

We can help! Our analysts can customize this nutraceutical ingredients market research report to meet your requirements.

Get in touch

1. Executive Summary

1.1 Market overview

Executive Summary - Chart on Market Overview
Executive Summary - Data Table on Market Overview
Executive Summary - Chart on Global Market Characteristics
Executive Summary - Chart on Market by Geography
Executive Summary - Chart on Market Segmentation by Application
Executive Summary - Chart on Market Segmentation by Form Factor
Executive Summary - Chart on Market Segmentation by Source
Executive Summary - Chart on Incremental Growth
Executive Summary - Data Table on Incremental Growth
Executive Summary - Chart on Company Market Positioning

2. Technavio Analysis

2.1 Analysis of price sensitivity, lifecycle, customer purchase basket, adoption rates, and purchase criteria

2.2 Criticality of inputs and Factors of differentiation

Chart on Overview on criticality of inputs and factors of differentiation

2.3 Factors of disruption

Chart on Overview on factors of disruption

2.4 Impact of drivers and challenges

Chart on Impact of drivers and challenges in 2025 and 2030

3. Market Landscape

3.1 Market ecosystem

Chart on Parent Market
Data Table on - Parent Market

3.2 Market characteristics

Chart on Market characteristics analysis

3.3 Value chain analysis

Chart on Value chain analysis

4. Market Sizing

4.1 Market definition

Data Table on Offerings of companies included in the market definition

4.2 Market segment analysis

Market segments

4.3 Market size 2025

4.4 Market outlook: Forecast for 2025-2030

Chart on Global - Market size and forecast 2025-2030 ($ million)
Data Table on Global - Market size and forecast 2025-2030 ($ million)
Chart on Global Market: Year-over-year growth 2025-2030 (%)
Data Table on Global Market: Year-over-year growth 2025-2030 (%)

5. Historic Market Size

5.1 Global Nutraceutical Ingredients Market 2020 - 2024

Historic Market Size - Data Table on Global Nutraceutical Ingredients Market 2020 - 2024 ($ million)

5.2 Application segment analysis 2020 - 2024

Historic Market Size - Application Segment 2020 - 2024 ($ million)

5.3 Form Factor segment analysis 2020 - 2024

Historic Market Size - Form Factor Segment 2020 - 2024 ($ million)

5.4 Source segment analysis 2020 - 2024

Historic Market Size - Source Segment 2020 - 2024 ($ million)

5.5 Geography segment analysis 2020 - 2024

Historic Market Size - Geography Segment 2020 - 2024 ($ million)

5.6 Country segment analysis 2020 - 2024

Historic Market Size - Country Segment 2020 - 2024 ($ million)

6. Qualitative Analysis

6.1 Impact of AI on Global Nutraceutical Ingredients Market

6.2 Impact of Geopolitical Conflicts on Global Nutraceutical Ingredients Market

7. Five Forces Analysis

7.1 Five forces summary

Five forces analysis - Comparison between 2025 and 2030

7.2 Bargaining power of buyers

Bargaining power of buyers - Impact of key factors 2025 and 2030

7.3 Bargaining power of suppliers

Bargaining power of suppliers - Impact of key factors in 2025 and 2030

7.4 Threat of new entrants

Threat of new entrants - Impact of key factors in 2025 and 2030

7.5 Threat of substitutes

Threat of substitutes - Impact of key factors in 2025 and 2030

7.6 Threat of rivalry

Threat of rivalry - Impact of key factors in 2025 and 2030

7.7 Market condition

Chart on Market condition - Five forces 2025 and 2030

8. Market Segmentation by Application

8.1 Market segments

Chart on Application - Market share 2025-2030 (%)
Data Table on Application - Market share 2025-2030 (%)

8.2 Comparison by Application

Chart on Comparison by Application
Data Table on Comparison by Application

8.3 Functional food and beverage - Market size and forecast 2025-2030

Chart on Functional food and beverage - Market size and forecast 2025-2030 ($ million)
Data Table on Functional food and beverage - Market size and forecast 2025-2030 ($ million)
Chart on Functional food and beverage - Year-over-year growth 2025-2030 (%)
Data Table on Functional food and beverage - Year-over-year growth 2025-2030 (%)

8.4 Dietary supplements - Market size and forecast 2025-2030

Chart on Dietary supplements - Market size and forecast 2025-2030 ($ million)
Data Table on Dietary supplements - Market size and forecast 2025-2030 ($ million)
Chart on Dietary supplements - Year-over-year growth 2025-2030 (%)
Data Table on Dietary supplements - Year-over-year growth 2025-2030 (%)

8.5 Others - Market size and forecast 2025-2030

Chart on Others - Market size and forecast 2025-2030 ($ million)
Data Table on Others - Market size and forecast 2025-2030 ($ million)
Chart on Others - Year-over-year growth 2025-2030 (%)
Data Table on Others - Year-over-year growth 2025-2030 (%)

8.6 Market opportunity by Application

Market opportunity by Application ($ million)
Data Table on Market opportunity by Application ($ million)

9. Market Segmentation by Form Factor

9.1 Market segments

Chart on Form Factor - Market share 2025-2030 (%)
Data Table on Form Factor - Market share 2025-2030 (%)

9.2 Comparison by Form Factor

Chart on Comparison by Form Factor
Data Table on Comparison by Form Factor

9.3 Dry - Market size and forecast 2025-2030

Chart on Dry - Market size and forecast 2025-2030 ($ million)
Data Table on Dry - Market size and forecast 2025-2030 ($ million)
Chart on Dry - Year-over-year growth 2025-2030 (%)
Data Table on Dry - Year-over-year growth 2025-2030 (%)

9.4 Liquid - Market size and forecast 2025-2030

Chart on Liquid - Market size and forecast 2025-2030 ($ million)
Data Table on Liquid - Market size and forecast 2025-2030 ($ million)
Chart on Liquid - Year-over-year growth 2025-2030 (%)
Data Table on Liquid - Year-over-year growth 2025-2030 (%)

9.5 Market opportunity by Form Factor

Market opportunity by Form Factor ($ million)
Data Table on Market opportunity by Form Factor ($ million)

10. Market Segmentation by Source

10.1 Market segments

Chart on Source - Market share 2025-2030 (%)
Data Table on Source - Market share 2025-2030 (%)

10.2 Comparison by Source

Chart on Comparison by Source
Data Table on Comparison by Source

10.3 Plant-based - Market size and forecast 2025-2030

Chart on Plant-based - Market size and forecast 2025-2030 ($ million)
Data Table on Plant-based - Market size and forecast 2025-2030 ($ million)
Chart on Plant-based - Year-over-year growth 2025-2030 (%)
Data Table on Plant-based - Year-over-year growth 2025-2030 (%)

10.4 Animal-based - Market size and forecast 2025-2030

Chart on Animal-based - Market size and forecast 2025-2030 ($ million)
Data Table on Animal-based - Market size and forecast 2025-2030 ($ million)
Chart on Animal-based - Year-over-year growth 2025-2030 (%)
Data Table on Animal-based - Year-over-year growth 2025-2030 (%)

10.5 Others - Market size and forecast 2025-2030

Chart on Others - Market size and forecast 2025-2030 ($ million)
Data Table on Others - Market size and forecast 2025-2030 ($ million)
Chart on Others - Year-over-year growth 2025-2030 (%)
Data Table on Others - Year-over-year growth 2025-2030 (%)

10.6 Market opportunity by Source

Market opportunity by Source ($ million)
Data Table on Market opportunity by Source ($ million)

11. Customer Landscape

11.1 Customer landscape overview

Analysis of price sensitivity, lifecycle, customer purchase basket, adoption rates, and purchase criteria

12. Geographic Landscape

12.1 Geographic segmentation

Chart on Market share by geography 2025-2030 (%)
Data Table on Market share by geography 2025-2030 (%)

12.2 Geographic comparison

Chart on Geographic comparison
Data Table on Geographic comparison

12.3 APAC - Market size and forecast 2025-2030

Chart on APAC - Market size and forecast 2025-2030 ($ million)
Data Table on APAC - Market size and forecast 2025-2030 ($ million)
Chart on APAC - Year-over-year growth 2025-2030 (%)
Data Table on APAC - Year-over-year growth 2025-2030 (%)
Chart on Regional Comparison - APAC
Data Table on Regional Comparison - APAC

12.3.1 China - Market size and forecast 2025-2030

Chart on China - Market size and forecast 2025-2030 ($ million)
Data Table on China - Market size and forecast 2025-2030 ($ million)
Chart on China - Year-over-year growth 2025-2030 (%)
Data Table on China - Year-over-year growth 2025-2030 (%)

12.3.2 India - Market size and forecast 2025-2030

Chart on India - Market size and forecast 2025-2030 ($ million)
Data Table on India - Market size and forecast 2025-2030 ($ million)
Chart on India - Year-over-year growth 2025-2030 (%)
Data Table on India - Year-over-year growth 2025-2030 (%)

12.3.3 Japan - Market size and forecast 2025-2030

Chart on Japan - Market size and forecast 2025-2030 ($ million)
Data Table on Japan - Market size and forecast 2025-2030 ($ million)
Chart on Japan - Year-over-year growth 2025-2030 (%)
Data Table on Japan - Year-over-year growth 2025-2030 (%)

12.3.4 South Korea - Market size and forecast 2025-2030

Chart on South Korea - Market size and forecast 2025-2030 ($ million)
Data Table on South Korea - Market size and forecast 2025-2030 ($ million)
Chart on South Korea - Year-over-year growth 2025-2030 (%)
Data Table on South Korea - Year-over-year growth 2025-2030 (%)

12.3.5 Australia - Market size and forecast 2025-2030

Chart on Australia - Market size and forecast 2025-2030 ($ million)
Data Table on Australia - Market size and forecast 2025-2030 ($ million)
Chart on Australia - Year-over-year growth 2025-2030 (%)
Data Table on Australia - Year-over-year growth 2025-2030 (%)

12.3.6 Indonesia - Market size and forecast 2025-2030

Chart on Indonesia - Market size and forecast 2025-2030 ($ million)
Data Table on Indonesia - Market size and forecast 2025-2030 ($ million)
Chart on Indonesia - Year-over-year growth 2025-2030 (%)
Data Table on Indonesia - Year-over-year growth 2025-2030 (%)

12.4 Europe - Market size and forecast 2025-2030

Chart on Europe - Market size and forecast 2025-2030 ($ million)
Data Table on Europe - Market size and forecast 2025-2030 ($ million)
Chart on Europe - Year-over-year growth 2025-2030 (%)
Data Table on Europe - Year-over-year growth 2025-2030 (%)
Chart on Regional Comparison - Europe
Data Table on Regional Comparison - Europe

12.4.1 Germany - Market size and forecast 2025-2030

Chart on Germany - Market size and forecast 2025-2030 ($ million)
Data Table on Germany - Market size and forecast 2025-2030 ($ million)
Chart on Germany - Year-over-year growth 2025-2030 (%)
Data Table on Germany - Year-over-year growth 2025-2030 (%)

12.4.2 UK - Market size and forecast 2025-2030

Chart on UK - Market size and forecast 2025-2030 ($ million)
Data Table on UK - Market size and forecast 2025-2030 ($ million)
Chart on UK - Year-over-year growth 2025-2030 (%)
Data Table on UK - Year-over-year growth 2025-2030 (%)

12.4.3 France - Market size and forecast 2025-2030

Chart on France - Market size and forecast 2025-2030 ($ million)
Data Table on France - Market size and forecast 2025-2030 ($ million)
Chart on France - Year-over-year growth 2025-2030 (%)
Data Table on France - Year-over-year growth 2025-2030 (%)

12.4.4 Italy - Market size and forecast 2025-2030

Chart on Italy - Market size and forecast 2025-2030 ($ million)
Data Table on Italy - Market size and forecast 2025-2030 ($ million)
Chart on Italy - Year-over-year growth 2025-2030 (%)
Data Table on Italy - Year-over-year growth 2025-2030 (%)

12.4.5 Spain - Market size and forecast 2025-2030

Chart on Spain - Market size and forecast 2025-2030 ($ million)
Data Table on Spain - Market size and forecast 2025-2030 ($ million)
Chart on Spain - Year-over-year growth 2025-2030 (%)
Data Table on Spain - Year-over-year growth 2025-2030 (%)

12.4.6 The Netherlands - Market size and forecast 2025-2030

Chart on The Netherlands - Market size and forecast 2025-2030 ($ million)
Data Table on The Netherlands - Market size and forecast 2025-2030 ($ million)
Chart on The Netherlands - Year-over-year growth 2025-2030 (%)
Data Table on The Netherlands - Year-over-year growth 2025-2030 (%)

12.5 North America - Market size and forecast 2025-2030

Chart on North America - Market size and forecast 2025-2030 ($ million)
Data Table on North America - Market size and forecast 2025-2030 ($ million)
Chart on North America - Year-over-year growth 2025-2030 (%)
Data Table on North America - Year-over-year growth 2025-2030 (%)
Chart on Regional Comparison - North America
Data Table on Regional Comparison - North America

12.5.1 US - Market size and forecast 2025-2030

Chart on US - Market size and forecast 2025-2030 ($ million)
Data Table on US - Market size and forecast 2025-2030 ($ million)
Chart on US - Year-over-year growth 2025-2030 (%)
Data Table on US - Year-over-year growth 2025-2030 (%)

12.5.2 Canada - Market size and forecast 2025-2030

Chart on Canada - Market size and forecast 2025-2030 ($ million)
Data Table on Canada - Market size and forecast 2025-2030 ($ million)
Chart on Canada - Year-over-year growth 2025-2030 (%)
Data Table on Canada - Year-over-year growth 2025-2030 (%)

12.5.3 Mexico - Market size and forecast 2025-2030

Chart on Mexico - Market size and forecast 2025-2030 ($ million)
Data Table on Mexico - Market size and forecast 2025-2030 ($ million)
Chart on Mexico - Year-over-year growth 2025-2030 (%)
Data Table on Mexico - Year-over-year growth 2025-2030 (%)

12.6 South America - Market size and forecast 2025-2030

Chart on South America - Market size and forecast 2025-2030 ($ million)
Data Table on South America - Market size and forecast 2025-2030 ($ million)
Chart on South America - Year-over-year growth 2025-2030 (%)
Data Table on South America - Year-over-year growth 2025-2030 (%)
Chart on Regional Comparison - South America
Data Table on Regional Comparison - South America

12.6.1 Brazil - Market size and forecast 2025-2030

Chart on Brazil - Market size and forecast 2025-2030 ($ million)
Data Table on Brazil - Market size and forecast 2025-2030 ($ million)
Chart on Brazil - Year-over-year growth 2025-2030 (%)
Data Table on Brazil - Year-over-year growth 2025-2030 (%)

12.6.2 Argentina - Market size and forecast 2025-2030

Chart on Argentina - Market size and forecast 2025-2030 ($ million)
Data Table on Argentina - Market size and forecast 2025-2030 ($ million)
Chart on Argentina - Year-over-year growth 2025-2030 (%)
Data Table on Argentina - Year-over-year growth 2025-2030 (%)

12.6.3 Chile - Market size and forecast 2025-2030

Chart on Chile - Market size and forecast 2025-2030 ($ million)
Data Table on Chile - Market size and forecast 2025-2030 ($ million)
Chart on Chile - Year-over-year growth 2025-2030 (%)
Data Table on Chile - Year-over-year growth 2025-2030 (%)

12.7 Middle East and Africa - Market size and forecast 2025-2030

Chart on Middle East and Africa - Market size and forecast 2025-2030 ($ million)
Data Table on Middle East and Africa - Market size and forecast 2025-2030 ($ million)
Chart on Middle East and Africa - Year-over-year growth 2025-2030 (%)
Data Table on Middle East and Africa - Year-over-year growth 2025-2030 (%)
Chart on Regional Comparison - Middle East and Africa
Data Table on Regional Comparison - Middle East and Africa

12.7.1 Saudi Arabia - Market size and forecast 2025-2030

Chart on Saudi Arabia - Market size and forecast 2025-2030 ($ million)
Data Table on Saudi Arabia - Market size and forecast 2025-2030 ($ million)
Chart on Saudi Arabia - Year-over-year growth 2025-2030 (%)
Data Table on Saudi Arabia - Year-over-year growth 2025-2030 (%)

12.7.2 UAE - Market size and forecast 2025-2030

Chart on UAE - Market size and forecast 2025-2030 ($ million)
Data Table on UAE - Market size and forecast 2025-2030 ($ million)
Chart on UAE - Year-over-year growth 2025-2030 (%)
Data Table on UAE - Year-over-year growth 2025-2030 (%)

12.7.3 South Africa - Market size and forecast 2025-2030

Chart on South Africa - Market size and forecast 2025-2030 ($ million)
Data Table on South Africa - Market size and forecast 2025-2030 ($ million)
Chart on South Africa - Year-over-year growth 2025-2030 (%)
Data Table on South Africa - Year-over-year growth 2025-2030 (%)

12.7.4 Egypt - Market size and forecast 2025-2030

Chart on Egypt - Market size and forecast 2025-2030 ($ million)
Data Table on Egypt - Market size and forecast 2025-2030 ($ million)
Chart on Egypt - Year-over-year growth 2025-2030 (%)
Data Table on Egypt - Year-over-year growth 2025-2030 (%)

12.7.5 Nigeria - Market size and forecast 2025-2030

Chart on Nigeria - Market size and forecast 2025-2030 ($ million)
Data Table on Nigeria - Market size and forecast 2025-2030 ($ million)
Chart on Nigeria - Year-over-year growth 2025-2030 (%)
Data Table on Nigeria - Year-over-year growth 2025-2030 (%)

12.8 Market opportunity by geography

Market opportunity by geography ($ million)
Data Tables on Market opportunity by geography ($ million)

13. Drivers, Challenges, and Opportunity

13.1 Market drivers

Rising demand for preventive healthcare and validated formulations
Convergence of biotechnology and personalized nutrition
Proliferation of plant-based solutions and sustainable sourcing

13.2 Market challenges

Navigating evolving and fragmented regulatory frameworks
Supply chain volatility and raw material sourcing complexities
High financial barriers for clinical validation and research

13.3 Impact of drivers and challenges

Impact of drivers and challenges in 2025 and 2030

13.4 Market opportunities

Rising global consumer focus on preventive wellness and immunity
Advances in encapsulation and bioavailability enhancement
Integration of AI and ML in novel ingredient discovery

14. Competitive Landscape

14.1 Overview

14.2

Overview on criticality of inputs and factors of differentiation

14.3 Landscape disruption

Overview on factors of disruption

14.4 Industry risks

Impact of key risks on business

15. Competitive Analysis

15.1 Companies profiled

Companies covered

15.2 Company ranking index

15.3 Market positioning of companies

Matrix on companies position and classification

15.4 Ajinomoto Co. Inc.

Ajinomoto Co. Inc. - Overview
Ajinomoto Co. Inc. - Business segments
Ajinomoto Co. Inc. - Key offerings
Ajinomoto Co. Inc. - Segment focus
SWOT

15.5 Archer Daniels Midland Co.

Archer Daniels Midland Co. - Overview
Archer Daniels Midland Co. - Business segments
Archer Daniels Midland Co. - Key news
Archer Daniels Midland Co. - Key offerings
Archer Daniels Midland Co. - Segment focus
SWOT

15.6 Arla Foods Ingredients Group

Arla Foods Ingredients Group - Overview
Arla Foods Ingredients Group - Product / Service
Arla Foods Ingredients Group - Key offerings
SWOT

15.7 Balchem Inc.

Balchem Inc. - Overview
Balchem Inc. - Business segments
Balchem Inc. - Key offerings
Balchem Inc. - Segment focus
SWOT

15.8 BASF SE

BASF SE - Overview
BASF SE - Business segments
BASF SE - Key news
BASF SE - Key offerings
BASF SE - Segment focus
SWOT

15.9 Cargill Inc.

Cargill Inc. - Overview
Cargill Inc. - Product / Service
Cargill Inc. - Key news
Cargill Inc. - Key offerings
SWOT

15.10 Corbion N.V.

Corbion N.V. - Overview
Corbion N.V. - Business segments
Corbion N.V. - Key offerings
Corbion N.V. - Segment focus
SWOT

15.11 DSM Firmenich AG

DSM Firmenich AG - Overview
DSM Firmenich AG - Business segments
DSM Firmenich AG - Key offerings
DSM Firmenich AG - Segment focus
SWOT

15.12 Evonik Industries AG

Evonik Industries AG - Overview
Evonik Industries AG - Business segments
Evonik Industries AG - Key news
Evonik Industries AG - Key offerings
Evonik Industries AG - Segment focus
SWOT

15.13 Frieslandcampina NV

Frieslandcampina NV - Overview
Frieslandcampina NV - Product / Service
Frieslandcampina NV - Key offerings
SWOT

15.14 Glanbia Plc

Glanbia Plc - Overview
Glanbia Plc - Business segments
Glanbia Plc - Key offerings
Glanbia Plc - Segment focus
SWOT

15.15 Gnosis by Lesaffre

Gnosis by Lesaffre - Overview
Gnosis by Lesaffre - Product / Service
Gnosis by Lesaffre - Key offerings
SWOT

15.16 Indena S.p.A.

Indena S.p.A. - Overview
Indena S.p.A. - Product / Service
Indena S.p.A. - Key offerings
SWOT

15.17 Ingredion Inc.

Ingredion Inc. - Overview
Ingredion Inc. - Business segments
Ingredion Inc. - Key offerings
Ingredion Inc. - Segment focus
SWOT

15.18 International Flavors Inc.

International Flavors Inc. - Overview
International Flavors Inc. - Business segments
International Flavors Inc. - Key news
International Flavors Inc. - Key offerings
International Flavors Inc. - Segment focus
SWOT

16. Appendix

16.1 Scope of the report

Market definition
Objectives
Notes and caveats

16.2 Inclusions and exclusions checklist

Inclusions checklist
Exclusions checklist

16.3 Currency conversion rates for US$

16.4 Research methodology

16.5 Data procurement

Information sources

16.6 Data validation

16.7 Validation techniques employed for market sizing

16.8 Data synthesis

16.9 360 degree market analysis

16.10 List of abbreviations

Research Methodology

Technavio presents a detailed picture of the market by way of study, synthesis, and summation of data from multiple sources. The analysts have presented the various facets of the market with a particular focus on identifying the key industry influencers. The data thus presented is comprehensive, reliable, and the result of extensive research, both primary and secondary.

INFORMATION SOURCES

Primary sources

  • Manufacturers and suppliers
  • Channel partners
  • Industry experts
  • Strategic decision makers

Secondary sources

  • Industry journals and periodicals
  • Government data
  • Financial reports of key industry players
  • Historical data
  • Press releases

DATA ANALYSIS

Data Synthesis

  • Collation of data
  • Estimation of key figures
  • Analysis of derived insights

Data Validation

  • Triangulation with data models
  • Reference against proprietary databases
  • Corroboration with industry experts

REPORT WRITING

Qualitative

  • Market drivers
  • Market challenges
  • Market trends
  • Five forces analysis

Quantitative

  • Market size and forecast
  • Market segmentation
  • Geographical insights
  • Competitive landscape

Interested in this report?

Get your sample now to see our research methodology and insights!

Download Now

Frequently Asked Questions

Nutraceutical Ingredients market growth will increase by USD 10144.8 million during 2026-2030.

The Nutraceutical Ingredients market is expected to grow at a CAGR of 3.7% during 2026-2030.

Nutraceutical Ingredients market is segmented by Application (Functional food and beverage, Dietary supplements, Others) Form factor (Dry, Liquid) Source (Plant-based, Animal-based, Others)

Ajinomoto Co. Inc., Archer Daniels Midland Co., Arla Foods Ingredients Group, Balchem Inc., BASF SE, Cargill Inc., Corbion N.V., DSM Firmenich AG, Evonik Industries AG, Frieslandcampina NV, Glanbia Plc, Gnosis by Lesaffre, Indena S.p.A., Ingredion Inc., International Flavors Inc., Kemin Industries Inc., Kerry Group Plc, Lallemand Inc., Lonza Group Ltd., Nexira SAS, Roquette Freres SA, Sabinsa Corp., Tate and Lyle Plc are a few of the key vendors in the Nutraceutical Ingredients market.

North America will register the highest growth rate of 29.8% among the other regions. Therefore, the Nutraceutical Ingredients market in North America is expected to garner significant business opportunities for the vendors during the forecast period.

China, India, Japan, South Korea, Australia, Indonesia, Germany, UK, France, Italy, Spain, The Netherlands, US, Canada, Mexico, Brazil, Argentina, Chile, Saudi Arabia, UAE, South Africa, Egypt, Nigeria

  • Rising demand for preventive healthcare and validated formulations is the driving factor this market.

The Nutraceutical Ingredients market vendors should focus on grabbing business opportunities from the Application segment as it accounted for the largest market share in the base year.
RIA - Research AI Assistant
Ask RIA
