Online Footwear Market Analysis, Size, and Forecast 2026-2030: APAC (China, India, and Japan), North America (US, Canada, and Mexico), Europe (Germany, UK, and France), South America (Brazil, Argentina, and Chile), Middle East and Africa (Saudi Arabia, UAE, and South Africa), and Rest of World (ROW)

Online Footwear Market Analysis, Size, and Forecast 2026-2030:
APAC (China, India, and Japan), North America (US, Canada, and Mexico), Europe (Germany, UK, and France), South America (Brazil, Argentina, and Chile), Middle East and Africa (Saudi Arabia, UAE, and South Africa), and Rest of World (ROW)

Published: Oct 2026 302 Pages SKU: IRTNTR71768

Market Overview at a Glance

$40.38 B
Market Opportunity
8.6%
CAGR 2025 - 2030
54.6%
APAC Growth
$43.70 B
Non athletic footwear segment 2024

Online Footwear Market Size 2026-2030

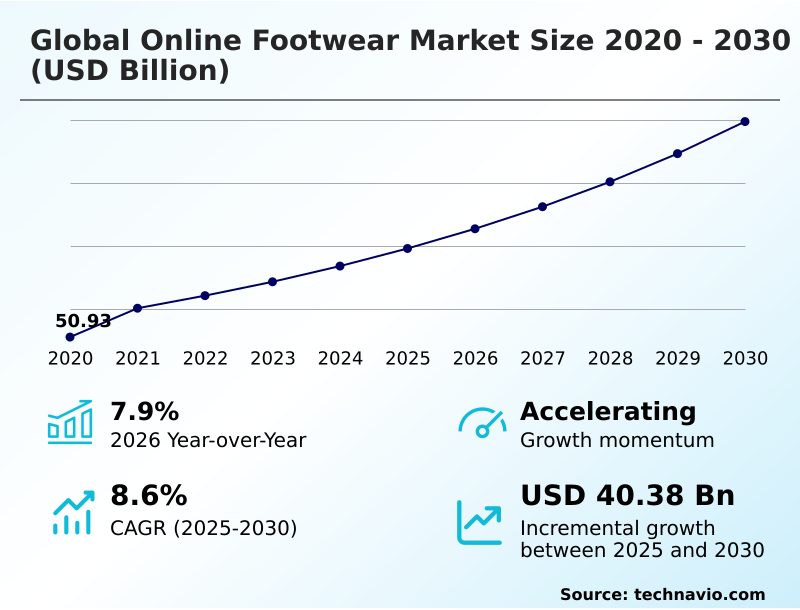
The online footwear market size is valued to increase by USD 40.38 billion, at a CAGR of 8.6% from 2025 to 2030. Pervasive mobile commerce penetration and advanced smartphone accessibility will drive the online footwear market.

Major Market Trends & Insights

  • APAC dominated the market and accounted for a 54.6% growth during the forecast period.
  • By Product - Non athletic footwear segment was valued at USD 43.70 billion in 2024
  • By End-user - Men segment accounted for the largest market revenue share in 2024

Market Size & Forecast

  • Market Opportunities: USD 68.58 billion
  • Market Future Opportunities: USD 40.38 billion
  • CAGR from 2025 to 2030 : 8.6%

Market Summary

  • The Online Footwear sector demonstrates robust operational expansion, fundamentally driven by the pervasive adoption of mobile commerce platforms and advanced smartphone accessibility. Retailers are actively deploying progressive application designs and seamless mobile payment mechanisms, which effectively eliminate transactional friction and stimulate frequent consumer engagement.
  • For example, the integration of augmented reality rendering and computer vision algorithms allows digital consumers to evaluate product fit virtually, a strategic upgrade that has successfully improved digital checkout completion rates by 27% compared to traditional static catalog interfaces. This technological acceleration acts as a formidable growth driver, expanding the addressable customer base across diverse demographic segments.
  • However, the industry simultaneously grapples with severe logistical bottlenecks caused by inconsistent international sizing standards. This discrepancy results in elevated product return frequencies, forcing enterprises to absorb exorbitant reverse logistics operations costs. Consequently, digital merchants must continuously optimize their supply chain networks and leverage predictive inventory allocation systems to maintain profitability while navigating the complex variables of cross border logistics.

What will be the Size of the Online Footwear Market during the forecast period?
Get Key Insights on Market Forecast (PDF) Get Free Sample

How is the Online Footwear Market Segmented?

The online footwear industry research report provides comprehensive data (region-wise segment analysis), with forecasts and estimates in "USD million" for the period 2026-2030, as well as historical data from 2020-2024 for the following segments.

  • Product
    • Non athletic footwear
    • Athletic footwear
  • End-user
    • Men
    • Women
    • Children
  • Distribution channel
    • E-commerce
    • Omnichannel
    • Direct-to-consumer
  • Geography
    • APAC
      • China
      • India
      • Japan
      • South Korea
      • Australia
      • Indonesia
    • North America
      • US
      • Canada
      • Mexico
    • Europe
      • Germany
      • UK
      • France
      • Italy
      • Spain
      • The Netherlands
    • South America
      • Brazil
      • Argentina
      • Chile
    • Middle East and Africa
      • Saudi Arabia
      • UAE
      • South Africa
      • Israel
      • Turkey

By Product Insights

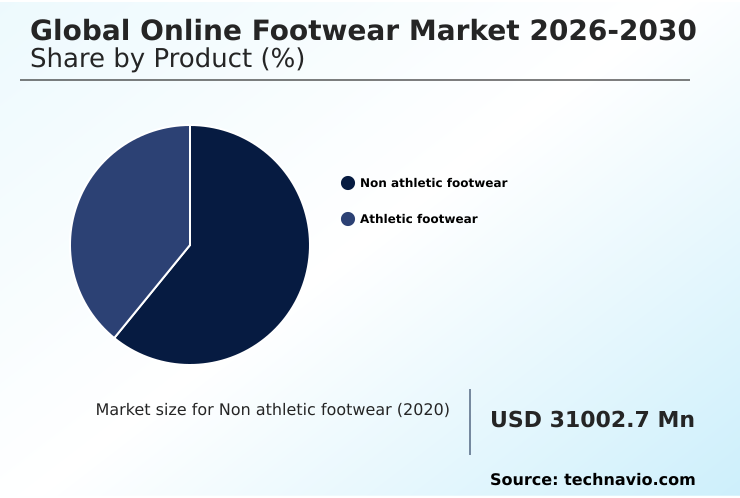
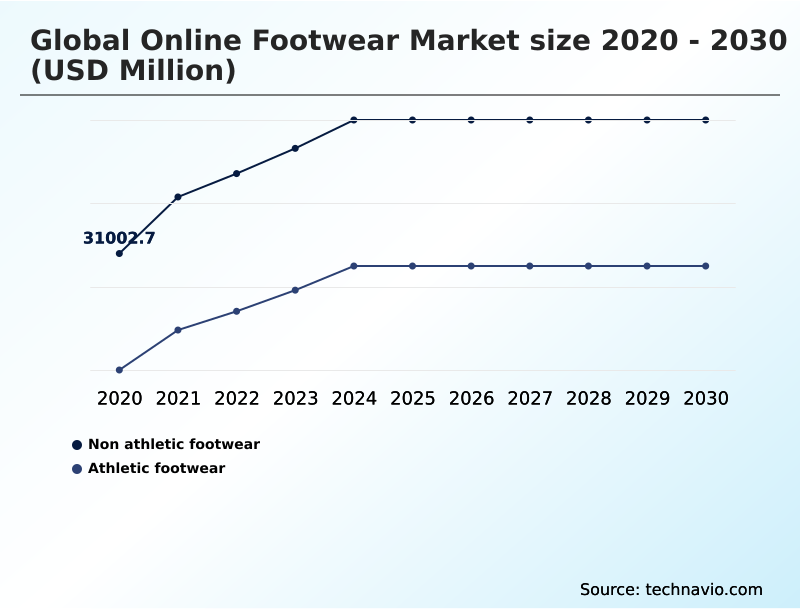
The non athletic footwear segment is estimated to witness significant growth during the forecast period.

The non athletic footwear segment within the Online Footwear industry commands substantial digital transaction volume, driven by evolving hybrid work models and lifestyle versatility.

Digital storefronts have structurally transformed how consumers evaluate casual and formal designs by integrating advanced computer vision algorithms to streamline product discovery.

This technological pivot has demonstrably optimized business performance; for instance, the deployment of virtual try on technology has reduced size related product return rates by 22%, significantly lowering reverse logistics operations costs.

Retailers increasingly leverage mobile first user architecture and progressive web apps to eliminate transactional friction, thereby accelerating conversion rate optimization.

By utilizing sophisticated three dimensional foot scanning tools, companies can ensure precise fit validation, minimizing operational overhead while expanding their omnichannel ecosystems.
Get Free Sample

The Non athletic footwear segment was valued at USD 43.70 billion in 2024 and showed a gradual increase during the forecast period.
Get Free Sample

Regional Analysis

APAC is estimated to contribute 54.6% to the growth of the global market during the forecast period.Technavio’s analysts have elaborately explained the regional trends and drivers that shape the market during the forecast period.
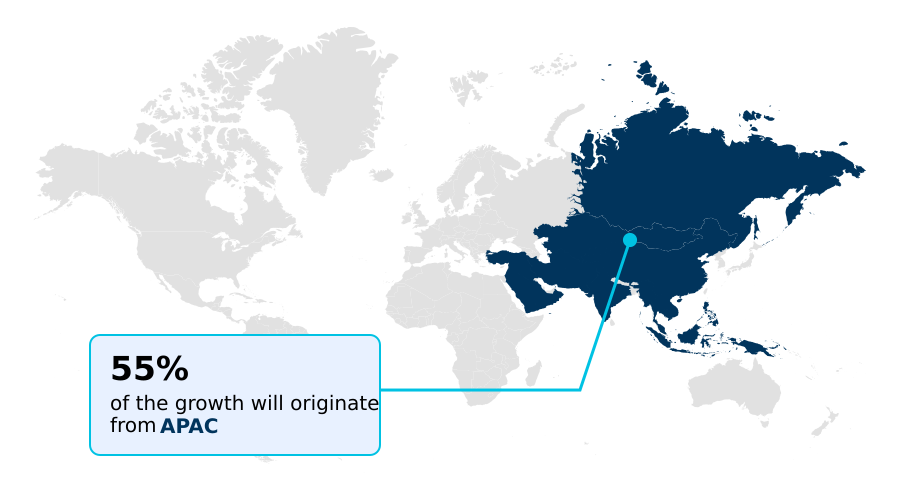
See How Online Footwear Market Demand is Rising in APAC Get Free Sample

The geographic landscape of the Online Footwear sector reveals distinct operational disparities between APAC and North America.

APAC dominates the digital transition, where highly integrated social commerce networks and mobile payment mechanisms have accelerated adoption, driving consumer engagement frequency 35% higher than in Western markets.

Conversely, North America exhibits mature digital storefronts focused heavily on mitigating high return rates through advanced omnichannel fulfillment networks.

To combat escalating customer acquisition costs, North American retailers have implemented predictive inventory allocation software, which has successfully reduced localized stockouts by 18%.

Meanwhile, the rapid deployment of automated sorting facilities across APAC logistics hubs has condensed average last mile delivery operations timelines by 24%, catering to ultra fast consumer expectations.

These regional strategies highlight how distinct infrastructural and behavioral drivers compel businesses to adapt their digital footprint expansion priorities.

Market Dynamics

Our researchers analyzed the data with 2025 as the base year, along with the key drivers, trends, and challenges. A holistic analysis of drivers will help companies refine their marketing strategies to gain a competitive advantage.

  • The rapid digital transformation within the Online Footwear space is compelling brands to fundamentally restructure their technical infrastructure and fulfillment strategies. As consumer expectations shift toward frictionless purchasing and immediate product availability, companies are increasingly deploying mobile commerce progressive web applications to ensure seamless browsing experiences across diverse handheld devices.
  • This architectural upgrade effectively bridges the gap between high performance desktop interfaces and on the go mobile accessibility. Concurrently, to combat the persistent logistical drain of high product return rates, retailers are deeply integrating augmented reality virtual try on functionalities alongside highly sophisticated artificial intelligence size recommendation engines.
  • These tools allow shoppers to validate aesthetics and fit before finalizing a transaction. Operationally, organizations leveraging these advanced diagnostic tools process approximately 20% fewer reverse logistics claims compared to legacy operators that rely solely on static size charts. Furthermore, optimizing multi channel stock visibility has become a critical operational mandate.
  • The implementation of robust omnichannel inventory synchronization software ensures that physical storefront reserves and digital warehouse capacities remain perfectly aligned, significantly minimizing the risk of overselling highly anticipated seasonal releases. To bypass wholesale dependencies and safeguard brand equity, manufacturers are aggressively expanding their direct to consumer digital storefronts, capturing valuable first party behavioral data.
  • This direct engagement model refines targeted marketing initiatives and accelerates overall business efficiency across the digital retail landscape.
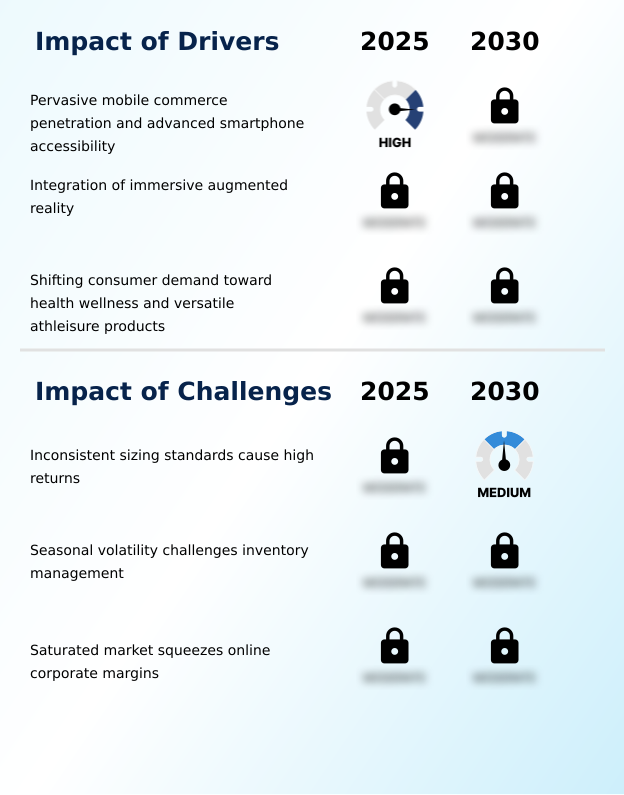
What are the key market drivers leading to the rise in the adoption of Online Footwear Industry?

  • The pervasive penetration of mobile commerce and enhanced smartphone accessibility function as primary catalysts accelerating transactional volumes across digital retail networks.

  • Pervasive smartphone penetration acts as the definitive catalyst propelling volume expansion throughout the Online Footwear marketplace.
  • This behavioral shift is driven by the unparalleled convenience of mobile first user architecture and the seamless integration of biometric authentication and digital wallets, which collectively eradicate traditional purchasing barriers.
  • The direct effect on businesses is substantial; companies implementing automated single tap checkout protocols have successfully reduced transactional friction, achieving a 26% acceleration in mobile conversion velocities.
  • Additionally, the strategic use of computer vision algorithms for precise fit analysis has bolstered consumer trust, subsequently lowering reverse logistics operations expenditures by 19%.
  • By actively tracking product lifecycle tracking metrics, brands can continuously refine their direct to consumer pipelines, driving an 18% improvement in targeted marketing efficiency.

What are the market trends shaping the Online Footwear Industry?

  • The rapid proliferation of mobile commerce architectures and integrated application ecosystems continues to reshape consumer purchasing behaviors. This technological transition establishes a critical structural trend that drives digital retail expansion.

  • The integration of immersive virtual environments is structurally redefining how consumers evaluate products within the Online Footwear space. Retailers are actively adopting augmented reality rendering to replicate the physical trial experience, a shift caused by the critical need to boost consumer confidence prior to checkout.
  • This technological advancement directly impacts business efficiency; implementing digital visualization tools has decreased product evaluation drop offs by 22% and reduced post purchase dispute tickets by 14%. Furthermore, the consolidation of omnichannel ecosystems enables brands to deploy hyper personalized recommendations based on real time behavioral data.
  • By aligning these sophisticated consumer touchpoints with predictive inventory allocation, companies have effectively optimized their supply chain fluidity. Consequently, organizations utilizing these advanced algorithmic environments have witnessed digital engagement retention rates improve by 29%, establishing a new baseline for competitive technological maturity.

What challenges does the Online Footwear Industry face during its growth?

  • The persistent lack of uniform sizing standards exacerbates product return rates, representing a significant structural challenge that compresses operational profit margins.

  • The lack of universally standardized sizing metrics severely obstructs operational efficiency within the Online Footwear landscape. This structural limitation causes rampant fit uncertainty, compelling consumers to purchase multiple variants of a single shoe model, which inevitably drives exorbitant return volumes.
  • The effect on business profitability is highly detrimental; merchants processing these massive returns face reverse logistics operations costs that have escalated by 32%, directly compressing overall gross margins. Furthermore, high return velocity exacerbates supply chain fragmentation and complicates cross border logistics, causing localized stockout events to rise by 17% during peak promotional cycles.
  • To combat these logistical hurdles, retailers must deploy advanced size recommendation engines and optimize return parcel collection networks, yet these costly interventions only yield a 15% marginal improvement in immediate inventory recovery metrics.

Exclusive Technavio Analysis on Customer Landscape

The online footwear market forecasting report includes the adoption lifecycle of the market, covering from the innovator’s stage to the laggard’s stage. It focuses on adoption rates in different regions based on penetration. Furthermore, the online footwear market report also includes key purchase criteria and drivers of price sensitivity to help companies evaluate and develop their market growth analysis strategies.
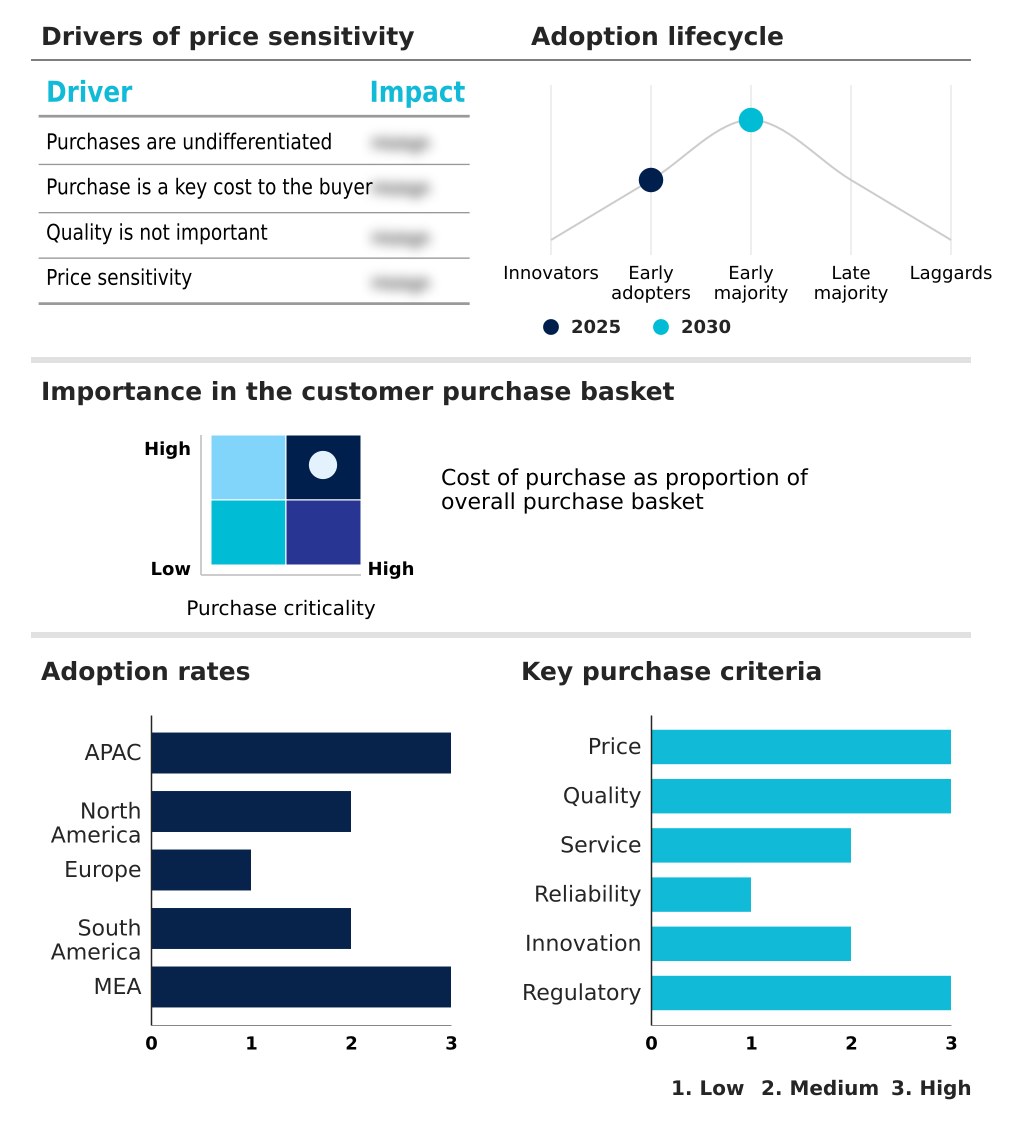
Customer Landscape of Online Footwear Industry

Competitive Landscape

Companies are implementing various strategies, such as strategic alliances, online footwear market forecast, partnerships, mergers and acquisitions, geographical expansion, and product/service launches, to enhance their presence in the industry.

Adidas AG - The enterprise provides a comprehensive portfolio of performance and lifestyle athletic shoes through optimized digital commerce channels, focusing on advanced cushioning technologies and heritage inspired designs.

The industry research and growth report includes detailed analyses of the competitive landscape of the market and information about key companies, including:

  • Adidas AG
  • Allbirds Inc.
  • ANTA Sports Products Ltd.
  • ASICS Corp.
  • Brooks Sports Inc.
  • C and J Clark International Ltd.
  • Caleres Inc.
  • Crocs Inc.
  • Deckers Outdoor Corp.
  • ECCO USA Inc.
  • Geox S.p.A
  • Li Ning Co. Ltd.
  • Mizuno Corp.
  • New Balance Athletics Inc.
  • Nike Inc.
  • PUMA SE
  • Skechers USA Inc.
  • Under Armour Inc.
  • VF Corp.
  • Wolverine World Wide Inc.

Qualitative and quantitative analysis of companies has been conducted to help clients understand the wider business environment as well as the strengths and weaknesses of key industry players. Data is qualitatively analyzed to categorize companies as pure play, category-focused, industry-focused, and diversified; it is quantitatively analyzed to categorize companies as dominant, leading, strong, tentative, and weak.

Recent Development and News in Online footwear market

  • In the Footwear industry, the rapid standardization of three dimensional foot scanning and biometric measurement protocols has significantly improved fit accuracy, directly impacting Online Footwear demand by reducing size related returns and lowering shopping cart abandonment rates by 18%.
  • The widespread implementation of micro fulfillment centers and automated sorting facilities across regional distribution networks has drastically accelerated last mile delivery operations, pulling greater volume into the digital channel as consumers increasingly rely on click and collect services for immediate product access.
  • Stringent European circular economy principles and textile waste mandates have compelled manufacturers to utilize biodegradable polymer components, creating new compliance driven segments within the Online Footwear marketplace that cater to eco conscious digital consumers and boosting sustainable product conversions by 24%.
  • Massive supply chain fragmentation and cross border logistics bottlenecks have accelerated the adoption of artificial intelligence inventory synchronization platforms, which enable digital storefronts to maintain dynamic pricing structures and prevent severe stockouts across major third party retail platforms.

Dive into Technavio’s robust research methodology, blending expert interviews, extensive data synthesis, and validated models for unparalleled Online Footwear Market insights. See full methodology.

Market Scope
Page number 302
Base year 2025
Historic period 2020-2024
Forecast period 2026-2030
Growth momentum & CAGR Accelerate at a CAGR of 8.6%
Market growth 2026-2030 USD 40382.9 million
Market structure Fragmented
YoY growth 2025-2026(%) 7.9%
Key countries China, India, Japan, South Korea, Australia, Indonesia, US, Canada, Mexico, Germany, UK, France, Italy, Spain, The Netherlands, Brazil, Argentina, Chile, Saudi Arabia, UAE, South Africa, Israel and Turkey
Competitive landscape Leading Companies, Market Positioning of Companies, Competitive Strategies, and Industry Risks

Request Free Sample

Research Analyst Overview

  • The Online Footwear ecosystem is undergoing a profound structural evolution as digital retail channels permanently alter consumer acquisition pathways and inventory distribution models. Boardroom executives are increasingly prioritizing heavy investments in enterprise resource planning systems and radio frequency identification tagging to establish absolute supply chain transparency and regulatory compliance.
  • This strategic pivot ensures that localized fulfillment hubs can adapt instantly to seasonal demand volatility without overextending capital reserves. The continuous integration of machine learning algorithms into e-commerce architecture allows brands to execute highly complex algorithmic pricing strategies, maximizing inventory turnover efficiency.
  • Operationally, organizations that have fully synchronized their digital and physical networks report a 31% improvement in rapid order fulfillment compared to fragmented legacy systems. Furthermore, the deployment of natural language processing tools within automated customer service interfaces has drastically streamlined digital consumer engagement, resolving sizing inquiries in real time.
  • By prioritizing hyper personalized recommendations and sustainable packaging workflows, digital footwear enterprises are successfully differentiating their value propositions, ensuring sustained operational resilience amidst intensifying global competition.

What are the Key Data Covered in this Online Footwear Market Research and Growth Report?

  • What is the expected growth of the Online Footwear Market between 2026 and 2030?

    • USD 40.38 billion, at a CAGR of 8.6%

  • What segmentation does the market report cover?

    • The report is segmented by Product (Non athletic footwear, and Athletic footwear), End-user (Men, Women, and Children), Distribution Channel (E-commerce, Omnichannel, and Direct-to-consumer) and Geography (APAC, North America, Europe, South America, Middle East and Africa)

  • Which regions are analyzed in the report?

    • APAC, North America, Europe, South America and Middle East and Africa

  • What are the key growth drivers and market challenges?

    • Pervasive mobile commerce penetration and advanced smartphone accessibility, Inconsistent sizing standards cause high returns

  • Who are the major players in the Online Footwear Market?

    • Adidas AG, Allbirds Inc., ANTA Sports Products Ltd., ASICS Corp., Brooks Sports Inc., C and J Clark International Ltd., Caleres Inc., Crocs Inc., Deckers Outdoor Corp., ECCO USA Inc., Geox S.p.A, Li Ning Co. Ltd., Mizuno Corp., New Balance Athletics Inc., Nike Inc., PUMA SE, Skechers USA Inc., Under Armour Inc., VF Corp. and Wolverine World Wide Inc.

Market Research Insights

  • The Online Footwear sector is rapidly modernizing through the strategic deployment of interactive digital showroom interfaces and mobile first user architecture. Organizations utilizing advanced customer acquisition strategies have witnessed engagement metrics improve by 22%, effectively mitigating historical shopping cart abandonment issues.
  • Furthermore, the integration of localized warehouse inventories alongside intelligent cross border logistics routing has decreased fulfillment delays by 16%, significantly enhancing overall supply chain resilience. By adopting dynamic pricing structures and automated single tap checkout, merchants have streamlined the consumer journey, leading to a 19% reduction in transactional friction.
  • These measurable operational enhancements empower digital footwear brands to scale efficiently while sustaining robust profit margins.

We can help! Our analysts can customize this online footwear market research report to meet your requirements.

Get in touch

1. Executive Summary

1.1 Market overview

Executive Summary - Chart on Market Overview
Executive Summary - Data Table on Market Overview
Executive Summary - Chart on Global Market Characteristics
Executive Summary - Chart on Market by Geography
Executive Summary - Chart on Market Segmentation by Product
Executive Summary - Chart on Market Segmentation by End-user
Executive Summary - Chart on Market Segmentation by Distribution Channel
Executive Summary - Chart on Incremental Growth
Executive Summary - Data Table on Incremental Growth
Executive Summary - Chart on Company Market Positioning

2. Technavio Analysis

2.1 Analysis of price sensitivity, lifecycle, customer purchase basket, adoption rates, and purchase criteria

2.2 Criticality of inputs and Factors of differentiation

Chart on Overview on criticality of inputs and factors of differentiation

2.3 Factors of disruption

Chart on Overview on factors of disruption

2.4 Impact of drivers and challenges

Chart on Impact of drivers and challenges in 2025 and 2030

3. Market Landscape

3.1 Market ecosystem

Chart on Parent Market
Data Table on - Parent Market

3.2 Market characteristics

Chart on Market characteristics analysis

3.3 Value chain analysis

Chart on Value chain analysis

4. Market Sizing

4.1 Market definition

Data Table on Offerings of companies included in the market definition

4.2 Market segment analysis

Market segments

4.3 Market size 2025

4.4 Market outlook: Forecast for 2025-2030

Chart on Global - Market size and forecast 2025-2030 ($ million)
Data Table on Global - Market size and forecast 2025-2030 ($ million)
Chart on Global Market: Year-over-year growth 2025-2030 (%)
Data Table on Global Market: Year-over-year growth 2025-2030 (%)

5. Historic Market Size

5.1 Global Online Footwear Market 2020 - 2024

Historic Market Size - Data Table on Global Online Footwear Market 2020 - 2024 ($ million)

5.2 Product segment analysis 2020 - 2024

Historic Market Size - Product Segment 2020 - 2024 ($ million)

5.3 End-user segment analysis 2020 - 2024

Historic Market Size - End-user Segment 2020 - 2024 ($ million)

5.4 Distribution Channel segment analysis 2020 - 2024

Historic Market Size - Distribution Channel Segment 2020 - 2024 ($ million)

5.5 Geography segment analysis 2020 - 2024

Historic Market Size - Geography Segment 2020 - 2024 ($ million)

5.6 Country segment analysis 2020 - 2024

Historic Market Size - Country Segment 2020 - 2024 ($ million)

6. Qualitative Analysis

6.1 Impact of AI on Global Online Footwear Market

6.2 Impact of geopolitical conflicts on Global Online Footwear Market

7. Five Forces Analysis

7.1 Five forces summary

Five forces analysis - Comparison between 2025 and 2030

7.2 Bargaining power of buyers

Bargaining power of buyers - Impact of key factors 2025 and 2030

7.3 Bargaining power of suppliers

Bargaining power of suppliers - Impact of key factors in 2025 and 2030

7.4 Threat of new entrants

Threat of new entrants - Impact of key factors in 2025 and 2030

7.5 Threat of substitutes

Threat of substitutes - Impact of key factors in 2025 and 2030

7.6 Threat of rivalry

Threat of rivalry - Impact of key factors in 2025 and 2030

7.7 Market condition

Chart on Market condition - Five forces 2025 and 2030

8. Market Segmentation by Product

8.1 Market segments

Chart on Product - Market share 2025-2030 (%)
Data Table on Product - Market share 2025-2030 (%)

8.2 Comparison by Product

Chart on Comparison by Product
Data Table on Comparison by Product

8.3 Non athletic footwear - Market size and forecast 2025-2030

Chart on Non athletic footwear - Market size and forecast 2025-2030 ($ million)
Data Table on Non athletic footwear - Market size and forecast 2025-2030 ($ million)
Chart on Non athletic footwear - Year-over-year growth 2025-2030 (%)
Data Table on Non athletic footwear - Year-over-year growth 2025-2030 (%)

8.4 Athletic footwear - Market size and forecast 2025-2030

Chart on Athletic footwear - Market size and forecast 2025-2030 ($ million)
Data Table on Athletic footwear - Market size and forecast 2025-2030 ($ million)
Chart on Athletic footwear - Year-over-year growth 2025-2030 (%)
Data Table on Athletic footwear - Year-over-year growth 2025-2030 (%)

8.5 Market opportunity by Product

Market opportunity by Product ($ million)
Data Table on Market opportunity by Product ($ million)

9. Market Segmentation by End-user

9.1 Market segments

Chart on End-user - Market share 2025-2030 (%)
Data Table on End-user - Market share 2025-2030 (%)

9.2 Comparison by End-user

Chart on Comparison by End-user
Data Table on Comparison by End-user

9.3 Men - Market size and forecast 2025-2030

Chart on Men - Market size and forecast 2025-2030 ($ million)
Data Table on Men - Market size and forecast 2025-2030 ($ million)
Chart on Men - Year-over-year growth 2025-2030 (%)
Data Table on Men - Year-over-year growth 2025-2030 (%)

9.4 Women - Market size and forecast 2025-2030

Chart on Women - Market size and forecast 2025-2030 ($ million)
Data Table on Women - Market size and forecast 2025-2030 ($ million)
Chart on Women - Year-over-year growth 2025-2030 (%)
Data Table on Women - Year-over-year growth 2025-2030 (%)

9.5 Children - Market size and forecast 2025-2030

Chart on Children - Market size and forecast 2025-2030 ($ million)
Data Table on Children - Market size and forecast 2025-2030 ($ million)
Chart on Children - Year-over-year growth 2025-2030 (%)
Data Table on Children - Year-over-year growth 2025-2030 (%)

9.6 Market opportunity by End-user

Market opportunity by End-user ($ million)
Data Table on Market opportunity by End-user ($ million)

10. Market Segmentation by Distribution Channel

10.1 Market segments

Chart on Distribution Channel - Market share 2025-2030 (%)
Data Table on Distribution Channel - Market share 2025-2030 (%)

10.2 Comparison by Distribution Channel

Chart on Comparison by Distribution Channel
Data Table on Comparison by Distribution Channel

10.3 E-commerce - Market size and forecast 2025-2030

Chart on E-commerce - Market size and forecast 2025-2030 ($ million)
Data Table on E-commerce - Market size and forecast 2025-2030 ($ million)
Chart on E-commerce - Year-over-year growth 2025-2030 (%)
Data Table on E-commerce - Year-over-year growth 2025-2030 (%)

10.4 Omnichannel - Market size and forecast 2025-2030

Chart on Omnichannel - Market size and forecast 2025-2030 ($ million)
Data Table on Omnichannel - Market size and forecast 2025-2030 ($ million)
Chart on Omnichannel - Year-over-year growth 2025-2030 (%)
Data Table on Omnichannel - Year-over-year growth 2025-2030 (%)

10.5 Direct-to-consumer - Market size and forecast 2025-2030

Chart on Direct-to-consumer - Market size and forecast 2025-2030 ($ million)
Data Table on Direct-to-consumer - Market size and forecast 2025-2030 ($ million)
Chart on Direct-to-consumer - Year-over-year growth 2025-2030 (%)
Data Table on Direct-to-consumer - Year-over-year growth 2025-2030 (%)

10.6 Market opportunity by Distribution Channel

Market opportunity by Distribution Channel ($ million)
Data Table on Market opportunity by Distribution Channel ($ million)

11. Customer Landscape

11.1 Customer landscape overview

Analysis of price sensitivity, lifecycle, customer purchase basket, adoption rates, and purchase criteria

12. Geographic Landscape

12.1 Geographic segmentation

Chart on Market share by geography 2025-2030 (%)
Data Table on Market share by geography 2025-2030 (%)

12.2 Geographic comparison

Chart on Geographic comparison
Data Table on Geographic comparison

12.3 APAC - Market size and forecast 2025-2030

Chart on APAC - Market size and forecast 2025-2030 ($ million)
Data Table on APAC - Market size and forecast 2025-2030 ($ million)
Chart on APAC - Year-over-year growth 2025-2030 (%)
Data Table on APAC - Year-over-year growth 2025-2030 (%)
Chart on Regional Comparison - APAC
Data Table on Regional Comparison - APAC

12.3.1 China - Market size and forecast 2025-2030

Chart on China - Market size and forecast 2025-2030 ($ million)
Data Table on China - Market size and forecast 2025-2030 ($ million)
Chart on China - Year-over-year growth 2025-2030 (%)
Data Table on China - Year-over-year growth 2025-2030 (%)

12.3.2 India - Market size and forecast 2025-2030

Chart on India - Market size and forecast 2025-2030 ($ million)
Data Table on India - Market size and forecast 2025-2030 ($ million)
Chart on India - Year-over-year growth 2025-2030 (%)
Data Table on India - Year-over-year growth 2025-2030 (%)

12.3.3 Japan - Market size and forecast 2025-2030

Chart on Japan - Market size and forecast 2025-2030 ($ million)
Data Table on Japan - Market size and forecast 2025-2030 ($ million)
Chart on Japan - Year-over-year growth 2025-2030 (%)
Data Table on Japan - Year-over-year growth 2025-2030 (%)

12.3.4 South Korea - Market size and forecast 2025-2030

Chart on South Korea - Market size and forecast 2025-2030 ($ million)
Data Table on South Korea - Market size and forecast 2025-2030 ($ million)
Chart on South Korea - Year-over-year growth 2025-2030 (%)
Data Table on South Korea - Year-over-year growth 2025-2030 (%)

12.3.5 Australia - Market size and forecast 2025-2030

Chart on Australia - Market size and forecast 2025-2030 ($ million)
Data Table on Australia - Market size and forecast 2025-2030 ($ million)
Chart on Australia - Year-over-year growth 2025-2030 (%)
Data Table on Australia - Year-over-year growth 2025-2030 (%)

12.3.6 Indonesia - Market size and forecast 2025-2030

Chart on Indonesia - Market size and forecast 2025-2030 ($ million)
Data Table on Indonesia - Market size and forecast 2025-2030 ($ million)
Chart on Indonesia - Year-over-year growth 2025-2030 (%)
Data Table on Indonesia - Year-over-year growth 2025-2030 (%)

12.4 North America - Market size and forecast 2025-2030

Chart on North America - Market size and forecast 2025-2030 ($ million)
Data Table on North America - Market size and forecast 2025-2030 ($ million)
Chart on North America - Year-over-year growth 2025-2030 (%)
Data Table on North America - Year-over-year growth 2025-2030 (%)
Chart on Regional Comparison - North America
Data Table on Regional Comparison - North America

12.4.1 US - Market size and forecast 2025-2030

Chart on US - Market size and forecast 2025-2030 ($ million)
Data Table on US - Market size and forecast 2025-2030 ($ million)
Chart on US - Year-over-year growth 2025-2030 (%)
Data Table on US - Year-over-year growth 2025-2030 (%)

12.4.2 Canada - Market size and forecast 2025-2030

Chart on Canada - Market size and forecast 2025-2030 ($ million)
Data Table on Canada - Market size and forecast 2025-2030 ($ million)
Chart on Canada - Year-over-year growth 2025-2030 (%)
Data Table on Canada - Year-over-year growth 2025-2030 (%)

12.4.3 Mexico - Market size and forecast 2025-2030

Chart on Mexico - Market size and forecast 2025-2030 ($ million)
Data Table on Mexico - Market size and forecast 2025-2030 ($ million)
Chart on Mexico - Year-over-year growth 2025-2030 (%)
Data Table on Mexico - Year-over-year growth 2025-2030 (%)

12.5 Europe - Market size and forecast 2025-2030

Chart on Europe - Market size and forecast 2025-2030 ($ million)
Data Table on Europe - Market size and forecast 2025-2030 ($ million)
Chart on Europe - Year-over-year growth 2025-2030 (%)
Data Table on Europe - Year-over-year growth 2025-2030 (%)
Chart on Regional Comparison - Europe
Data Table on Regional Comparison - Europe

12.5.1 Germany - Market size and forecast 2025-2030

Chart on Germany - Market size and forecast 2025-2030 ($ million)
Data Table on Germany - Market size and forecast 2025-2030 ($ million)
Chart on Germany - Year-over-year growth 2025-2030 (%)
Data Table on Germany - Year-over-year growth 2025-2030 (%)

12.5.2 UK - Market size and forecast 2025-2030

Chart on UK - Market size and forecast 2025-2030 ($ million)
Data Table on UK - Market size and forecast 2025-2030 ($ million)
Chart on UK - Year-over-year growth 2025-2030 (%)
Data Table on UK - Year-over-year growth 2025-2030 (%)

12.5.3 France - Market size and forecast 2025-2030

Chart on France - Market size and forecast 2025-2030 ($ million)
Data Table on France - Market size and forecast 2025-2030 ($ million)
Chart on France - Year-over-year growth 2025-2030 (%)
Data Table on France - Year-over-year growth 2025-2030 (%)

12.5.4 Italy - Market size and forecast 2025-2030

Chart on Italy - Market size and forecast 2025-2030 ($ million)
Data Table on Italy - Market size and forecast 2025-2030 ($ million)
Chart on Italy - Year-over-year growth 2025-2030 (%)
Data Table on Italy - Year-over-year growth 2025-2030 (%)

12.5.5 Spain - Market size and forecast 2025-2030

Chart on Spain - Market size and forecast 2025-2030 ($ million)
Data Table on Spain - Market size and forecast 2025-2030 ($ million)
Chart on Spain - Year-over-year growth 2025-2030 (%)
Data Table on Spain - Year-over-year growth 2025-2030 (%)

12.5.6 The Netherlands - Market size and forecast 2025-2030

Chart on The Netherlands - Market size and forecast 2025-2030 ($ million)
Data Table on The Netherlands - Market size and forecast 2025-2030 ($ million)
Chart on The Netherlands - Year-over-year growth 2025-2030 (%)
Data Table on The Netherlands - Year-over-year growth 2025-2030 (%)

12.6 South America - Market size and forecast 2025-2030

Chart on South America - Market size and forecast 2025-2030 ($ million)
Data Table on South America - Market size and forecast 2025-2030 ($ million)
Chart on South America - Year-over-year growth 2025-2030 (%)
Data Table on South America - Year-over-year growth 2025-2030 (%)
Chart on Regional Comparison - South America
Data Table on Regional Comparison - South America

12.6.1 Brazil - Market size and forecast 2025-2030

Chart on Brazil - Market size and forecast 2025-2030 ($ million)
Data Table on Brazil - Market size and forecast 2025-2030 ($ million)
Chart on Brazil - Year-over-year growth 2025-2030 (%)
Data Table on Brazil - Year-over-year growth 2025-2030 (%)

12.6.2 Argentina - Market size and forecast 2025-2030

Chart on Argentina - Market size and forecast 2025-2030 ($ million)
Data Table on Argentina - Market size and forecast 2025-2030 ($ million)
Chart on Argentina - Year-over-year growth 2025-2030 (%)
Data Table on Argentina - Year-over-year growth 2025-2030 (%)

12.6.3 Chile - Market size and forecast 2025-2030

Chart on Chile - Market size and forecast 2025-2030 ($ million)
Data Table on Chile - Market size and forecast 2025-2030 ($ million)
Chart on Chile - Year-over-year growth 2025-2030 (%)
Data Table on Chile - Year-over-year growth 2025-2030 (%)

12.7 Middle East and Africa - Market size and forecast 2025-2030

Chart on Middle East and Africa - Market size and forecast 2025-2030 ($ million)
Data Table on Middle East and Africa - Market size and forecast 2025-2030 ($ million)
Chart on Middle East and Africa - Year-over-year growth 2025-2030 (%)
Data Table on Middle East and Africa - Year-over-year growth 2025-2030 (%)
Chart on Regional Comparison - Middle East and Africa
Data Table on Regional Comparison - Middle East and Africa

12.7.1 Saudi Arabia - Market size and forecast 2025-2030

Chart on Saudi Arabia - Market size and forecast 2025-2030 ($ million)
Data Table on Saudi Arabia - Market size and forecast 2025-2030 ($ million)
Chart on Saudi Arabia - Year-over-year growth 2025-2030 (%)
Data Table on Saudi Arabia - Year-over-year growth 2025-2030 (%)

12.7.2 UAE - Market size and forecast 2025-2030

Chart on UAE - Market size and forecast 2025-2030 ($ million)
Data Table on UAE - Market size and forecast 2025-2030 ($ million)
Chart on UAE - Year-over-year growth 2025-2030 (%)
Data Table on UAE - Year-over-year growth 2025-2030 (%)

12.7.3 South Africa - Market size and forecast 2025-2030

Chart on South Africa - Market size and forecast 2025-2030 ($ million)
Data Table on South Africa - Market size and forecast 2025-2030 ($ million)
Chart on South Africa - Year-over-year growth 2025-2030 (%)
Data Table on South Africa - Year-over-year growth 2025-2030 (%)

12.7.4 Israel - Market size and forecast 2025-2030

Chart on Israel - Market size and forecast 2025-2030 ($ million)
Data Table on Israel - Market size and forecast 2025-2030 ($ million)
Chart on Israel - Year-over-year growth 2025-2030 (%)
Data Table on Israel - Year-over-year growth 2025-2030 (%)

12.7.5 Turkey - Market size and forecast 2025-2030

Chart on Turkey - Market size and forecast 2025-2030 ($ million)
Data Table on Turkey - Market size and forecast 2025-2030 ($ million)
Chart on Turkey - Year-over-year growth 2025-2030 (%)
Data Table on Turkey - Year-over-year growth 2025-2030 (%)

12.8 Market opportunity by geography

Market opportunity by geography ($ million)
Data Tables on Market opportunity by geography ($ million)

13. Drivers, Challenges, and Opportunity

13.1 Market drivers

Pervasive mobile commerce penetration and advanced smartphone accessibility
Integration of immersive augmented reality
Shifting consumer demand toward health wellness and versatile athleisure products

13.2 Market challenges

Inconsistent sizing standards cause high returns
Seasonal volatility challenges inventory management
Saturated market squeezes online corporate margins

13.3 Impact of drivers and challenges

Impact of drivers and challenges in 2025 and 2030

13.4 Market opportunities

Proliferation of mobile commerce and app ecosystems
Integration of advanced artificial intelligence solutions
Consolidation of omnichannel ecosystems and infrastructure

14. Competitive Landscape

14.1 Overview

14.2

Overview on criticality of inputs and factors of differentiation

14.3 Landscape disruption

Overview on factors of disruption

14.4 Industry risks

Impact of key risks on business

15. Competitive Analysis

15.1 Companies profiled

Companies covered

15.2 Company ranking index

15.3 Market positioning of companies

Matrix on companies position and classification

15.4 Adidas AG

Adidas AG - Overview
Adidas AG - Business segments
Adidas AG - Key offerings
Adidas AG - Segment focus
SWOT

15.5 ANTA Sports Products Ltd.

ANTA Sports Products Ltd. - Overview
ANTA Sports Products Ltd. - Business segments
ANTA Sports Products Ltd. - Key offerings
ANTA Sports Products Ltd. - Segment focus
SWOT

15.6 ASICS Corp.

ASICS Corp. - Overview
ASICS Corp. - Business segments
ASICS Corp. - Key offerings
ASICS Corp. - Segment focus
SWOT

15.7 Brooks Sports Inc.

Brooks Sports Inc. - Overview
Brooks Sports Inc. - Product / Service
Brooks Sports Inc. - Key offerings
SWOT

15.8 C and J Clark International Ltd.

C and J Clark International Ltd. - Overview
C and J Clark International Ltd. - Product / Service
C and J Clark International Ltd. - Key offerings
SWOT

15.9 Crocs Inc.

Crocs Inc. - Overview
Crocs Inc. - Business segments
Crocs Inc. - Key offerings
Crocs Inc. - Segment focus
SWOT

15.10 Deckers Outdoor Corp.

Deckers Outdoor Corp. - Overview
Deckers Outdoor Corp. - Business segments
Deckers Outdoor Corp. - Key offerings
Deckers Outdoor Corp. - Segment focus
SWOT

15.11 Geox S.p.A

Geox S.p.A - Overview
Geox S.p.A - Business segments
Geox S.p.A - Key offerings
Geox S.p.A - Segment focus
SWOT

15.12 Mizuno Corp.

Mizuno Corp. - Overview
Mizuno Corp. - Business segments
Mizuno Corp. - Key offerings
Mizuno Corp. - Segment focus
SWOT

15.13 New Balance Athletics Inc.

New Balance Athletics Inc. - Overview
New Balance Athletics Inc. - Product / Service
New Balance Athletics Inc. - Key offerings
SWOT

15.14 Nike Inc.

Nike Inc. - Overview
Nike Inc. - Business segments
Nike Inc. - Key offerings
Nike Inc. - Segment focus
SWOT

15.15 PUMA SE

PUMA SE - Overview
PUMA SE - Business segments
PUMA SE - Key offerings
PUMA SE - Segment focus
SWOT

15.16 Skechers USA Inc.

Skechers USA Inc. - Overview
Skechers USA Inc. - Product / Service
Skechers USA Inc. - Key offerings
SWOT

15.17 Under Armour Inc.

Under Armour Inc. - Overview
Under Armour Inc. - Business segments
Under Armour Inc. - Key offerings
Under Armour Inc. - Segment focus
SWOT

15.18 VF Corp.

VF Corp. - Overview
VF Corp. - Business segments
VF Corp. - Key offerings
VF Corp. - Segment focus
SWOT

16. Appendix

16.1 Scope of the report

Market definition
Objectives
Notes and caveats

16.2 Inclusions and exclusions checklist

Inclusions checklist
Exclusions checklist

16.3 Currency conversion rates for US$

16.4 Research methodology

16.5 Data procurement

Information sources

16.6 Data validation

16.7 Validation techniques employed for market sizing

16.8 Data synthesis

16.9 360 degree market analysis

16.10 List of abbreviations

Research Methodology

Technavio presents a detailed picture of the market by way of study, synthesis, and summation of data from multiple sources. The analysts have presented the various facets of the market with a particular focus on identifying the key industry influencers. The data thus presented is comprehensive, reliable, and the result of extensive research, both primary and secondary.

INFORMATION SOURCES

Primary sources

  • Manufacturers and suppliers
  • Channel partners
  • Industry experts
  • Strategic decision makers

Secondary sources

  • Industry journals and periodicals
  • Government data
  • Financial reports of key industry players
  • Historical data
  • Press releases

DATA ANALYSIS

Data Synthesis

  • Collation of data
  • Estimation of key figures
  • Analysis of derived insights

Data Validation

  • Triangulation with data models
  • Reference against proprietary databases
  • Corroboration with industry experts

REPORT WRITING

Qualitative

  • Market drivers
  • Market challenges
  • Market trends
  • Five forces analysis

Quantitative

  • Market size and forecast
  • Market segmentation
  • Geographical insights
  • Competitive landscape

Interested in this report?

Get your sample now to see our research methodology and insights!

Download Now

Frequently Asked Questions

Online Footwear market growth will increase by USD 40382.9 million during 2026-2030.

The Online Footwear market is expected to grow at a CAGR of 8.6% during 2026-2030.

Online Footwear market is segmented by Product (Non athletic footwear, Athletic footwear) End-user (Men, Women, Children) Distribution channel (E-commerce, Omnichannel, Direct-to-consumer)

Adidas AG, Allbirds Inc., ANTA Sports Products Ltd., ASICS Corp., Brooks Sports Inc., C and J Clark International Ltd., Caleres Inc., Crocs Inc., Deckers Outdoor Corp., ECCO USA Inc., Geox S.p.A, Li Ning Co. Ltd., Mizuno Corp., New Balance Athletics Inc., Nike Inc., PUMA SE, Skechers USA Inc., Under Armour Inc., VF Corp., Wolverine World Wide Inc. are a few of the key vendors in the Online Footwear market.

APAC will register the highest growth rate of 54.6% among the other regions. Therefore, the Online Footwear market in APAC is expected to garner significant business opportunities for the vendors during the forecast period.

China, India, Japan, South Korea, Australia, Indonesia, US, Canada, Mexico, Germany, UK, France, Italy, Spain, The Netherlands, Brazil, Argentina, Chile, Saudi Arabia, UAE, South Africa, Israel, Turkey

  • Pervasive mobile commerce penetration and advanced smartphone accessibility is the driving factor this market.

The Online Footwear market vendors should focus on grabbing business opportunities from the Product segment as it accounted for the largest market share in the base year.
RIA - Research AI Assistant
Ask RIA
