
Organic Pigments Market Analysis, Size, and Forecast 2026-2030: APAC (China, India, and Japan), Europe (Germany, Italy, and UK), North America (US, Canada, and Mexico), South America (Brazil, Argentina, and Colombia), Middle East and Africa (Turkey, South Africa, and Saudi Arabia), and Rest of World (ROW)

Organic Pigments Market Analysis, Size, and Forecast 2026-2030:
APAC (China, India, and Japan), Europe (Germany, Italy, and UK), North America (US, Canada, and Mexico), South America (Brazil, Argentina, and Colombia), Middle East and Africa (Turkey, South Africa, and Saudi Arabia), and Rest of World (ROW)

Published: Oct 2026 298 Pages SKU: IRTNTR45436

Market Overview at a Glance

$1.55 B
Market Opportunity
4.5%
CAGR 2025 - 2030
44.4%
APAC Growth
$3.22 B
Azo segment 2024

Organic Pigments Market Size 2026-2030

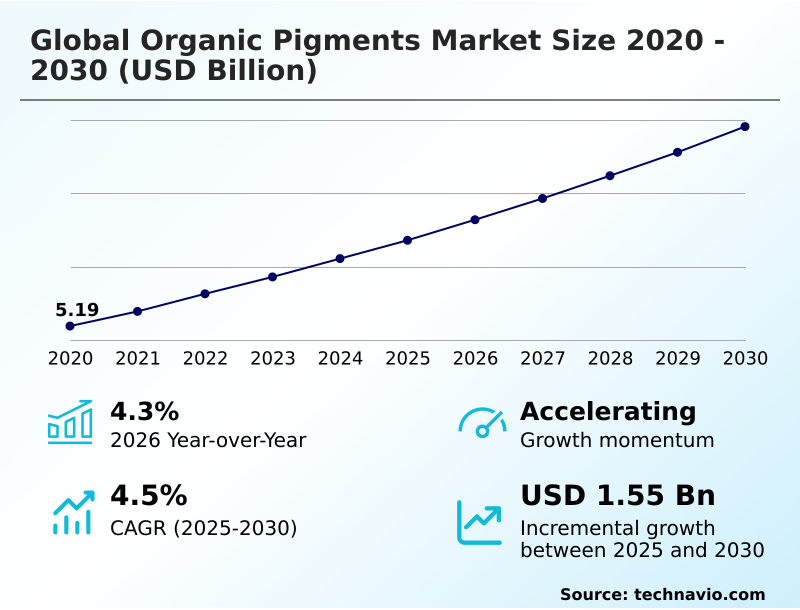
The organic pigments market size is valued to increase by USD 1.55 billion, at a CAGR of 4.5% from 2025 to 2030. Expanding application in high-performance coatings will drive the organic pigments market.

Major Market Trends & Insights

  • APAC dominated the market and accounted for a 44.4% growth during the forecast period.
  • By Type - Azo segment was valued at USD 3.22 billion in 2024
  • By Application - Printing inks segment accounted for the largest market revenue share in 2024

Market Size & Forecast

  • Market Opportunities: USD 2.72 billion
  • Market Future Opportunities: USD 1.55 billion
  • CAGR from 2025 to 2030 : 4.5%

Market Summary

  • The Organic Pigments Market demonstrates strong resilience and long-term expansion driven by accelerating industrialization and evolving consumer preferences across key end-use sectors. Modern original equipment manufacturers are increasingly replacing traditional inorganic pigments with advanced polycyclic pigments to achieve superior color intensity and high weatherability.
  • This operational shift toward high-performance organic colorants allows industrial paint formulators to improve exterior coating durability by up to 25% compared to legacy formulations. A primary driver fueling this momentum is the worldwide implementation of rigorous environmental protection mandates, which restricts heavy-metal contamination hazards and forces a transition toward eco-friendly, non-toxic synthetic substitutes.
  • However, the market faces severe operational friction arising from volatile raw material pricing associated with upstream petrochemical intermediate feedstocks. Because essential aromatic hydrocarbons are tied to crude oil refining dynamics, unexpected energy market fluctuations directly cascade into chemical synthesis costs, degrading operational liquidity for pigment synthesizers.
  • To mitigate these challenges, leading chemical processors are investing heavily in zero-liquid-discharge filtration systems and continuous process automation, ensuring long-term manufacturing resilience and strict environmental compliance across the supply chain.

What will be the Size of the Organic Pigments Market during the forecast period?
Get Key Insights on Market Forecast (PDF) Get Free Sample

How is the Organic Pigments Market Segmented?

The organic pigments industry research report provides comprehensive data (region-wise segment analysis), with forecasts and estimates in "USD million" for the period 2026-2030, as well as historical data from 2020-2024 for the following segments.

  • Type
    • Azo
    • Phthalocyanine
    • Others
  • Application
    • Printing inks
    • Paints and coatings
    • Plastics
    • Others
  • Source
    • Synthetic
    • Natural
  • Geography
    • APAC
      • China
      • India
      • Japan
      • South Korea
      • Australia
      • Indonesia
    • Europe
      • Germany
      • Italy
      • UK
      • France
      • Spain
      • The Netherlands
    • North America
      • US
      • Canada
      • Mexico
    • South America
      • Brazil
      • Argentina
      • Colombia
    • Middle East and Africa
      • Turkey
      • South Africa
      • Saudi Arabia
      • UAE
      • Egypt

By Type Insights

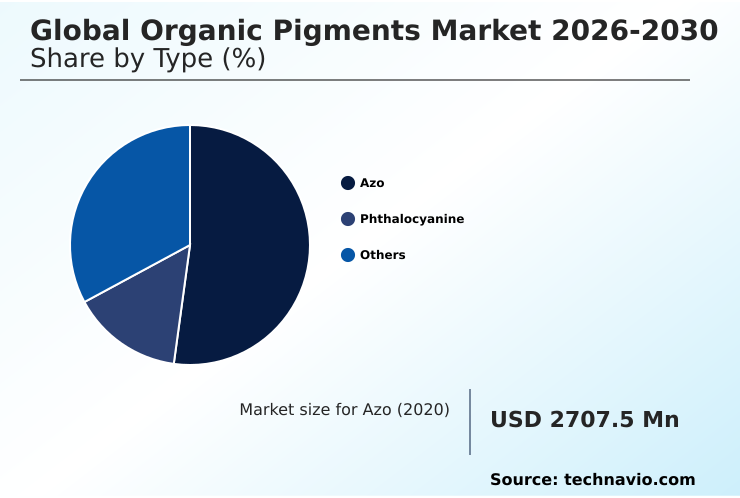
The azo segment is estimated to witness significant growth during the forecast period.

The azo segment within the Organic Pigments Market maintains a dominant operational position due to its exceptional tinting strength and cost-effective synthesis across diverse commercial applications.

Industrial formulators increasingly replace heavy-metal inorganic colorants with advanced azo derivatives to achieve vivid chromatic intensity at lower pigment loading concentrations. This strategic material substitution directly reduces raw material expenditure by up to 15% for downstream processors.

The continuous demand for high-performance organic colorants across automotive original equipment manufacturer finishes and architectural paints drives ongoing chemical process optimization.

Furthermore, the rapid expansion of flexible packaging graphics necessitates the integration of specialized monoazo and diazo formulations to ensure precise shade matching and superior dispersibility.

By optimizing diazotization reaction efficiency, chemical engineers successfully minimize toxicological risks while enhancing yield consistency, directly supporting sustainable manufacturing objectives.
Get Free Sample

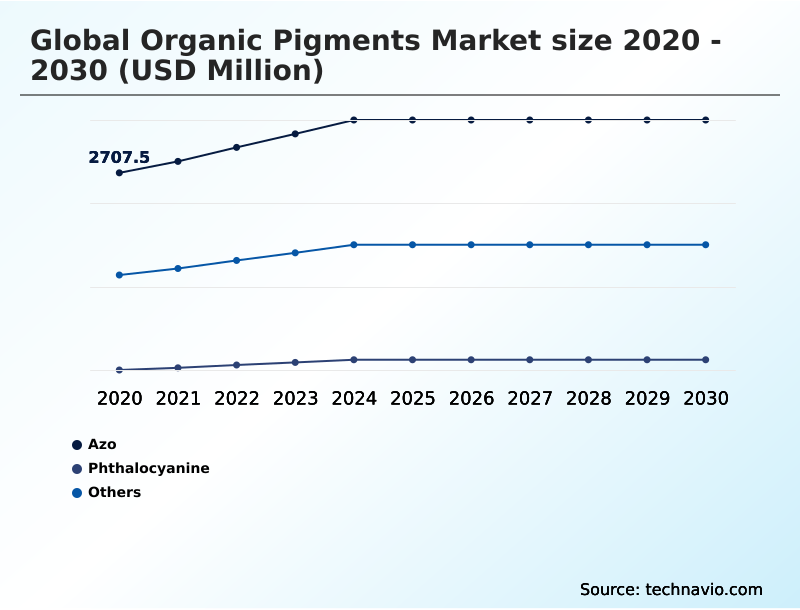
The Azo segment was valued at USD 3.22 billion in 2024 and showed a gradual increase during the forecast period.
Get Free Sample

Regional Analysis

APAC is estimated to contribute 44.4% to the growth of the global market during the forecast period.Technavio’s analysts have elaborately explained the regional trends and drivers that shape the market during the forecast period.
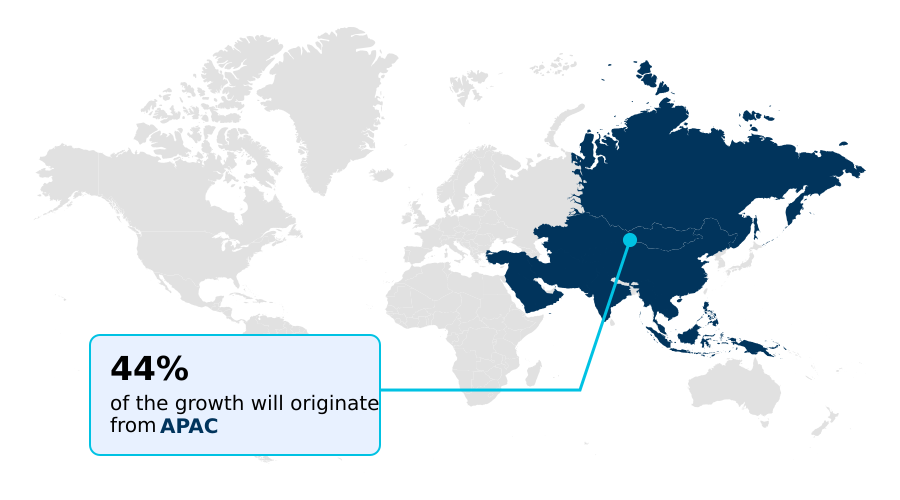
See How Organic Pigments Market Demand is Rising in APAC Get Free Sample

The geographic landscape of the Organic Pigments Market reveals distinct operational disparities driven by regional industrialization and regulatory frameworks.

The APAC region occupies a dominant manufacturing position, maintaining a 25% cost advantage in chemical synthesis over European counterparts due to highly integrated petrochemical intermediate feedstocks and lower operational conversion costs.

This localized production scale supports rapid expansion in synthetic plastic compounding and color filter manufacturing. Conversely, the European market prioritizes strict compliance with circular economy initiatives, resulting in a 30% higher adoption rate of bio-based intermediate alternatives.

European chemical formulators heavily invest in crystalline phase engineering and zero-liquid-discharge filtration to satisfy rigorous toxicological safety standards.

As APAC focuses on high-volume production efficiency to supply global export networks, European enterprises leverage advanced particle surface modification techniques to command premium pricing in specialized automotive and aerospace coating applications.

Market Dynamics

Our researchers analyzed the data with 2025 as the base year, along with the key drivers, trends, and challenges. A holistic analysis of drivers will help companies refine their marketing strategies to gain a competitive advantage.

  • The structural evolution of the Organic Pigments Market is heavily influenced by the rigorous technical demands of modern manufacturing ecosystems. Industrial formulators are increasingly prioritizing high-performance organic pigments for automotive applications to achieve superior exterior durability and intense chromatic properties without compromising thermal stability.
  • Simultaneously, the consumer packaging sector is experiencing a rapid structural shift, accelerating the deployment of eco-friendly organic colorants for packaging to align with stringent food-safety regulations and circular economy mandates. This transition directly impacts supply chain operations, as sustainable raw materials exhibit nearly a 15% improvement in processing compatibility compared to conventional synthetic inputs, reducing energy expenditures during compounding.
  • Furthermore, continuous advancements in chemical processing are elevating synthetic organic pigments thermal stability, allowing these specialized colorants to withstand the severe temperature profiles required for engineering thermoplastics. In the digital printing sector, the commercialization of high-speed inkjet hardware necessitates ultra-fine aqueous pigment dispersions for inkjet applications to maintain jetting consistency and prevent nozzle clogging.
  • To mitigate reliance on volatile petrochemical feedstocks, pioneering chemical synthesizers are investing substantial research capital into bio-based organic pigments formulation. These strategic material innovations empower manufacturers to optimize their procurement planning, reduce environmental compliance risks, and establish robust, future-proof product portfolios that cater to the evolving aesthetic and functional requirements of premium global end-use industries.
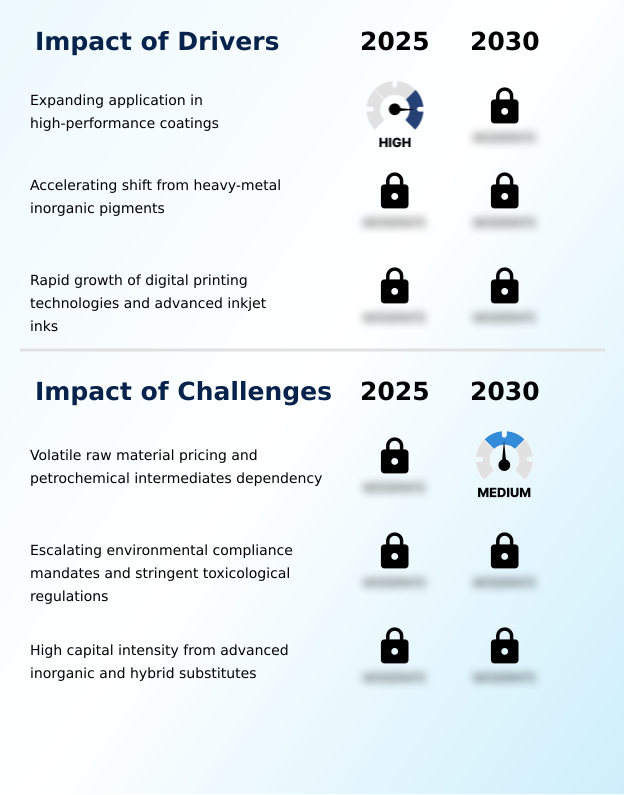
What are the key market drivers leading to the rise in the adoption of Organic Pigments Industry?

  • The expanding application of high-performance organic colorants in premium automotive finishes and architectural coatings acts as a primary catalyst propelling industry expansion.

  • The Organic Pigments Market is propelled by the surging integration of high-performance colorants across premium automotive finishes, architectural coatings, and sustainable packaging.
  • Coating formulators are aggressively replacing heavy-metal inorganic colorants with advanced synthetic organic alternatives to achieve superior color intensity and brilliant opacity.
  • This critical material transition enables industrial manufacturers to improve exterior coating durability by 25% while simultaneously lowering operational compliance costs by 12%.
  • Because modern aqueous copper phthalocyanine dispersions possess exceptional resistance to extreme thermal processing and ultraviolet radiation, they are indispensable for durable exterior applications.
  • The ongoing investment in low-viscosity aqueous dispersions enhances pigment dispersion within complex resin systems, directly reducing manufacturing friction and maximizing yield consistency for downstream industrial applicators.

What are the market trends shaping the Organic Pigments Industry?

  • The transition toward sustainable and bio-based organic colorant formulations represents a significant structural trend shaping strategic product portfolios. Chemical processors are actively pivoting toward renewable biological inputs to satisfy expanding corporate environmental sustainability targets.

  • The continuous evolution of the Organic Pigments Market is heavily influenced by the rapid adoption of high-performance organic formulations within smart and functional industrial coatings. Industrial end users increasingly require multi-functional colorants that offer high infrared reflection and enhanced electronic dispersion compatibility alongside basic aesthetic appeal.
  • This structural shift toward advanced isoindolines and anthraquinone derivatives allows coating formulators to optimize energy efficiency on urban structures, reducing solar heat absorption by up to 18%. Furthermore, the integration of advanced pigment micro-dispersions in digital textile printing has improved color reproduction accuracy by 22%, significantly lowering chemical waste during short-run customization.
  • This technological transition minimizes operational dependence on traditional analog methodologies, empowering manufacturers to streamline production workflows and elevate product performance across aggressive chemical environments.

What challenges does the Organic Pigments Industry face during its growth?

  • Extreme price volatility and supply chain vulnerabilities associated with upstream petrochemical intermediates create severe operational friction for chemical manufacturers worldwide.

  • The Organic Pigments Market faces severe operational limitations stemming from extreme price volatility and persistent supply chain vulnerabilities associated with upstream petrochemical precursors. Because the synthesis of macrocyclic compounds relies fundamentally on basic aromatic building blocks directly tied to crude oil refining, unexpected energy market fluctuations cascade immediately into production costs.
  • This dependency frequently degrades operating margins by up to 15%, compelling chemical synthesizers to maintain higher working capital reserves. Furthermore, complying with evolving global chemical safety frameworks requires continuous capital investment into sophisticated zero-liquid-discharge filtration and gas scrubbing units.
  • This compounding regulatory burden increases baseline processing expenditures by nearly 20%, disproportionately affecting mid-sized manufacturers and hindering strategic capacity expansions across highly fragmented international commercial landscapes.

Exclusive Technavio Analysis on Customer Landscape

The organic pigments market forecasting report includes the adoption lifecycle of the market, covering from the innovator’s stage to the laggard’s stage. It focuses on adoption rates in different regions based on penetration. Furthermore, the organic pigments market report also includes key purchase criteria and drivers of price sensitivity to help companies evaluate and develop their market growth analysis strategies.
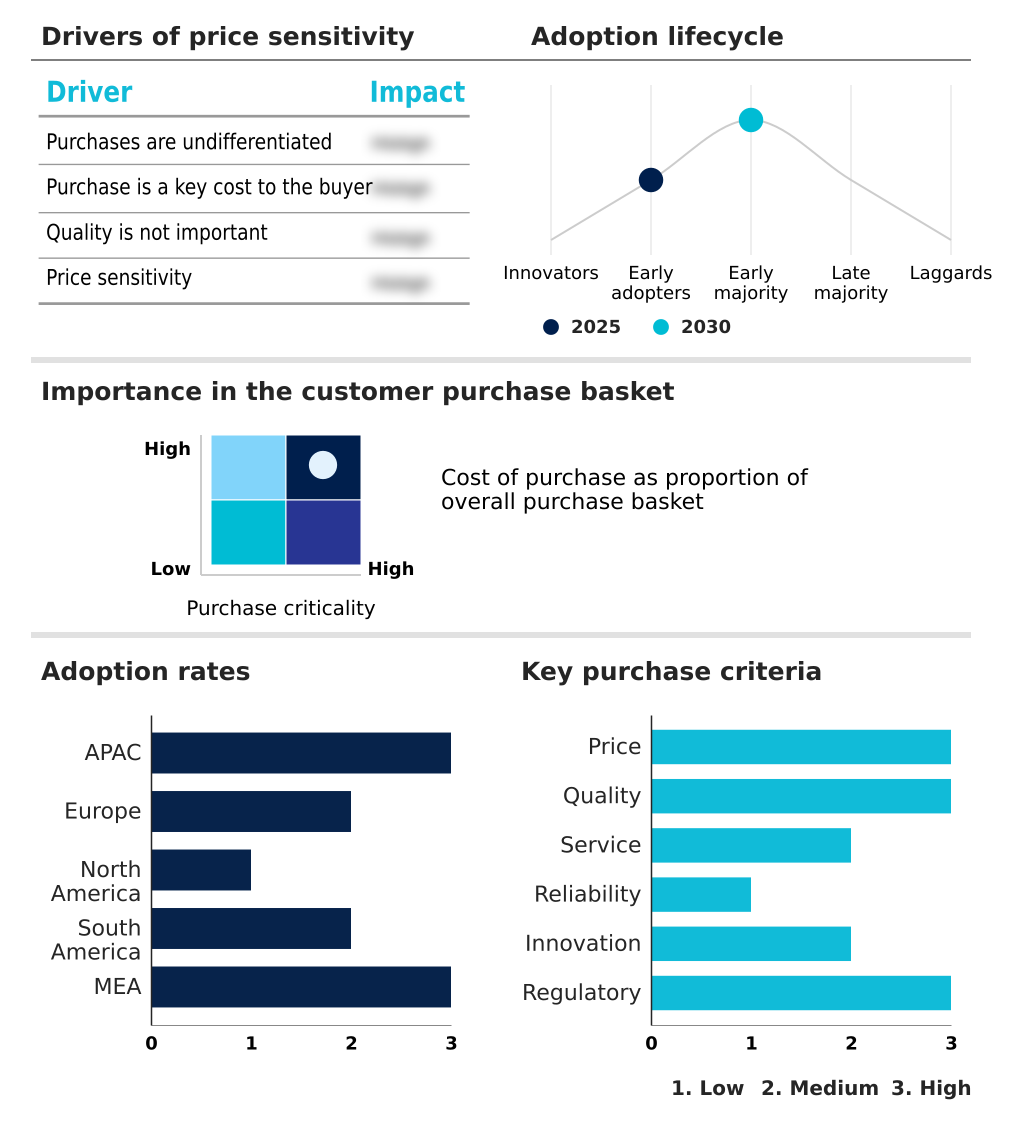
Customer Landscape of Organic Pigments Industry

Competitive Landscape

Companies are implementing various strategies, such as strategic alliances, organic pigments market forecast, partnerships, mergers and acquisitions, geographical expansion, and product/service launches, to enhance their presence in the industry.

Apex Pigments Pvt. Ltd. - The portfolio includes specialized high-performance organic pigments and color-matching powders engineered for ink, plastic, and coating formulators to deliver heat-stable, weather-resistant, and brilliant chromatic solutions.

The industry research and growth report includes detailed analyses of the competitive landscape of the market and information about key companies, including:

  • Apex Pigments Pvt. Ltd.
  • artience Co. Ltd.
  • Clariant International Ltd.
  • Colourscapes Inc
  • DIC Corp.
  • Heubach Colorants India Ltd
  • Heubach GmbH
  • Holland Colours NV
  • Hunan Huayuan Pigment Co. Ltd.
  • Kanani Pigments Pvt Ltd
  • Lona Industries ltd
  • Nirva Pigments
  • Phthalo Colors and Chemicals
  • Pidilite Industries Ltd.
  • Pigments India
  • Riverside Industries Inc.
  • Shubh Organics
  • Sudarshan Chemical Industries
  • Sun Chemical Corp.
  • Texcoat Colors

Qualitative and quantitative analysis of companies has been conducted to help clients understand the wider business environment as well as the strengths and weaknesses of key industry players. Data is qualitatively analyzed to categorize companies as pure play, category-focused, industry-focused, and diversified; it is quantitatively analyzed to categorize companies as dominant, leading, strong, tentative, and weak.

Recent Development and News in Organic pigments market

  • In the Specialty Chemicals industry, the worldwide implementation of rigorous environmental protection mandates restricting heavy-metal-based inorganic colorants has forced industrial chemical formulators to transition toward eco-friendly alternatives, directly impacting Organic Pigments Market demand by accelerating the adoption of non-toxic synthetic organic substitutes.
  • The rapid commercialization and technical advancement of high-speed digital inkjet printing platforms require exceptionally pure micro-encapsulated organic pigment dispersions, driving a 20% increase in research capital allocated to developing stable, low-viscosity aqueous formulations that prevent nozzle clogging and maintain jetting stability.
  • Volatile raw material pricing and structural supply disruptions associated with upstream petrochemical feedstocks have compressed operating margins, compelling pigment synthesizers to maintain higher working capital reserves and invest in renewable bio-based aromatic intermediates to ensure long-term production stability.
  • The escalating demand for smart functional coatings with high infrared reflection and enhanced thermal stability in automotive exterior applications has accelerated the adoption of high-performance polycyclic pigments, allowing coating manufacturers to achieve superior weatherability and color consistency under extreme environmental exposure.

Dive into Technavio’s robust research methodology, blending expert interviews, extensive data synthesis, and validated models for unparalleled Organic Pigments Market insights. See full methodology.

Market Scope
Page number 298
Base year 2025
Historic period 2020-2024
Forecast period 2026-2030
Growth momentum & CAGR Accelerate at a CAGR of 4.5%
Market growth 2026-2030 USD 1549.2 million
Market structure Fragmented
YoY growth 2025-2026(%) 4.3%
Key countries China, India, Japan, South Korea, Australia, Indonesia, Germany, Italy, UK, France, Spain, The Netherlands, US, Canada, Mexico, Brazil, Argentina, Colombia, Turkey, South Africa, Saudi Arabia, UAE and Egypt
Competitive landscape Leading Companies, Market Positioning of Companies, Competitive Strategies, and Industry Risks

Request Free Sample

Research Analyst Overview

  • The Organic Pigments Market is undergoing a fundamental transformation driven by the escalating demand for environmentally friendly, highly durable colorant solutions across premium industrial applications. Chemical processors are actively pivoting toward advanced synthetic macrocyclic compounds and copper coordination complexes to formulate colorants capable of surviving aggressive environmental stress.
  • This technological evolution allows industrial end users to deploy specialized phthalocyanine blues and quinacridones in applications requiring extreme weatherability. By integrating precise micro-encapsulation techniques, manufacturers have successfully achieved a 30% reduction in processing friction during complex polymer compounding.
  • The strategic adoption of advanced particle surface modification further enhances pigment dispersion, directly influencing product pricing and compliance strategies within the architectural coatings sector. As regulatory bodies impose strict limitations on heavy-metal traces, the transition toward specialized diketopyrrolopyrroles and perylenes ensures alignment with international environmental mandates.
  • This continuous refinement of chemical synthesis pathways and crystalline structures establishes a resilient, high-performance product ecosystem that addresses the rigorous technical specifications of modern automotive, aerospace, and advanced packaging industries.

What are the Key Data Covered in this Organic Pigments Market Research and Growth Report?

  • What is the expected growth of the Organic Pigments Market between 2026 and 2030?

    • USD 1.55 billion, at a CAGR of 4.5%

  • What segmentation does the market report cover?

    • The report is segmented by Type (Azo, Phthalocyanine, and Others), Application (Printing inks, Paints and coatings, Plastics, and Others), Source (Synthetic, and Natural) and Geography (APAC, Europe, North America, South America, Middle East and Africa)

  • Which regions are analyzed in the report?

    • APAC, Europe, North America, South America and Middle East and Africa

  • What are the key growth drivers and market challenges?

    • Expanding application in high-performance coatings, Volatile raw material pricing and petrochemical intermediates dependency

  • Who are the major players in the Organic Pigments Market?

    • Apex Pigments Pvt. Ltd., artience Co. Ltd., Clariant International Ltd., Colourscapes Inc, DIC Corp., Heubach Colorants India Ltd, Heubach GmbH, Holland Colours NV, Hunan Huayuan Pigment Co. Ltd., Kanani Pigments Pvt Ltd, Lona Industries ltd, Nirva Pigments, Phthalo Colors and Chemicals, Pidilite Industries Ltd., Pigments India, Riverside Industries Inc., Shubh Organics, Sudarshan Chemical Industries, Sun Chemical Corp. and Texcoat Colors

Market Research Insights

  • The Organic Pigments Market is characterized by rapid technological innovation and a structural shift toward sustainable manufacturing practices. Industrial formulators increasingly prioritize weather-resistant colorants and specialty amine precursors to enhance the longevity of energy-efficient architectural paints. By integrating these advanced formulations, coating manufacturers have improved product lifespan by 20%, directly reducing long-term maintenance costs for end users.
  • Furthermore, the adoption of low-emission crystallization processes has lowered volatile organic compound emissions by 15%, aligning production operations with stringent decarbonization goals. This strategic pivot ensures compliance with evolving food-contact safety standards while optimizing supply chain efficiency across premium commercial packaging and industrial maintenance sectors.

We can help! Our analysts can customize this organic pigments market research report to meet your requirements.

Get in touch

1. Executive Summary

1.1 Market overview

Executive Summary - Chart on Market Overview
Executive Summary - Data Table on Market Overview
Executive Summary - Chart on Global Market Characteristics
Executive Summary - Chart on Market by Geography
Executive Summary - Chart on Market Segmentation by Type
Executive Summary - Chart on Market Segmentation by Application
Executive Summary - Chart on Market Segmentation by Source
Executive Summary - Chart on Incremental Growth
Executive Summary - Data Table on Incremental Growth
Executive Summary - Chart on Company Market Positioning

2. Technavio Analysis

2.1 Analysis of price sensitivity, lifecycle, customer purchase basket, adoption rates, and purchase criteria

2.2 Criticality of inputs and Factors of differentiation

Chart on Overview on criticality of inputs and factors of differentiation

2.3 Factors of disruption

Chart on Overview on factors of disruption

2.4 Impact of drivers and challenges

Chart on Impact of drivers and challenges in 2025 and 2030

3. Market Landscape

3.1 Market ecosystem

Chart on Parent Market
Data Table on - Parent Market

3.2 Market characteristics

Chart on Market characteristics analysis

3.3 Value chain analysis

Chart on Value chain analysis

4. Market Sizing

4.1 Market definition

Data Table on Offerings of companies included in the market definition

4.2 Market segment analysis

Market segments

4.3 Market size 2025

4.4 Market outlook: Forecast for 2025-2030

Chart on Global - Market size and forecast 2025-2030 ($ million)
Data Table on Global - Market size and forecast 2025-2030 ($ million)
Chart on Global Market: Year-over-year growth 2025-2030 (%)
Data Table on Global Market: Year-over-year growth 2025-2030 (%)

5. Historic Market Size

5.1 Global Organic Pigments Market 2020 - 2024

Historic Market Size - Data Table on Global Organic Pigments Market 2020 - 2024 ($ million)

5.2 Type segment analysis 2020 - 2024

Historic Market Size - Type Segment 2020 - 2024 ($ million)

5.3 Application segment analysis 2020 - 2024

Historic Market Size - Application Segment 2020 - 2024 ($ million)

5.4 Source segment analysis 2020 - 2024

Historic Market Size - Source Segment 2020 - 2024 ($ million)

5.5 Geography segment analysis 2020 - 2024

Historic Market Size - Geography Segment 2020 - 2024 ($ million)

5.6 Country segment analysis 2020 - 2024

Historic Market Size - Country Segment 2020 - 2024 ($ million)

6. Qualitative Analysis

6.1 Impact of AI in Global Organic Pigments Market

6.2 Impact of Geopolitical Conflicts on Global Organic Pigments Market

7. Five Forces Analysis

7.1 Five forces summary

Five forces analysis - Comparison between 2025 and 2030

7.2 Bargaining power of buyers

Bargaining power of buyers - Impact of key factors 2025 and 2030

7.3 Bargaining power of suppliers

Bargaining power of suppliers - Impact of key factors in 2025 and 2030

7.4 Threat of new entrants

Threat of new entrants - Impact of key factors in 2025 and 2030

7.5 Threat of substitutes

Threat of substitutes - Impact of key factors in 2025 and 2030

7.6 Threat of rivalry

Threat of rivalry - Impact of key factors in 2025 and 2030

7.7 Market condition

Chart on Market condition - Five forces 2025 and 2030

8. Market Segmentation by Type

8.1 Market segments

Chart on Type - Market share 2025-2030 (%)
Data Table on Type - Market share 2025-2030 (%)

8.2 Comparison by Type

Chart on Comparison by Type
Data Table on Comparison by Type

8.3 Azo - Market size and forecast 2025-2030

Chart on Azo - Market size and forecast 2025-2030 ($ million)
Data Table on Azo - Market size and forecast 2025-2030 ($ million)
Chart on Azo - Year-over-year growth 2025-2030 (%)
Data Table on Azo - Year-over-year growth 2025-2030 (%)

8.4 Phthalocyanine - Market size and forecast 2025-2030

Chart on Phthalocyanine - Market size and forecast 2025-2030 ($ million)
Data Table on Phthalocyanine - Market size and forecast 2025-2030 ($ million)
Chart on Phthalocyanine - Year-over-year growth 2025-2030 (%)
Data Table on Phthalocyanine - Year-over-year growth 2025-2030 (%)

8.5 Others - Market size and forecast 2025-2030

Chart on Others - Market size and forecast 2025-2030 ($ million)
Data Table on Others - Market size and forecast 2025-2030 ($ million)
Chart on Others - Year-over-year growth 2025-2030 (%)
Data Table on Others - Year-over-year growth 2025-2030 (%)

8.6 Market opportunity by Type

Market opportunity by Type ($ million)
Data Table on Market opportunity by Type ($ million)

9. Market Segmentation by Application

9.1 Market segments

Chart on Application - Market share 2025-2030 (%)
Data Table on Application - Market share 2025-2030 (%)

9.2 Comparison by Application

Chart on Comparison by Application
Data Table on Comparison by Application

9.3 Printing inks - Market size and forecast 2025-2030

Chart on Printing inks - Market size and forecast 2025-2030 ($ million)
Data Table on Printing inks - Market size and forecast 2025-2030 ($ million)
Chart on Printing inks - Year-over-year growth 2025-2030 (%)
Data Table on Printing inks - Year-over-year growth 2025-2030 (%)

9.4 Paints and coatings - Market size and forecast 2025-2030

Chart on Paints and coatings - Market size and forecast 2025-2030 ($ million)
Data Table on Paints and coatings - Market size and forecast 2025-2030 ($ million)
Chart on Paints and coatings - Year-over-year growth 2025-2030 (%)
Data Table on Paints and coatings - Year-over-year growth 2025-2030 (%)

9.5 Plastics - Market size and forecast 2025-2030

Chart on Plastics - Market size and forecast 2025-2030 ($ million)
Data Table on Plastics - Market size and forecast 2025-2030 ($ million)
Chart on Plastics - Year-over-year growth 2025-2030 (%)
Data Table on Plastics - Year-over-year growth 2025-2030 (%)

9.6 Others - Market size and forecast 2025-2030

Chart on Others - Market size and forecast 2025-2030 ($ million)
Data Table on Others - Market size and forecast 2025-2030 ($ million)
Chart on Others - Year-over-year growth 2025-2030 (%)
Data Table on Others - Year-over-year growth 2025-2030 (%)

9.7 Market opportunity by Application

Market opportunity by Application ($ million)
Data Table on Market opportunity by Application ($ million)

10. Market Segmentation by Source

10.1 Market segments

Chart on Source - Market share 2025-2030 (%)
Data Table on Source - Market share 2025-2030 (%)

10.2 Comparison by Source

Chart on Comparison by Source
Data Table on Comparison by Source

10.3 Synthetic - Market size and forecast 2025-2030

Chart on Synthetic - Market size and forecast 2025-2030 ($ million)
Data Table on Synthetic - Market size and forecast 2025-2030 ($ million)
Chart on Synthetic - Year-over-year growth 2025-2030 (%)
Data Table on Synthetic - Year-over-year growth 2025-2030 (%)

10.4 Natural - Market size and forecast 2025-2030

Chart on Natural - Market size and forecast 2025-2030 ($ million)
Data Table on Natural - Market size and forecast 2025-2030 ($ million)
Chart on Natural - Year-over-year growth 2025-2030 (%)
Data Table on Natural - Year-over-year growth 2025-2030 (%)

10.5 Market opportunity by Source

Market opportunity by Source ($ million)
Data Table on Market opportunity by Source ($ million)

11. Customer Landscape

11.1 Customer landscape overview

Analysis of price sensitivity, lifecycle, customer purchase basket, adoption rates, and purchase criteria

12. Geographic Landscape

12.1 Geographic segmentation

Chart on Market share by geography 2025-2030 (%)
Data Table on Market share by geography 2025-2030 (%)

12.2 Geographic comparison

Chart on Geographic comparison
Data Table on Geographic comparison

12.3 APAC - Market size and forecast 2025-2030

Chart on APAC - Market size and forecast 2025-2030 ($ million)
Data Table on APAC - Market size and forecast 2025-2030 ($ million)
Chart on APAC - Year-over-year growth 2025-2030 (%)
Data Table on APAC - Year-over-year growth 2025-2030 (%)
Chart on Regional Comparison - APAC
Data Table on Regional Comparison - APAC

12.3.1 China - Market size and forecast 2025-2030

Chart on China - Market size and forecast 2025-2030 ($ million)
Data Table on China - Market size and forecast 2025-2030 ($ million)
Chart on China - Year-over-year growth 2025-2030 (%)
Data Table on China - Year-over-year growth 2025-2030 (%)

12.3.2 India - Market size and forecast 2025-2030

Chart on India - Market size and forecast 2025-2030 ($ million)
Data Table on India - Market size and forecast 2025-2030 ($ million)
Chart on India - Year-over-year growth 2025-2030 (%)
Data Table on India - Year-over-year growth 2025-2030 (%)

12.3.3 Japan - Market size and forecast 2025-2030

Chart on Japan - Market size and forecast 2025-2030 ($ million)
Data Table on Japan - Market size and forecast 2025-2030 ($ million)
Chart on Japan - Year-over-year growth 2025-2030 (%)
Data Table on Japan - Year-over-year growth 2025-2030 (%)

12.3.4 South Korea - Market size and forecast 2025-2030

Chart on South Korea - Market size and forecast 2025-2030 ($ million)
Data Table on South Korea - Market size and forecast 2025-2030 ($ million)
Chart on South Korea - Year-over-year growth 2025-2030 (%)
Data Table on South Korea - Year-over-year growth 2025-2030 (%)

12.3.5 Australia - Market size and forecast 2025-2030

Chart on Australia - Market size and forecast 2025-2030 ($ million)
Data Table on Australia - Market size and forecast 2025-2030 ($ million)
Chart on Australia - Year-over-year growth 2025-2030 (%)
Data Table on Australia - Year-over-year growth 2025-2030 (%)

12.3.6 Indonesia - Market size and forecast 2025-2030

Chart on Indonesia - Market size and forecast 2025-2030 ($ million)
Data Table on Indonesia - Market size and forecast 2025-2030 ($ million)
Chart on Indonesia - Year-over-year growth 2025-2030 (%)
Data Table on Indonesia - Year-over-year growth 2025-2030 (%)

12.4 Europe - Market size and forecast 2025-2030

Chart on Europe - Market size and forecast 2025-2030 ($ million)
Data Table on Europe - Market size and forecast 2025-2030 ($ million)
Chart on Europe - Year-over-year growth 2025-2030 (%)
Data Table on Europe - Year-over-year growth 2025-2030 (%)
Chart on Regional Comparison - Europe
Data Table on Regional Comparison - Europe

12.4.1 Germany - Market size and forecast 2025-2030

Chart on Germany - Market size and forecast 2025-2030 ($ million)
Data Table on Germany - Market size and forecast 2025-2030 ($ million)
Chart on Germany - Year-over-year growth 2025-2030 (%)
Data Table on Germany - Year-over-year growth 2025-2030 (%)

12.4.2 Italy - Market size and forecast 2025-2030

Chart on Italy - Market size and forecast 2025-2030 ($ million)
Data Table on Italy - Market size and forecast 2025-2030 ($ million)
Chart on Italy - Year-over-year growth 2025-2030 (%)
Data Table on Italy - Year-over-year growth 2025-2030 (%)

12.4.3 UK - Market size and forecast 2025-2030

Chart on UK - Market size and forecast 2025-2030 ($ million)
Data Table on UK - Market size and forecast 2025-2030 ($ million)
Chart on UK - Year-over-year growth 2025-2030 (%)
Data Table on UK - Year-over-year growth 2025-2030 (%)

12.4.4 France - Market size and forecast 2025-2030

Chart on France - Market size and forecast 2025-2030 ($ million)
Data Table on France - Market size and forecast 2025-2030 ($ million)
Chart on France - Year-over-year growth 2025-2030 (%)
Data Table on France - Year-over-year growth 2025-2030 (%)

12.4.5 Spain - Market size and forecast 2025-2030

Chart on Spain - Market size and forecast 2025-2030 ($ million)
Data Table on Spain - Market size and forecast 2025-2030 ($ million)
Chart on Spain - Year-over-year growth 2025-2030 (%)
Data Table on Spain - Year-over-year growth 2025-2030 (%)

12.4.6 The Netherlands - Market size and forecast 2025-2030

Chart on The Netherlands - Market size and forecast 2025-2030 ($ million)
Data Table on The Netherlands - Market size and forecast 2025-2030 ($ million)
Chart on The Netherlands - Year-over-year growth 2025-2030 (%)
Data Table on The Netherlands - Year-over-year growth 2025-2030 (%)

12.5 North America - Market size and forecast 2025-2030

Chart on North America - Market size and forecast 2025-2030 ($ million)
Data Table on North America - Market size and forecast 2025-2030 ($ million)
Chart on North America - Year-over-year growth 2025-2030 (%)
Data Table on North America - Year-over-year growth 2025-2030 (%)
Chart on Regional Comparison - North America
Data Table on Regional Comparison - North America

12.5.1 US - Market size and forecast 2025-2030

Chart on US - Market size and forecast 2025-2030 ($ million)
Data Table on US - Market size and forecast 2025-2030 ($ million)
Chart on US - Year-over-year growth 2025-2030 (%)
Data Table on US - Year-over-year growth 2025-2030 (%)

12.5.2 Canada - Market size and forecast 2025-2030

Chart on Canada - Market size and forecast 2025-2030 ($ million)
Data Table on Canada - Market size and forecast 2025-2030 ($ million)
Chart on Canada - Year-over-year growth 2025-2030 (%)
Data Table on Canada - Year-over-year growth 2025-2030 (%)

12.5.3 Mexico - Market size and forecast 2025-2030

Chart on Mexico - Market size and forecast 2025-2030 ($ million)
Data Table on Mexico - Market size and forecast 2025-2030 ($ million)
Chart on Mexico - Year-over-year growth 2025-2030 (%)
Data Table on Mexico - Year-over-year growth 2025-2030 (%)

12.6 South America - Market size and forecast 2025-2030

Chart on South America - Market size and forecast 2025-2030 ($ million)
Data Table on South America - Market size and forecast 2025-2030 ($ million)
Chart on South America - Year-over-year growth 2025-2030 (%)
Data Table on South America - Year-over-year growth 2025-2030 (%)
Chart on Regional Comparison - South America
Data Table on Regional Comparison - South America

12.6.1 Brazil - Market size and forecast 2025-2030

Chart on Brazil - Market size and forecast 2025-2030 ($ million)
Data Table on Brazil - Market size and forecast 2025-2030 ($ million)
Chart on Brazil - Year-over-year growth 2025-2030 (%)
Data Table on Brazil - Year-over-year growth 2025-2030 (%)

12.6.2 Argentina - Market size and forecast 2025-2030

Chart on Argentina - Market size and forecast 2025-2030 ($ million)
Data Table on Argentina - Market size and forecast 2025-2030 ($ million)
Chart on Argentina - Year-over-year growth 2025-2030 (%)
Data Table on Argentina - Year-over-year growth 2025-2030 (%)

12.6.3 Colombia - Market size and forecast 2025-2030

Chart on Colombia - Market size and forecast 2025-2030 ($ million)
Data Table on Colombia - Market size and forecast 2025-2030 ($ million)
Chart on Colombia - Year-over-year growth 2025-2030 (%)
Data Table on Colombia - Year-over-year growth 2025-2030 (%)

12.7 Middle East and Africa - Market size and forecast 2025-2030

Chart on Middle East and Africa - Market size and forecast 2025-2030 ($ million)
Data Table on Middle East and Africa - Market size and forecast 2025-2030 ($ million)
Chart on Middle East and Africa - Year-over-year growth 2025-2030 (%)
Data Table on Middle East and Africa - Year-over-year growth 2025-2030 (%)
Chart on Regional Comparison - Middle East and Africa
Data Table on Regional Comparison - Middle East and Africa

12.7.1 Turkey - Market size and forecast 2025-2030

Chart on Turkey - Market size and forecast 2025-2030 ($ million)
Data Table on Turkey - Market size and forecast 2025-2030 ($ million)
Chart on Turkey - Year-over-year growth 2025-2030 (%)
Data Table on Turkey - Year-over-year growth 2025-2030 (%)

12.7.2 South Africa - Market size and forecast 2025-2030

Chart on South Africa - Market size and forecast 2025-2030 ($ million)
Data Table on South Africa - Market size and forecast 2025-2030 ($ million)
Chart on South Africa - Year-over-year growth 2025-2030 (%)
Data Table on South Africa - Year-over-year growth 2025-2030 (%)

12.7.3 Saudi Arabia - Market size and forecast 2025-2030

Chart on Saudi Arabia - Market size and forecast 2025-2030 ($ million)
Data Table on Saudi Arabia - Market size and forecast 2025-2030 ($ million)
Chart on Saudi Arabia - Year-over-year growth 2025-2030 (%)
Data Table on Saudi Arabia - Year-over-year growth 2025-2030 (%)

12.7.4 UAE - Market size and forecast 2025-2030

Chart on UAE - Market size and forecast 2025-2030 ($ million)
Data Table on UAE - Market size and forecast 2025-2030 ($ million)
Chart on UAE - Year-over-year growth 2025-2030 (%)
Data Table on UAE - Year-over-year growth 2025-2030 (%)

12.7.5 Egypt - Market size and forecast 2025-2030

Chart on Egypt - Market size and forecast 2025-2030 ($ million)
Data Table on Egypt - Market size and forecast 2025-2030 ($ million)
Chart on Egypt - Year-over-year growth 2025-2030 (%)
Data Table on Egypt - Year-over-year growth 2025-2030 (%)

12.8 Market opportunity by geography

Market opportunity by geography ($ million)
Data Tables on Market opportunity by geography ($ million)

13. Drivers, Challenges, and Opportunity

13.1 Market drivers

Expanding application in high-performance coatings
Accelerating shift from heavy-metal inorganic pigments
Rapid growth of digital printing technologies and advanced inkjet inks

13.2 Market challenges

Volatile raw material pricing and petrochemical intermediates dependency
Escalating environmental compliance mandates and stringent toxicological regulations
High capital intensity from advanced inorganic and hybrid substitutes

13.3 Impact of drivers and challenges

Impact of drivers and challenges in 2025 and 2030

13.4 Market opportunities

Transition toward sustainable and bio-based organic colorant formulations
Adoption of high-performance organic pigments in smart and functional coatings
Expansion of high-purity micro-dispersion technologies

14. Competitive Landscape

14.1 Overview

14.2

Overview on criticality of inputs and factors of differentiation

14.3 Landscape disruption

Overview on factors of disruption

14.4 Industry risks

Impact of key risks on business

15. Competitive Analysis

15.1 Companies profiled

Companies covered

15.2 Company ranking index

15.3 Market positioning of companies

Matrix on companies position and classification

15.4 artience Co. Ltd.

artience Co. Ltd. - Overview
artience Co. Ltd. - Product / Service
artience Co. Ltd. - Key offerings
SWOT

15.5 Clariant International Ltd.

Clariant International Ltd. - Overview
Clariant International Ltd. - Business segments
Clariant International Ltd. - Key offerings
Clariant International Ltd. - Segment focus
SWOT

15.6 Colourscapes Inc

Colourscapes Inc - Overview
Colourscapes Inc - Product / Service
Colourscapes Inc - Key offerings
SWOT

15.7 DIC Corp.

DIC Corp. - Overview
DIC Corp. - Business segments
DIC Corp. - Key news
DIC Corp. - Key offerings
DIC Corp. - Segment focus
SWOT

15.8 Heubach Colorants India Ltd

Heubach Colorants India Ltd - Overview
Heubach Colorants India Ltd - Product / Service
Heubach Colorants India Ltd - Key offerings
SWOT

15.9 Heubach GmbH

Heubach GmbH - Overview
Heubach GmbH - Product / Service
Heubach GmbH - Key offerings
SWOT

15.10 Holland Colours NV

Holland Colours NV - Overview
Holland Colours NV - Business segments
Holland Colours NV - Key offerings
Holland Colours NV - Segment focus
SWOT

15.11 Hunan Huayuan Pigment Co. Ltd.

Hunan Huayuan Pigment Co. Ltd. - Overview
Hunan Huayuan Pigment Co. Ltd. - Product / Service
Hunan Huayuan Pigment Co. Ltd. - Key offerings
SWOT

15.12 Lona Industries ltd

Lona Industries ltd - Overview
Lona Industries ltd - Product / Service
Lona Industries ltd - Key offerings
SWOT

15.13 Nirva Pigments

Nirva Pigments - Overview
Nirva Pigments - Product / Service
Nirva Pigments - Key offerings
SWOT

15.14 Phthalo Colors and Chemicals

Phthalo Colors and Chemicals - Overview
Phthalo Colors and Chemicals - Product / Service
Phthalo Colors and Chemicals - Key offerings
SWOT

15.15 Pidilite Industries Ltd.

Pidilite Industries Ltd. - Overview
Pidilite Industries Ltd. - Business segments
Pidilite Industries Ltd. - Key offerings
Pidilite Industries Ltd. - Segment focus
SWOT

15.16 Pigments India

Pigments India - Overview
Pigments India - Product / Service
Pigments India - Key offerings
SWOT

15.17 Sudarshan Chemical Industries

Sudarshan Chemical Industries - Overview
Sudarshan Chemical Industries - Business segments
Sudarshan Chemical Industries - Key offerings
Sudarshan Chemical Industries - Segment focus
SWOT

15.18 Sun Chemical Corp.

Sun Chemical Corp. - Overview
Sun Chemical Corp. - Product / Service
Sun Chemical Corp. - Key offerings
SWOT

16. Appendix

16.1 Scope of the report

Market definition
Objectives
Notes and caveats

16.2 Inclusions and exclusions checklist

Inclusions checklist
Exclusions checklist

16.3 Currency conversion rates for US$

16.4 Research methodology

16.5 Data procurement

Information sources

16.6 Data validation

16.7 Validation techniques employed for market sizing

16.8 Data synthesis

16.9 360 degree market analysis

16.10 List of abbreviations

Research Methodology

Technavio presents a detailed picture of the market by way of study, synthesis, and summation of data from multiple sources. The analysts have presented the various facets of the market with a particular focus on identifying the key industry influencers. The data thus presented is comprehensive, reliable, and the result of extensive research, both primary and secondary.

INFORMATION SOURCES

Primary sources

  • Manufacturers and suppliers
  • Channel partners
  • Industry experts
  • Strategic decision makers

Secondary sources

  • Industry journals and periodicals
  • Government data
  • Financial reports of key industry players
  • Historical data
  • Press releases

DATA ANALYSIS

Data Synthesis

  • Collation of data
  • Estimation of key figures
  • Analysis of derived insights

Data Validation

  • Triangulation with data models
  • Reference against proprietary databases
  • Corroboration with industry experts

REPORT WRITING

Qualitative

  • Market drivers
  • Market challenges
  • Market trends
  • Five forces analysis

Quantitative

  • Market size and forecast
  • Market segmentation
  • Geographical insights
  • Competitive landscape

Interested in this report?

Get your sample now to see our research methodology and insights!

Download Now

Frequently Asked Questions

Organic Pigments market growth will increase by USD 1549.2 million during 2026-2030.

The Organic Pigments market is expected to grow at a CAGR of 4.5% during 2026-2030.

Organic Pigments market is segmented by Type (Azo, Phthalocyanine, Others) Application (Printing inks, Paints and coatings, Plastics, Others) Source (Synthetic, Natural)

Apex Pigments Pvt. Ltd., artience Co. Ltd., Clariant International Ltd., Colourscapes Inc, DIC Corp., Heubach Colorants India Ltd, Heubach GmbH, Holland Colours NV, Hunan Huayuan Pigment Co. Ltd., Kanani Pigments Pvt Ltd, Lona Industries ltd, Nirva Pigments, Phthalo Colors and Chemicals, Pidilite Industries Ltd., Pigments India, Riverside Industries Inc., Shubh Organics, Sudarshan Chemical Industries, Sun Chemical Corp., Texcoat Colors are a few of the key vendors in the Organic Pigments market.

APAC will register the highest growth rate of 44.4% among the other regions. Therefore, the Organic Pigments market in APAC is expected to garner significant business opportunities for the vendors during the forecast period.

China, India, Japan, South Korea, Australia, Indonesia, Germany, Italy, UK, France, Spain, The Netherlands, US, Canada, Mexico, Brazil, Argentina, Colombia, Turkey, South Africa, Saudi Arabia, UAE, Egypt

  • Expanding application in high-performance coatings is the driving factor this market.

The Organic Pigments market vendors should focus on grabbing business opportunities from the Type segment as it accounted for the largest market share in the base year.
RIA - Research AI Assistant
Ask RIA
