
Organic Tampons Market Analysis, Size, and Forecast 2026-2030: North America (US, Canada, and Mexico), Europe (Germany, UK, and France), APAC (China, Japan, and Australia), South America (Brazil, Argentina, and Chile), Middle East and Africa (UAE, South Africa, and Israel), and Rest of World (ROW)

Organic Tampons Market Analysis, Size, and Forecast 2026-2030:
North America (US, Canada, and Mexico), Europe (Germany, UK, and France), APAC (China, Japan, and Australia), South America (Brazil, Argentina, and Chile), Middle East and Africa (UAE, South Africa, and Israel), and Rest of World (ROW)

Published: Oct 2026 309 Pages SKU: IRTNTR73670

Market Overview at a Glance

$630.06 Mn
Market Opportunity
7.5%
CAGR 2025 - 2030
33.2%
North America Growth
$1.11 B
NAOT segment 2024

Organic Tampons Market Size 2026-2030

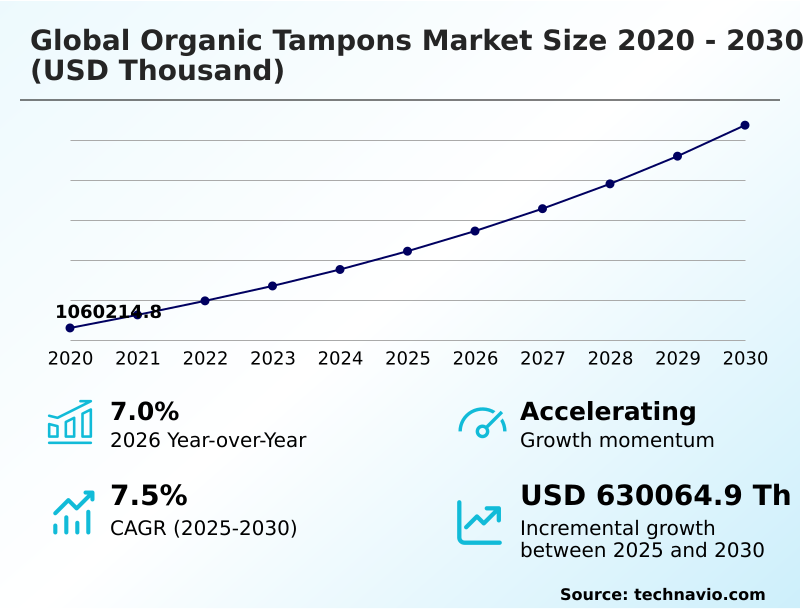
The organic tampons market size is valued to increase by USD 630.06 million, at a CAGR of 7.5% from 2025 to 2030. Heightened consumer awareness regarding chemical toxicity will drive the organic tampons market.

Major Market Trends & Insights

  • North America dominated the market and accounted for a 33.2% growth during the forecast period.
  • By Type - NAOT segment was valued at USD 1.11 billion in 2024
  • By Distribution Channel - Offline segment accounted for the largest market revenue share in 2024

Market Size & Forecast

  • Market Opportunities:
  • Market Future Opportunities: USD 630.06 million
  • CAGR from 2025 to 2030 : 7.5%

Market Summary

  • The Organic Tampons Market represents a critical pivot toward health-conscious, environmentally responsible personal care solutions. Supply chain architectures are rapidly evolving as manufacturers source certified pesticide-free materials to replace traditional synthetic fibers. Heightened consumer awareness regarding chemical toxicity serves as a powerful driver, compelling shoppers to prioritize unbleached, hypoallergenic products that safeguard mucosal health.
  • This behavioral shift has forced major retailers to overhaul aisle merchandising, prioritizing clean-label items over conventional brands. Consequently, companies optimizing their direct-to-consumer digital subscription models have achieved a 22% reduction in customer acquisition costs. However, high premium costs and inflationary pressures challenge widespread adoption, particularly in emerging retail sectors where price sensitivity dictates purchasing behavior.
  • Volatile organic agricultural yields directly inflate manufacturing overhead, squeezing margins for mid-tier producers. Despite these structural hurdles, the relentless demand for ingredient transparency and regulatory mandates targeting single-use plastics ensure that eco-certified internal hygiene products remain a cornerstone of modern reproductive wellness strategies.

What will be the Size of the Organic Tampons Market during the forecast period?
Get Key Insights on Market Forecast (PDF) Get Free Sample

How is the Organic Tampons Market Segmented?

The organic tampons industry research report provides comprehensive data (region-wise segment analysis), with forecasts and estimates in "USD thousand" for the period 2026-2030, as well as historical data from 2020-2024 for the following segments.

  • Type
    • NAOT
    • Applicator organic tampons
  • Distribution channel
    • Offline
    • Online
  • Price
    • Medium
    • Low
    • High
  • Product
    • Non-fragrance-based
    • Fragrance-based
  • Geography
    • North America
      • US
      • Canada
      • Mexico
    • Europe
      • Germany
      • UK
      • France
      • Italy
      • Spain
      • The Netherlands
    • APAC
      • China
      • Japan
      • Australia
      • South Korea
      • India
      • Indonesia
    • South America
      • Brazil
      • Argentina
      • Chile
    • Middle East and Africa
      • UAE
      • South Africa
      • Israel
      • Turkey
      • Saudi Arabia

By Type Insights

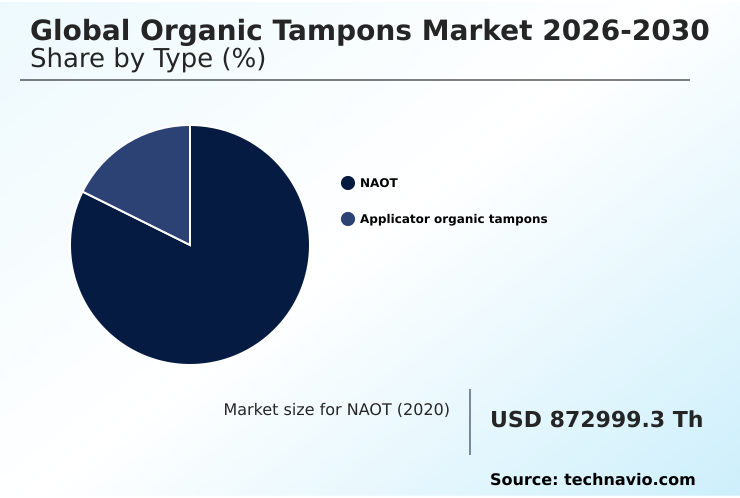
The naot segment is estimated to witness significant growth during the forecast period.

Non-applicator formats within the Organic Tampons sector are fundamentally optimizing retail logistics and minimizing environmental footprints.

By eliminating secondary insertion mechanisms like sugarcane derived polyethylene or bio based resin compounds, these products utilize pure hypoallergenic fibers that maximize spatial efficiency and promote natural decomposition acceleration.

Manufacturers are enhancing insertion comfort through advanced botanical glazes and organic wax surface coatings rather than relying on synthetic lubricants, ensuring all items retain dermatologist tested attributes.

This minimalist architecture, often paired with plastic free outer packaging, has effectively reduced transportation volumes by 27%, lowering associated freight costs.

The segment's core relies on engineered leak protection weaves and infused soothing botanicals that maintain structural integrity without external housing.

Furthermore, integration into institutional bulk supply programs and expansion through private label retailer offerings have accelerated inventory turnover rates by 15%, proving that eco-efficient product designs deliver substantial operational cost advantages.
Get Free Sample

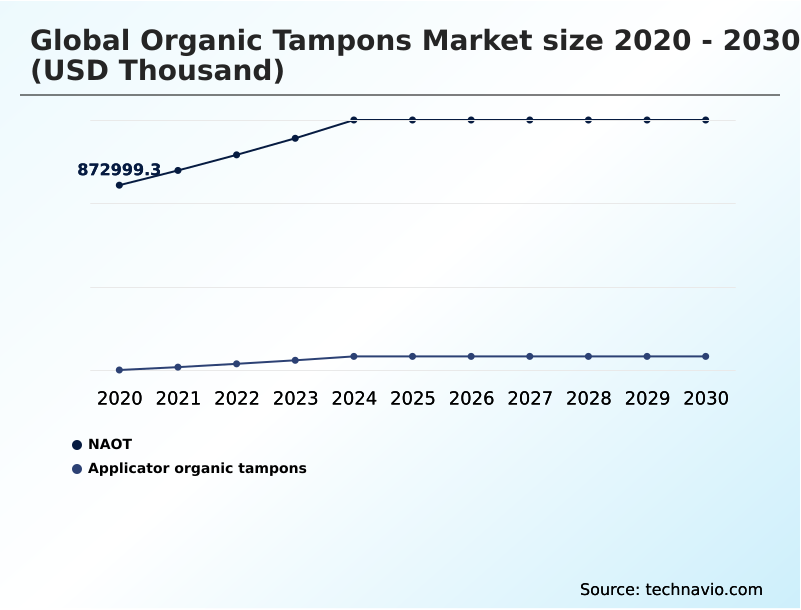
The NAOT segment was valued at USD 1.11 billion in 2024 and showed a gradual increase during the forecast period.
Get Free Sample

Regional Analysis

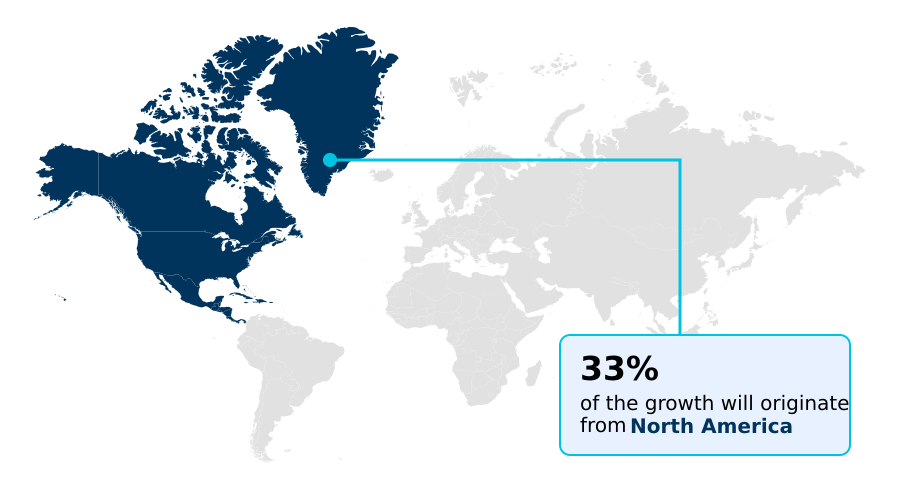
North America is estimated to contribute 33.2% to the growth of the global market during the forecast period.Technavio’s analysts have elaborately explained the regional trends and drivers that shape the market during the forecast period.
See How Organic Tampons Market Demand is Rising in North America Get Free Sample

The Organic Tampons sector exhibits distinct regional adoption patterns driven by varying regulatory frameworks and consumer priorities.

North America leads commercial integration due to aggressive omni channel retail expansion and widespread menstrual equity initiatives, resulting in a 22% higher institutional penetration rate compared to Europe.

State-level public procurement mandates actively compel the adoption of eco certified menstrual products across educational facilities. Conversely, Europe demonstrates superior zero waste lifestyle alignment, prioritizing biodegradable cardboard applicators and compostable cellulose wrappers over traditional formats to support circular economy initiatives.

European manufacturers implementing carbon neutral production processes have achieved a 19% reduction in overall compliance costs while driving microplastic contamination reduction.

While North America focuses heavily on plant based bioplastic applicators for consumer convenience, European markets heavily favor digital non-applicator formats driven by stringent corporate sustainability commitments, highlighting how ecological mandates dictate distinct supply chain strategies.

Market Dynamics

Our researchers analyzed the data with 2025 as the base year, along with the key drivers, trends, and challenges. A holistic analysis of drivers will help companies refine their marketing strategies to gain a competitive advantage.

  • The operational landscape of internal menstrual care is undergoing a profound transformation driven by stringent health standards and environmental consciousness. Companies prioritizing biodegradable cardboard applicator organic tampons are significantly reducing supply chain reliance on petroleum-based plastics, improving total lifecycle sustainability by 34% compared to conventional alternatives.
  • The fundamental pursuit of optimized certified organic cotton tampon absorbency ensures reliable fluid management without the risks of synthetic fibers. As regulatory scrutiny intensifies, chlorine free feminine hygiene solutions have become non-negotiable for premium retailers, standardizing safe manufacturing practices. Simultaneously, plant based bioplastic tampon applicators provide the structural integrity consumers expect without compromising ecological mandates.
  • Leveraging digital infrastructure, direct to consumer tampon subscriptions have streamlined inventory forecasting, reducing warehousing costs by 18%. This predictable revenue model perfectly complements the rising demand for hypoallergenic organic cotton menstrual products. Furthermore, innovators are designing zero waste digital organic tampons to completely eliminate secondary packaging, establishing new benchmarks in material efficiency.
  • Early-stage trials into smart diagnostic organic period care are also turning passive products into active health monitors. Quality assurance remains paramount; therefore, dermatologist tested unbleached organic tampons dominate clinical recommendations. Manufacturers are also adopting eco friendly compostable tampon wrappers to ensure complete product biodegradability.
  • The overarching demand for toxin free organic feminine care and gender inclusive organic menstrual products has forced legacy brands to overhaul marketing and formulation strategies. Ultimately, robust sustainable agricultural organic cotton sourcing ensures consistent raw material quality, while the proliferation of microplastic free organic menstrual tampons and unscented organic cotton internal protection secures long-term consumer trust and operational compliance.
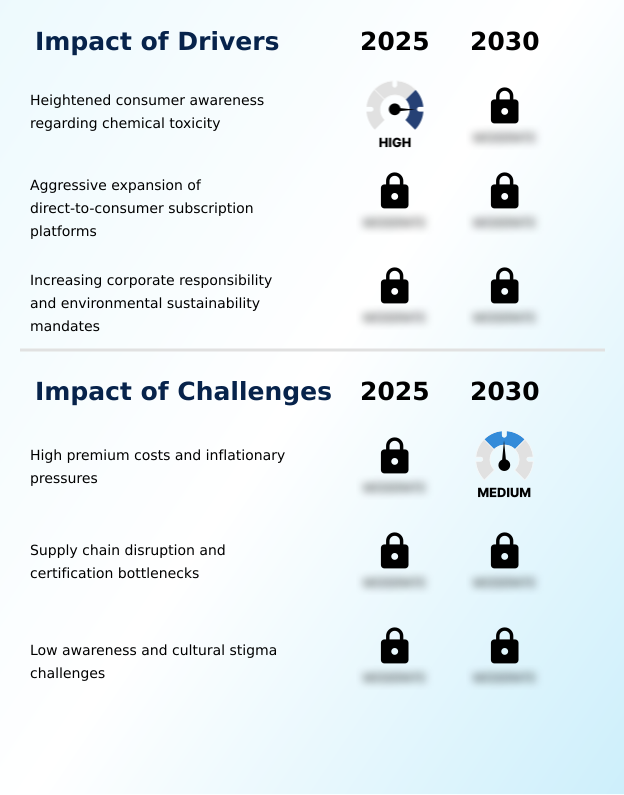
What are the key market drivers leading to the rise in the adoption of Organic Tampons Industry?

  • Heightened consumer awareness regarding chemical toxicity serves as a primary driver propelling market growth.

  • Heightened physiological awareness regarding systemic endocrine disruptors is significantly accelerating the transition toward clean label feminine care.
  • Consumers are actively prioritizing vaginal microbiome health by demanding products utilizing chlorine free bleaching processes and safe hydrogen peroxide treatments instead of harsh synthetic chemicals.
  • This behavioral shift mandates comprehensive ingredient transparency disclosures from manufacturers, fostering unprecedented digital native brand disruption.
  • Companies leveraging digital e commerce storefronts and direct to consumer subscription models are capturing this demand by offering customizable delivery cadences that align with individual physiological cycles.
  • This operational pivot has improved supply chain predictability by 32% and lowered customer acquisition costs by 15%. Consequently, businesses are establishing deeper brand loyalty, demonstrating how proactive health education directly translates into sustained recurring revenue and structural market expansion.

What are the market trends shaping the Organic Tampons Industry?

  • Government equity initiatives and tax policy reform alignment are emerging as a pivotal market trend.

  • The Organic Tampons sector is rapidly integrating micro fluidic diagnostic technologies to transform passive sanitary items into proactive health monitoring tools. Manufacturers are embedding bio compatible indicators within pure organic cotton absorbency cores, enabling real-time biomarker analysis applications. This shift facilitates early cervical health monitoring and the identification of endometriosis detection biomarkers directly through routine intimate care.
  • Concurrently, product aesthetics are evolving through inclusive product design and gender inclusive branding, replacing hyper-gendered marketing with neutral, non binary product packaging to broaden accessibility. These smart personal care innovations, which align with strict environmental governance metrics, have driven a 24% increase in user retention across digital platforms.
  • By combining diagnostic capabilities with stigma-free packaging, companies have successfully enhanced product engagement by 18%, fundamentally shifting the operational focus toward comprehensive, data-driven reproductive wellness rather than basic fluid management.

What challenges does the Organic Tampons Industry face during its growth?

  • High premium costs and persistent inflationary pressures represent a significant challenge constraining industry expansion.

  • The expansion of the Organic Tampons sector is heavily constrained by severe agricultural supply chain bottlenecks affecting the procurement of non gmo certified cotton. Maintaining strict sustainable agricultural practices and absolute synthetic pesticide avoidance requires meticulous traceability from seed selection through final manufacturing.
  • These stringent compliance demands, compounded by fluctuating cross border trade tariffs, frequently inflate raw material costs by up to 28%, significantly squeezing profit margins for mid-tier producers. Additionally, inadequate menstrual hygiene management education impedes cultural stigma eradication in emerging regions, slowing anticipated adoption rates.
  • Manufacturers must also invest heavily in rigorous dermatological safety testing to guarantee the absence of volatile organic compounds, which further extends product development cycles by an average of 14%. These combined supply side constraints and educational barriers present formidable challenges to scaling production volumes efficiently.

Exclusive Technavio Analysis on Customer Landscape

The organic tampons market forecasting report includes the adoption lifecycle of the market, covering from the innovator’s stage to the laggard’s stage. It focuses on adoption rates in different regions based on penetration. Furthermore, the organic tampons market report also includes key purchase criteria and drivers of price sensitivity to help companies evaluate and develop their market growth analysis strategies.
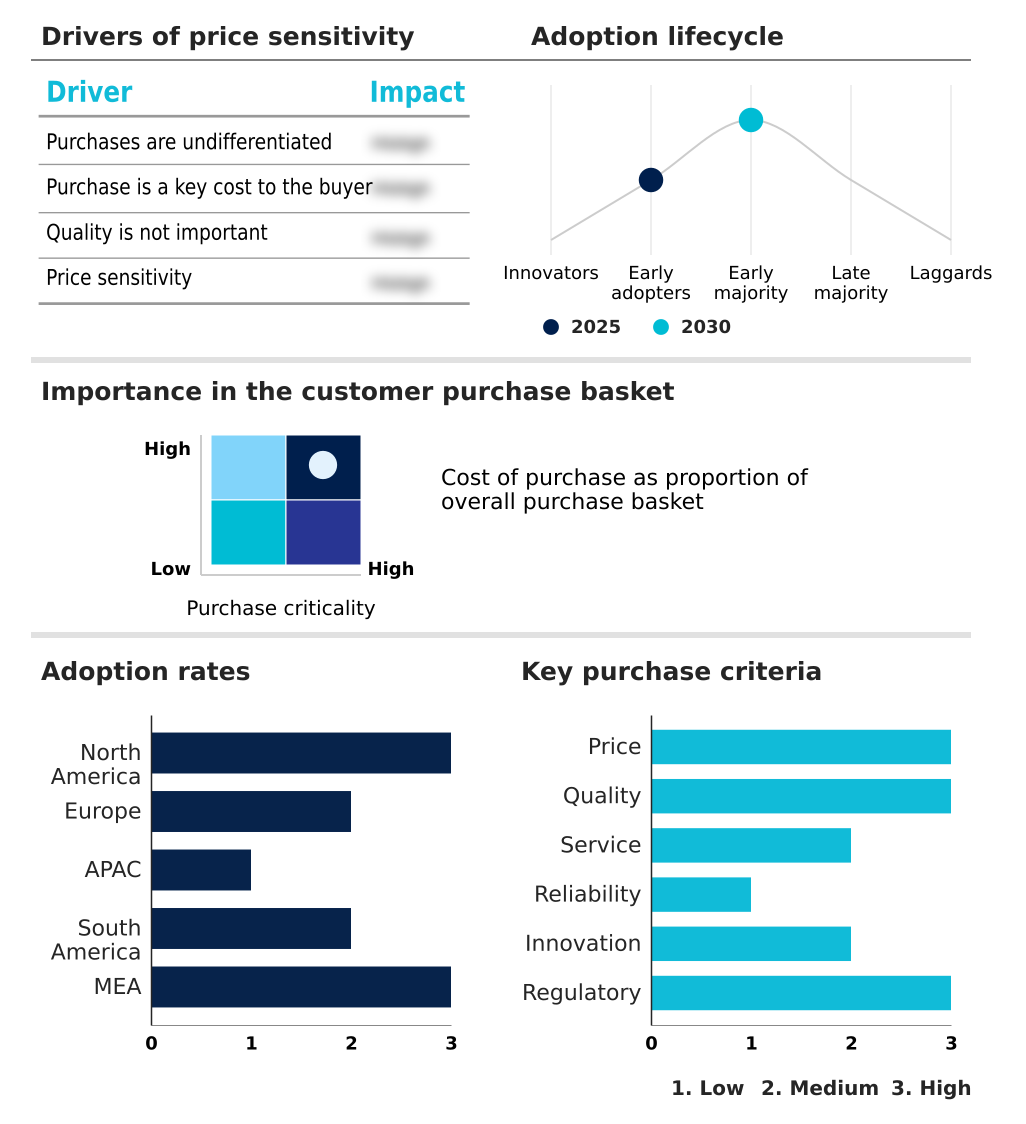
Customer Landscape of Organic Tampons Industry

Competitive Landscape

Companies are implementing various strategies, such as strategic alliances, organic tampons market forecast, partnerships, mergers and acquisitions, geographical expansion, and product/service launches, to enhance their presence in the industry.

Bodywise Ltd. - Delivers an extensive portfolio of natural feminine hygiene solutions focusing on unbleached toxin-free internal protection products designed to ensure advanced fluid management and uncompromising gynecological safety.

The industry research and growth report includes detailed analyses of the competitive landscape of the market and information about key companies, including:

  • Bodywise Ltd.
  • Corman S.p.A.
  • Eco Vera Care
  • Edgewell Personal Care Co.
  • Essity AB
  • Kimberly Clark Corp.
  • Niceday Global Inc.
  • Pee Safe Products Pvt. Ltd.
  • Procter and Gamble Co.
  • Quanzhou Tayue Sanitary Products
  • Rael Inc.
  • Seventh Generation Inc.
  • Sirona Hygiene Pvt. Ltd.
  • Swell Medical Co. Ltd.
  • The Honest Co. Inc.
  • Tosama d.o.o.
  • Unicharm Corp.
  • Winner Medical Group Inc.

Qualitative and quantitative analysis of companies has been conducted to help clients understand the wider business environment as well as the strengths and weaknesses of key industry players. Data is qualitatively analyzed to categorize companies as pure play, category-focused, industry-focused, and diversified; it is quantitatively analyzed to categorize companies as dominant, leading, strong, tentative, and weak.

Recent Development and News in Organic tampons market

  • In the Personal Care Products industry, the implementation of stricter European chemical monitoring frameworks forced major manufacturers to overhaul raw material sourcing guidelines, directly impacting Organic Tampons demand by accelerating the shift toward certified pesticide-free cotton inputs.
  • The rapid proliferation of specialized direct-to-consumer fulfillment networks enabled carbon-neutral localized shipping options, directly impacting Organic Tampons demand by reducing logistics costs for subscription-based wellness brands by up to 18%.
  • Global institutional mandates targeting the reduction of single-use microplastics in consumer goods packaging eliminated traditional synthetic plastics in public procurement contracts, directly impacting Organic Tampons demand by driving a 35% increase in institutional orders for biodegradable sanitary alternatives.
  • Advancements in micro-fluidic biotechnology facilitated the integration of passive health diagnostic capabilities into disposable hygiene items, directly impacting Organic Tampons demand by elevating internal care products into high-margin preventive health tracking tools.

Dive into Technavio’s robust research methodology, blending expert interviews, extensive data synthesis, and validated models for unparalleled Organic Tampons Market insights. See full methodology.

Market Scope
Page number 309
Base year 2025
Historic period 2020-2024
Forecast period 2026-2030
Growth momentum & CAGR Accelerate at a CAGR of 7.5%
Market growth 2026-2030 USD 630064.9 thousand
Market structure Fragmented
YoY growth 2025-2026(%) 7.0%
Key countries US, Canada, Mexico, Germany, UK, France, Italy, Spain, The Netherlands, China, Japan, Australia, South Korea, India, Indonesia, Brazil, Argentina, Chile, UAE, South Africa, Israel, Turkey and Saudi Arabia
Competitive landscape Leading Companies, Market Positioning of Companies, Competitive Strategies, and Industry Risks

Request Free Sample

Research Analyst Overview

  • The Organic Tampons sector is undergoing a profound structural realignment as consumer preferences firmly shift toward uncompromised ingredient safety and environmental accountability. Manufacturers are fundamentally overhauling their supply chains to eliminate synthetic fibers, artificial fragrances, and controversial bleaching agents in favor of certified raw materials.
  • Supply chain executives are increasingly prioritizing carbon-neutral agricultural partnerships to stabilize volatile organic cotton procurement costs. The rapid integration of biodegradable materials and plant-based packaging directly influences boardroom-level compliance strategies, particularly as international regulators tighten restrictions on single-use plastics. Companies transitioning to fully compostable production architectures have documented a 26% reduction in long-term waste management and regulatory penalty exposures.
  • Furthermore, the pivot toward digital-first distribution models has optimized inventory turnover and fostered unprecedented brand loyalty through customized recurring deliveries. As diagnostic biotechnology begins to intersect with everyday hygiene products, operational focus is rapidly moving beyond physical absorbency to encompass holistic, preventive reproductive health tracking, cementing these specialized items as essential, high-margin wellness tools.

What are the Key Data Covered in this Organic Tampons Market Research and Growth Report?

  • What is the expected growth of the Organic Tampons Market between 2026 and 2030?

    • USD 630.06 million, at a CAGR of 7.5%

  • What segmentation does the market report cover?

    • The report is segmented by Type (NAOT, and Applicator organic tampons), Distribution Channel (Offline, and Online), Price (Medium, Low, and High), Product (Non-fragrance-based, and Fragrance-based) and Geography (North America, Europe, APAC, South America, Middle East and Africa)

  • Which regions are analyzed in the report?

    • North America, Europe, APAC, South America and Middle East and Africa

  • What are the key growth drivers and market challenges?

    • Heightened consumer awareness regarding chemical toxicity, High premium costs and inflationary pressures

  • Who are the major players in the Organic Tampons Market?

    • Bodywise Ltd., Corman S.p.A., Eco Vera Care, Edgewell Personal Care Co., Essity AB, Kimberly Clark Corp., Niceday Global Inc., Pee Safe Products Pvt. Ltd., Procter and Gamble Co., Quanzhou Tayue Sanitary Products, Rael Inc., Seventh Generation Inc., Sirona Hygiene Pvt. Ltd., Swell Medical Co. Ltd., The Honest Co. Inc., Tosama d.o.o., Unicharm Corp. and Winner Medical Group Inc.

Market Research Insights

  • The Organic Tampons Market is fundamentally reshaping retail merchandising and personal wellness supply chains. Driven by rigorous ingredient transparency disclosures and menstrual equity initiatives, manufacturers are transitioning away from synthetic inputs toward pure organic materials. This shift has enabled brands leveraging direct to consumer subscription models to improve customer retention rates by 28% while simultaneously reducing inventory overhead by 14%.
  • Furthermore, digital native brand disruption has compelled legacy corporations to redesign their product portfolios, prioritizing circular economy initiatives to remain competitive. By integrating eco certified menstrual products into institutional bulk supply programs, distributors have optimized fulfillment logistics, proving that sustainable hygiene solutions effectively drive both operational efficiency and long-term commercial resilience.

We can help! Our analysts can customize this organic tampons market research report to meet your requirements.

Get in touch

1. Executive Summary

1.1 Market overview

Executive Summary - Chart on Market Overview
Executive Summary - Data Table on Market Overview
Executive Summary - Chart on Global Market Characteristics
Executive Summary - Chart on Market by Geography
Executive Summary - Chart on Market Segmentation by Type
Executive Summary - Chart on Market Segmentation by Distribution Channel
Executive Summary - Chart on Market Segmentation by Price
Executive Summary - Chart on Market Segmentation by Product
Executive Summary - Chart on Incremental Growth
Executive Summary - Data Table on Incremental Growth
Executive Summary - Chart on Company Market Positioning

2. Technavio Analysis

2.1 Analysis of price sensitivity, lifecycle, customer purchase basket, adoption rates, and purchase criteria

2.2 Criticality of inputs and Factors of differentiation

Chart on Overview on criticality of inputs and factors of differentiation

2.3 Factors of disruption

Chart on Overview on factors of disruption

2.4 Impact of drivers and challenges

Chart on Impact of drivers and challenges in 2025 and 2030

3. Market Landscape

3.1 Market ecosystem

Chart on Parent Market
Data Table on - Parent Market

3.2 Market characteristics

Chart on Market characteristics analysis

3.3 Value chain analysis

Chart on Value chain analysis

4. Market Sizing

4.1 Market definition

Data Table on Offerings of companies included in the market definition

4.2 Market segment analysis

Market segments

4.3 Market size 2025

4.4 Market outlook: Forecast for 2025-2030

Chart on Global - Market size and forecast 2025-2030 ($ thousand)
Data Table on Global - Market size and forecast 2025-2030 ($ thousand)
Chart on Global Market: Year-over-year growth 2025-2030 (%)
Data Table on Global Market: Year-over-year growth 2025-2030 (%)

5. Historic Market Size

5.1 Global Organic Tampons Market 2020 - 2024

Historic Market Size - Data Table on Global Organic Tampons Market 2020 - 2024 ($ thousand)

5.2 Type segment analysis 2020 - 2024

Historic Market Size - Type Segment 2020 - 2024 ($ thousand)

5.3 Distribution Channel segment analysis 2020 - 2024

Historic Market Size - Distribution Channel Segment 2020 - 2024 ($ thousand)

5.4 Price segment analysis 2020 - 2024

Historic Market Size - Price Segment 2020 - 2024 ($ thousand)

5.5 Product segment analysis 2020 - 2024

Historic Market Size - Product Segment 2020 - 2024 ($ thousand)

5.6 Geography segment analysis 2020 - 2024

Historic Market Size - Geography Segment 2020 - 2024 ($ thousand)

5.7 Country segment analysis 2020 - 2024

Historic Market Size - Country Segment 2020 - 2024 ($ thousand)

6. Qualitative Analysis

6.1 Impact of AI on Global Organic Tampons Market

6.2 Impact of geopolitical conflicts on Global Organic Tampons Market

7. Five Forces Analysis

7.1 Five forces summary

Five forces analysis - Comparison between 2025 and 2030

7.2 Bargaining power of buyers

Bargaining power of buyers - Impact of key factors 2025 and 2030

7.3 Bargaining power of suppliers

Bargaining power of suppliers - Impact of key factors in 2025 and 2030

7.4 Threat of new entrants

Threat of new entrants - Impact of key factors in 2025 and 2030

7.5 Threat of substitutes

Threat of substitutes - Impact of key factors in 2025 and 2030

7.6 Threat of rivalry

Threat of rivalry - Impact of key factors in 2025 and 2030

7.7 Market condition

Chart on Market condition - Five forces 2025 and 2030

8. Market Segmentation by Type

8.1 Market segments

Chart on Type - Market share 2025-2030 (%)
Data Table on Type - Market share 2025-2030 (%)

8.2 Comparison by Type

Chart on Comparison by Type
Data Table on Comparison by Type

8.3 NAOT - Market size and forecast 2025-2030

Chart on NAOT - Market size and forecast 2025-2030 ($ thousand)
Data Table on NAOT - Market size and forecast 2025-2030 ($ thousand)
Chart on NAOT - Year-over-year growth 2025-2030 (%)
Data Table on NAOT - Year-over-year growth 2025-2030 (%)

8.4 Applicator organic tampons - Market size and forecast 2025-2030

Chart on Applicator organic tampons - Market size and forecast 2025-2030 ($ thousand)
Data Table on Applicator organic tampons - Market size and forecast 2025-2030 ($ thousand)
Chart on Applicator organic tampons - Year-over-year growth 2025-2030 (%)
Data Table on Applicator organic tampons - Year-over-year growth 2025-2030 (%)

8.5 Market opportunity by Type

Market opportunity by Type ($ thousand)
Data Table on Market opportunity by Type ($ thousand)

9. Market Segmentation by Distribution Channel

9.1 Market segments

Chart on Distribution Channel - Market share 2025-2030 (%)
Data Table on Distribution Channel - Market share 2025-2030 (%)

9.2 Comparison by Distribution Channel

Chart on Comparison by Distribution Channel
Data Table on Comparison by Distribution Channel

9.3 Offline - Market size and forecast 2025-2030

Chart on Offline - Market size and forecast 2025-2030 ($ thousand)
Data Table on Offline - Market size and forecast 2025-2030 ($ thousand)
Chart on Offline - Year-over-year growth 2025-2030 (%)
Data Table on Offline - Year-over-year growth 2025-2030 (%)

9.4 Online - Market size and forecast 2025-2030

Chart on Online - Market size and forecast 2025-2030 ($ thousand)
Data Table on Online - Market size and forecast 2025-2030 ($ thousand)
Chart on Online - Year-over-year growth 2025-2030 (%)
Data Table on Online - Year-over-year growth 2025-2030 (%)

9.5 Market opportunity by Distribution Channel

Market opportunity by Distribution Channel ($ thousand)
Data Table on Market opportunity by Distribution Channel ($ thousand)

10. Market Segmentation by Price

10.1 Market segments

Chart on Price - Market share 2025-2030 (%)
Data Table on Price - Market share 2025-2030 (%)

10.2 Comparison by Price

Chart on Comparison by Price
Data Table on Comparison by Price

10.3 Medium - Market size and forecast 2025-2030

Chart on Medium - Market size and forecast 2025-2030 ($ thousand)
Data Table on Medium - Market size and forecast 2025-2030 ($ thousand)
Chart on Medium - Year-over-year growth 2025-2030 (%)
Data Table on Medium - Year-over-year growth 2025-2030 (%)

10.4 Low - Market size and forecast 2025-2030

Chart on Low - Market size and forecast 2025-2030 ($ thousand)
Data Table on Low - Market size and forecast 2025-2030 ($ thousand)
Chart on Low - Year-over-year growth 2025-2030 (%)
Data Table on Low - Year-over-year growth 2025-2030 (%)

10.5 High - Market size and forecast 2025-2030

Chart on High - Market size and forecast 2025-2030 ($ thousand)
Data Table on High - Market size and forecast 2025-2030 ($ thousand)
Chart on High - Year-over-year growth 2025-2030 (%)
Data Table on High - Year-over-year growth 2025-2030 (%)

10.6 Market opportunity by Price

Market opportunity by Price ($ thousand)
Data Table on Market opportunity by Price ($ thousand)

11. Market Segmentation by Product

11.1 Market segments

Chart on Product - Market share 2025-2030 (%)
Data Table on Product - Market share 2025-2030 (%)

11.2 Comparison by Product

Chart on Comparison by Product
Data Table on Comparison by Product

11.3 Non-fragrance-based - Market size and forecast 2025-2030

Chart on Non-fragrance-based - Market size and forecast 2025-2030 ($ thousand)
Data Table on Non-fragrance-based - Market size and forecast 2025-2030 ($ thousand)
Chart on Non-fragrance-based - Year-over-year growth 2025-2030 (%)
Data Table on Non-fragrance-based - Year-over-year growth 2025-2030 (%)

11.4 Fragrance-based - Market size and forecast 2025-2030

Chart on Fragrance-based - Market size and forecast 2025-2030 ($ thousand)
Data Table on Fragrance-based - Market size and forecast 2025-2030 ($ thousand)
Chart on Fragrance-based - Year-over-year growth 2025-2030 (%)
Data Table on Fragrance-based - Year-over-year growth 2025-2030 (%)

11.5 Market opportunity by Product

Market opportunity by Product ($ thousand)
Data Table on Market opportunity by Product ($ thousand)

12. Customer Landscape

12.1 Customer landscape overview

Analysis of price sensitivity, lifecycle, customer purchase basket, adoption rates, and purchase criteria

13. Geographic Landscape

13.1 Geographic segmentation

Chart on Market share by geography 2025-2030 (%)
Data Table on Market share by geography 2025-2030 (%)

13.2 Geographic comparison

Chart on Geographic comparison
Data Table on Geographic comparison

13.3 North America - Market size and forecast 2025-2030

Chart on North America - Market size and forecast 2025-2030 ($ thousand)
Data Table on North America - Market size and forecast 2025-2030 ($ thousand)
Chart on North America - Year-over-year growth 2025-2030 (%)
Data Table on North America - Year-over-year growth 2025-2030 (%)
Chart on Regional Comparison - North America
Data Table on Regional Comparison - North America

13.3.1 US - Market size and forecast 2025-2030

Chart on US - Market size and forecast 2025-2030 ($ thousand)
Data Table on US - Market size and forecast 2025-2030 ($ thousand)
Chart on US - Year-over-year growth 2025-2030 (%)
Data Table on US - Year-over-year growth 2025-2030 (%)

13.3.2 Canada - Market size and forecast 2025-2030

Chart on Canada - Market size and forecast 2025-2030 ($ thousand)
Data Table on Canada - Market size and forecast 2025-2030 ($ thousand)
Chart on Canada - Year-over-year growth 2025-2030 (%)
Data Table on Canada - Year-over-year growth 2025-2030 (%)

13.3.3 Mexico - Market size and forecast 2025-2030

Chart on Mexico - Market size and forecast 2025-2030 ($ thousand)
Data Table on Mexico - Market size and forecast 2025-2030 ($ thousand)
Chart on Mexico - Year-over-year growth 2025-2030 (%)
Data Table on Mexico - Year-over-year growth 2025-2030 (%)

13.4 Europe - Market size and forecast 2025-2030

Chart on Europe - Market size and forecast 2025-2030 ($ thousand)
Data Table on Europe - Market size and forecast 2025-2030 ($ thousand)
Chart on Europe - Year-over-year growth 2025-2030 (%)
Data Table on Europe - Year-over-year growth 2025-2030 (%)
Chart on Regional Comparison - Europe
Data Table on Regional Comparison - Europe

13.4.1 Germany - Market size and forecast 2025-2030

Chart on Germany - Market size and forecast 2025-2030 ($ thousand)
Data Table on Germany - Market size and forecast 2025-2030 ($ thousand)
Chart on Germany - Year-over-year growth 2025-2030 (%)
Data Table on Germany - Year-over-year growth 2025-2030 (%)

13.4.2 UK - Market size and forecast 2025-2030

Chart on UK - Market size and forecast 2025-2030 ($ thousand)
Data Table on UK - Market size and forecast 2025-2030 ($ thousand)
Chart on UK - Year-over-year growth 2025-2030 (%)
Data Table on UK - Year-over-year growth 2025-2030 (%)

13.4.3 France - Market size and forecast 2025-2030

Chart on France - Market size and forecast 2025-2030 ($ thousand)
Data Table on France - Market size and forecast 2025-2030 ($ thousand)
Chart on France - Year-over-year growth 2025-2030 (%)
Data Table on France - Year-over-year growth 2025-2030 (%)

13.4.4 Italy - Market size and forecast 2025-2030

Chart on Italy - Market size and forecast 2025-2030 ($ thousand)
Data Table on Italy - Market size and forecast 2025-2030 ($ thousand)
Chart on Italy - Year-over-year growth 2025-2030 (%)
Data Table on Italy - Year-over-year growth 2025-2030 (%)

13.4.5 Spain - Market size and forecast 2025-2030

Chart on Spain - Market size and forecast 2025-2030 ($ thousand)
Data Table on Spain - Market size and forecast 2025-2030 ($ thousand)
Chart on Spain - Year-over-year growth 2025-2030 (%)
Data Table on Spain - Year-over-year growth 2025-2030 (%)

13.4.6 The Netherlands - Market size and forecast 2025-2030

Chart on The Netherlands - Market size and forecast 2025-2030 ($ thousand)
Data Table on The Netherlands - Market size and forecast 2025-2030 ($ thousand)
Chart on The Netherlands - Year-over-year growth 2025-2030 (%)
Data Table on The Netherlands - Year-over-year growth 2025-2030 (%)

13.5 APAC - Market size and forecast 2025-2030

Chart on APAC - Market size and forecast 2025-2030 ($ thousand)
Data Table on APAC - Market size and forecast 2025-2030 ($ thousand)
Chart on APAC - Year-over-year growth 2025-2030 (%)
Data Table on APAC - Year-over-year growth 2025-2030 (%)
Chart on Regional Comparison - APAC
Data Table on Regional Comparison - APAC

13.5.1 China - Market size and forecast 2025-2030

Chart on China - Market size and forecast 2025-2030 ($ thousand)
Data Table on China - Market size and forecast 2025-2030 ($ thousand)
Chart on China - Year-over-year growth 2025-2030 (%)
Data Table on China - Year-over-year growth 2025-2030 (%)

13.5.2 Japan - Market size and forecast 2025-2030

Chart on Japan - Market size and forecast 2025-2030 ($ thousand)
Data Table on Japan - Market size and forecast 2025-2030 ($ thousand)
Chart on Japan - Year-over-year growth 2025-2030 (%)
Data Table on Japan - Year-over-year growth 2025-2030 (%)

13.5.3 Australia - Market size and forecast 2025-2030

Chart on Australia - Market size and forecast 2025-2030 ($ thousand)
Data Table on Australia - Market size and forecast 2025-2030 ($ thousand)
Chart on Australia - Year-over-year growth 2025-2030 (%)
Data Table on Australia - Year-over-year growth 2025-2030 (%)

13.5.4 South Korea - Market size and forecast 2025-2030

Chart on South Korea - Market size and forecast 2025-2030 ($ thousand)
Data Table on South Korea - Market size and forecast 2025-2030 ($ thousand)
Chart on South Korea - Year-over-year growth 2025-2030 (%)
Data Table on South Korea - Year-over-year growth 2025-2030 (%)

13.5.5 India - Market size and forecast 2025-2030

Chart on India - Market size and forecast 2025-2030 ($ thousand)
Data Table on India - Market size and forecast 2025-2030 ($ thousand)
Chart on India - Year-over-year growth 2025-2030 (%)
Data Table on India - Year-over-year growth 2025-2030 (%)

13.5.6 Indonesia - Market size and forecast 2025-2030

Chart on Indonesia - Market size and forecast 2025-2030 ($ thousand)
Data Table on Indonesia - Market size and forecast 2025-2030 ($ thousand)
Chart on Indonesia - Year-over-year growth 2025-2030 (%)
Data Table on Indonesia - Year-over-year growth 2025-2030 (%)

13.6 South America - Market size and forecast 2025-2030

Chart on South America - Market size and forecast 2025-2030 ($ thousand)
Data Table on South America - Market size and forecast 2025-2030 ($ thousand)
Chart on South America - Year-over-year growth 2025-2030 (%)
Data Table on South America - Year-over-year growth 2025-2030 (%)
Chart on Regional Comparison - South America
Data Table on Regional Comparison - South America

13.6.1 Brazil - Market size and forecast 2025-2030

Chart on Brazil - Market size and forecast 2025-2030 ($ thousand)
Data Table on Brazil - Market size and forecast 2025-2030 ($ thousand)
Chart on Brazil - Year-over-year growth 2025-2030 (%)
Data Table on Brazil - Year-over-year growth 2025-2030 (%)

13.6.2 Argentina - Market size and forecast 2025-2030

Chart on Argentina - Market size and forecast 2025-2030 ($ thousand)
Data Table on Argentina - Market size and forecast 2025-2030 ($ thousand)
Chart on Argentina - Year-over-year growth 2025-2030 (%)
Data Table on Argentina - Year-over-year growth 2025-2030 (%)

13.6.3 Chile - Market size and forecast 2025-2030

Chart on Chile - Market size and forecast 2025-2030 ($ thousand)
Data Table on Chile - Market size and forecast 2025-2030 ($ thousand)
Chart on Chile - Year-over-year growth 2025-2030 (%)
Data Table on Chile - Year-over-year growth 2025-2030 (%)

13.7 Middle East and Africa - Market size and forecast 2025-2030

Chart on Middle East and Africa - Market size and forecast 2025-2030 ($ thousand)
Data Table on Middle East and Africa - Market size and forecast 2025-2030 ($ thousand)
Chart on Middle East and Africa - Year-over-year growth 2025-2030 (%)
Data Table on Middle East and Africa - Year-over-year growth 2025-2030 (%)
Chart on Regional Comparison - Middle East and Africa
Data Table on Regional Comparison - Middle East and Africa

13.7.1 UAE - Market size and forecast 2025-2030

Chart on UAE - Market size and forecast 2025-2030 ($ thousand)
Data Table on UAE - Market size and forecast 2025-2030 ($ thousand)
Chart on UAE - Year-over-year growth 2025-2030 (%)
Data Table on UAE - Year-over-year growth 2025-2030 (%)

13.7.2 South Africa - Market size and forecast 2025-2030

Chart on South Africa - Market size and forecast 2025-2030 ($ thousand)
Data Table on South Africa - Market size and forecast 2025-2030 ($ thousand)
Chart on South Africa - Year-over-year growth 2025-2030 (%)
Data Table on South Africa - Year-over-year growth 2025-2030 (%)

13.7.3 Israel - Market size and forecast 2025-2030

Chart on Israel - Market size and forecast 2025-2030 ($ thousand)
Data Table on Israel - Market size and forecast 2025-2030 ($ thousand)
Chart on Israel - Year-over-year growth 2025-2030 (%)
Data Table on Israel - Year-over-year growth 2025-2030 (%)

13.7.4 Turkey - Market size and forecast 2025-2030

Chart on Turkey - Market size and forecast 2025-2030 ($ thousand)
Data Table on Turkey - Market size and forecast 2025-2030 ($ thousand)
Chart on Turkey - Year-over-year growth 2025-2030 (%)
Data Table on Turkey - Year-over-year growth 2025-2030 (%)

13.7.5 Saudi Arabia - Market size and forecast 2025-2030

Chart on Saudi Arabia - Market size and forecast 2025-2030 ($ thousand)
Data Table on Saudi Arabia - Market size and forecast 2025-2030 ($ thousand)
Chart on Saudi Arabia - Year-over-year growth 2025-2030 (%)
Data Table on Saudi Arabia - Year-over-year growth 2025-2030 (%)

13.8 Market opportunity by geography

Market opportunity by geography ($ thousand)
Data Tables on Market opportunity by geography ($ thousand)

14. Drivers, Challenges, and Opportunity

14.1 Market drivers

Heightened consumer awareness regarding chemical toxicity
Aggressive expansion of direct-to-consumer subscription platforms
Increasing corporate responsibility and environmental sustainability mandates

14.2 Market challenges

High premium costs and inflationary pressures
Supply chain disruption and certification bottlenecks
Low awareness and cultural stigma challenges

14.3 Impact of drivers and challenges

Impact of drivers and challenges in 2025 and 2030

14.4 Market opportunities

Government equity initiatives and tax policy reform alignment
Rise of gender-inclusive design and neutral branding architecture
Integration of smart biosensors and diagnostic material innovations

15. Competitive Landscape

15.1 Overview

15.2

Overview on criticality of inputs and factors of differentiation

15.3 Landscape disruption

Overview on factors of disruption

15.4 Industry risks

Impact of key risks on business

16. Competitive Analysis

16.1 Companies profiled

Companies covered

16.2 Company ranking index

16.3 Market positioning of companies

Matrix on companies position and classification

16.4 Corman S.p.A.

Corman S.p.A. - Overview
Corman S.p.A. - Product / Service
Corman S.p.A. - Key offerings
SWOT

16.5 Eco Vera Care

Eco Vera Care - Overview
Eco Vera Care - Product / Service
Eco Vera Care - Key offerings
SWOT

16.6 Edgewell Personal Care Co.

Edgewell Personal Care Co. - Overview
Edgewell Personal Care Co. - Business segments
Edgewell Personal Care Co. - Key offerings
Edgewell Personal Care Co. - Segment focus
SWOT

16.7 Essity AB

Essity AB - Overview
Essity AB - Business segments
Essity AB - Key news
Essity AB - Key offerings
Essity AB - Segment focus
SWOT

16.8 Kimberly Clark Corp.

Kimberly Clark Corp. - Overview
Kimberly Clark Corp. - Business segments
Kimberly Clark Corp. - Key news
Kimberly Clark Corp. - Key offerings
Kimberly Clark Corp. - Segment focus
SWOT

16.9 Niceday Global Inc.

Niceday Global Inc. - Overview
Niceday Global Inc. - Product / Service
Niceday Global Inc. - Key offerings
SWOT

16.10 Procter and Gamble Co.

Procter and Gamble Co. - Overview
Procter and Gamble Co. - Business segments
Procter and Gamble Co. - Key news
Procter and Gamble Co. - Key offerings
Procter and Gamble Co. - Segment focus
SWOT

16.11 Quanzhou Tayue Sanitary Products

Quanzhou Tayue Sanitary Products - Overview
Quanzhou Tayue Sanitary Products - Product / Service
Quanzhou Tayue Sanitary Products - Key offerings
SWOT

16.12 Rael Inc.

Rael Inc. - Overview
Rael Inc. - Product / Service
Rael Inc. - Key offerings
SWOT

16.13 Seventh Generation Inc.

Seventh Generation Inc. - Overview
Seventh Generation Inc. - Product / Service
Seventh Generation Inc. - Key offerings
SWOT

16.14 Sirona Hygiene Pvt. Ltd.

Sirona Hygiene Pvt. Ltd. - Overview
Sirona Hygiene Pvt. Ltd. - Product / Service
Sirona Hygiene Pvt. Ltd. - Key offerings
SWOT

16.15 Swell Medical Co. Ltd.

Swell Medical Co. Ltd. - Overview
Swell Medical Co. Ltd. - Product / Service
Swell Medical Co. Ltd. - Key offerings
SWOT

16.16 The Honest Co. Inc.

The Honest Co. Inc. - Overview
The Honest Co. Inc. - Business segments
The Honest Co. Inc. - Key offerings
The Honest Co. Inc. - Segment focus
SWOT

16.17 Tosama d.o.o.

Tosama d.o.o. - Overview
Tosama d.o.o. - Product / Service
Tosama d.o.o. - Key offerings
SWOT

16.18 Unicharm Corp.

Unicharm Corp. - Overview
Unicharm Corp. - Business segments
Unicharm Corp. - Key offerings
Unicharm Corp. - Segment focus
SWOT

17. Appendix

17.1 Scope of the report

Market definition
Objectives
Notes and caveats

17.2 Inclusions and exclusions checklist

Inclusions checklist
Exclusions checklist

17.3 Currency conversion rates for US$

17.4 Research methodology

17.5 Data procurement

Information sources

17.6 Data validation

17.7 Validation techniques employed for market sizing

17.8 Data synthesis

17.9 360 degree market analysis

17.10 List of abbreviations

Research Methodology

Technavio presents a detailed picture of the market by way of study, synthesis, and summation of data from multiple sources. The analysts have presented the various facets of the market with a particular focus on identifying the key industry influencers. The data thus presented is comprehensive, reliable, and the result of extensive research, both primary and secondary.

INFORMATION SOURCES

Primary sources

  • Manufacturers and suppliers
  • Channel partners
  • Industry experts
  • Strategic decision makers

Secondary sources

  • Industry journals and periodicals
  • Government data
  • Financial reports of key industry players
  • Historical data
  • Press releases

DATA ANALYSIS

Data Synthesis

  • Collation of data
  • Estimation of key figures
  • Analysis of derived insights

Data Validation

  • Triangulation with data models
  • Reference against proprietary databases
  • Corroboration with industry experts

REPORT WRITING

Qualitative

  • Market drivers
  • Market challenges
  • Market trends
  • Five forces analysis

Quantitative

  • Market size and forecast
  • Market segmentation
  • Geographical insights
  • Competitive landscape

Interested in this report?

Get your sample now to see our research methodology and insights!

Download Now

Frequently Asked Questions

Organic Tampons market growth will increase by USD 630064.9 thousand thousand during 2026-2030.

The Organic Tampons market is expected to grow at a CAGR of 7.5% during 2026-2030.

Organic Tampons market is segmented by Type (NAOT, Applicator organic tampons) Distribution channel (Offline, Online) Price (Medium, Low, High) Product (Non-fragrance-based, Fragrance-based)

Bodywise Ltd., Corman S.p.A., Eco Vera Care, Edgewell Personal Care Co., Essity AB, Kimberly Clark Corp., Niceday Global Inc., Pee Safe Products Pvt. Ltd., Procter and Gamble Co., Quanzhou Tayue Sanitary Products, Rael Inc., Seventh Generation Inc., Sirona Hygiene Pvt. Ltd., Swell Medical Co. Ltd., The Honest Co. Inc., Tosama d.o.o., Unicharm Corp., Winner Medical Group Inc. are a few of the key vendors in the Organic Tampons market.

North America will register the highest growth rate of 33.2% among the other regions. Therefore, the Organic Tampons market in North America is expected to garner significant business opportunities for the vendors during the forecast period.

US, Canada, Mexico, Germany, UK, France, Italy, Spain, The Netherlands, China, Japan, Australia, South Korea, India, Indonesia, Brazil, Argentina, Chile, UAE, South Africa, Israel, Turkey, Saudi Arabia

  • Heightened consumer awareness regarding chemical toxicity is the driving factor this market.

The Organic Tampons market vendors should focus on grabbing business opportunities from the Type segment as it accounted for the largest market share in the base year.
RIA - Research AI Assistant
Ask RIA
