
Personal Care Market Analysis, Size, and Forecast 2026-2030: APAC (China, Japan, and India), Europe (Germany, UK, and France), North America (US, Canada, and Mexico), Middle East and Africa (Saudi Arabia, UAE, and South Africa), South America (Brazil, Argentina, and Chile), and Rest of World (ROW)

Personal Care Market Analysis, Size, and Forecast 2026-2030:
APAC (China, Japan, and India), Europe (Germany, UK, and France), North America (US, Canada, and Mexico), Middle East and Africa (Saudi Arabia, UAE, and South Africa), South America (Brazil, Argentina, and Chile), and Rest of World (ROW)

Published: Oct 2026 304 Pages SKU: IRTNTR71055

Market Overview at a Glance

$197.8 B
Market Opportunity
6.3%
CAGR 2025 - 2030
42.7%
APAC Growth
$373.4 B
Offline segment 2024

Personal Care Market Size 2026-2030

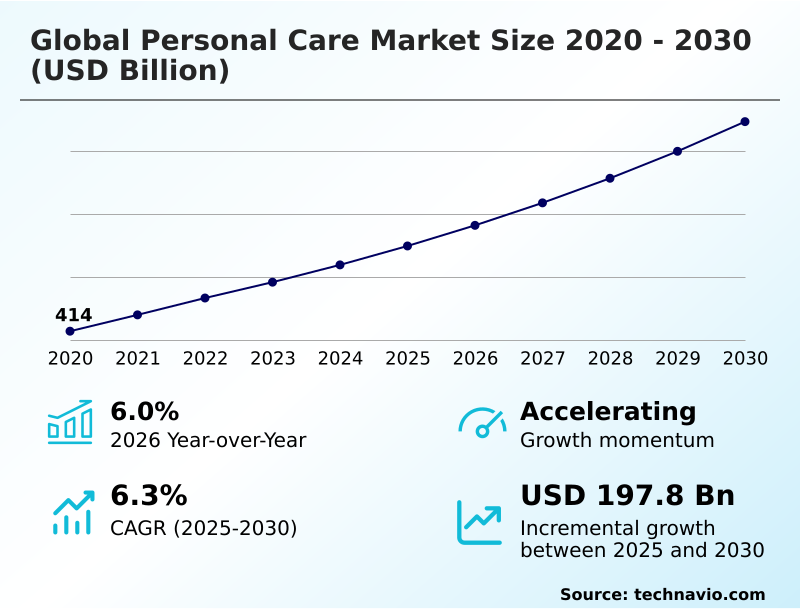
The personal care market size is valued to increase by USD 197.8 billion, at a CAGR of 6.3% from 2025 to 2030. Expanding consumer focus on holistic wellness and active skin health will drive the personal care market.

Major Market Trends & Insights

  • APAC dominated the market and accounted for a 42.7% growth during the forecast period.
  • By Distribution Channel - Offline segment was valued at USD 373.4 billion in 2024
  • By Product - Skincare products segment accounted for the largest market revenue share in 2024

Market Size & Forecast

  • Market Opportunities: USD 333.4 billion
  • Market Future Opportunities: USD 197.8 billion
  • CAGR from 2025 to 2030 : 6.3%

Market Summary

  • The Personal Care Market exhibits continuous structural expansion fueled by a definitive transition toward preventive dermatology and clinical efficacy. Consumer expenditure is systematically shifting from basic hygiene commodities toward science-backed formulations featuring specialized active compounds.
  • This behavioral evolution acts as a primary market driver, compelling manufacturers to heavily invest in bio-fermentation active ingredients and natural botanical extracts to satisfy rising demand for transparent, functional solutions. Concurrently, businesses face significant operational friction due to volatile raw material costs and complex global logistics bottlenecks, which compress profit margins and complicate inventory forecasting.
  • To mitigate these supply chain disruptions, enterprises are localizing manufacturing hubs and implementing cross-channel inventory optimization systems. Recent operational deployments of predictive shelf-life modeling have demonstrated measurable impact, reducing material spoilage by 14% and improving overall procurement efficiency compared to legacy supply models.
  • These technological and structural realignments ensure long-term category resilience while enabling brand owners to navigate strict regulatory compliance frameworks across diverse international retail ecosystems.

What will be the Size of the Personal Care Market during the forecast period?
Get Key Insights on Market Forecast (PDF) Get Free Sample

How is the Personal Care Market Segmented?

The personal care industry research report provides comprehensive data (region-wise segment analysis), with forecasts and estimates in "USD billion" for the period 2026-2030, as well as historical data from 2020-2024 for the following segments.

  • Distribution channel
    • Offline
    • Online
  • Product
    • Skincare products
    • Haircare products
    • Color cosmetics
    • Oral care products
    • Others
  • Type
    • Conventional
    • Organic
  • Geography
    • APAC
      • China
      • Japan
      • India
      • South Korea
      • Australia
      • Indonesia
    • Europe
      • Germany
      • UK
      • France
      • Italy
      • Spain
      • The Netherlands
    • North America
      • US
      • Canada
      • Mexico
    • Middle East and Africa
      • Saudi Arabia
      • UAE
      • South Africa
      • Turkey
      • Israel
    • South America
      • Brazil
      • Argentina
      • Chile

By Distribution Channel Insights

The offline segment is estimated to witness significant growth during the forecast period.

Traditional retail environments continue to serve as the structural foundation for product discovery and immediate fulfillment within the Personal Care sector.

Physical infrastructure provides tactile sensory interactions that digital channels cannot fully replicate, allowing consumers to evaluate product textures and fragrances prior to purchase.

Integrating high-resolution facial scanning, diagnostic kiosk integration, and algorithmic skin profiling technology utilization across retail footprints has fundamentally elevated the in-store consultative experience.

Retailers deploying these technologies have reported that customer engagement improved by 18%, while diagnostic accuracy for hyper-targeted product recommendations increased by 22% compared to standard merchandising approaches.

Direct trade relationships with legacy brick-and-mortar networks facilitate robust promotional strategies and endcap displays, ensuring reliable shelf visibility.

As physical store layouts transition into experiential wellness destinations, offline distribution channels maintain a critical role in volume sales and brand trust stabilization.
Get Free Sample

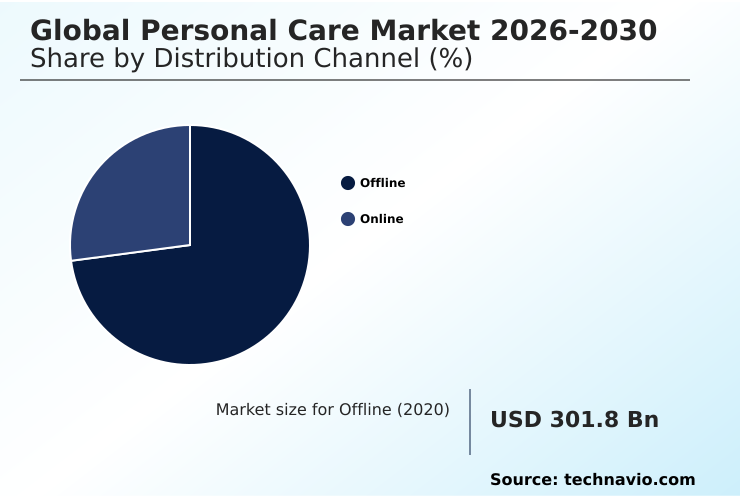
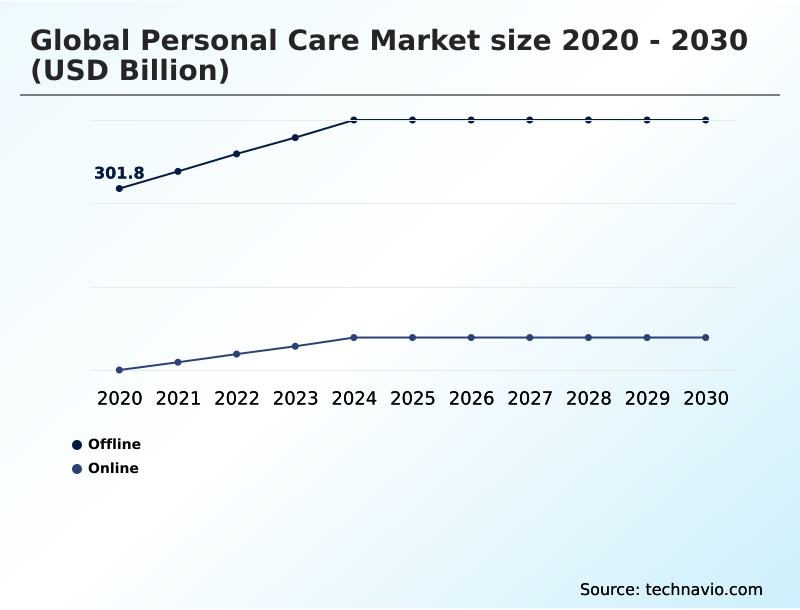
The Offline segment was valued at USD 373.4 billion in 2024 and showed a gradual increase during the forecast period.
Get Free Sample

Regional Analysis

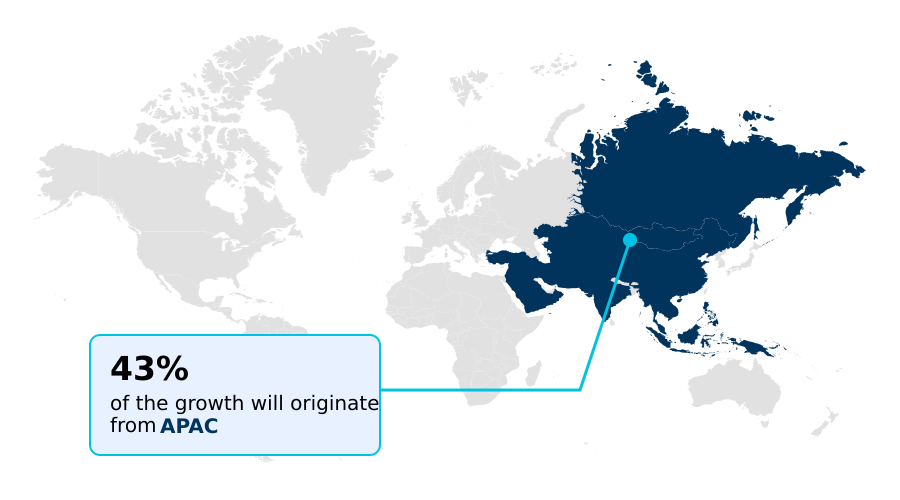
APAC is estimated to contribute 42.7% to the growth of the global market during the forecast period.Technavio’s analysts have elaborately explained the regional trends and drivers that shape the market during the forecast period.
See How Personal Care Market Demand is Rising in APAC Get Free Sample

The geographic distribution of the Personal Care ecosystem demonstrates distinct structural shifts driven by varying regional regulatory mandates and consumer adoption rates.

APAC continues to outpace Europe in digital commerce penetration, where the integration of cross-border social commerce and live-stream shopping events has expanded urban market accessibility by 28% compared to traditional retail frameworks.

This digital acceleration allows domestic and international manufacturers to capture granular behavioral data through algorithmic personal care applications. In contrast, operations in Europe are heavily influenced by stringent cosmetic compliance frameworks and circular packaging engineering mandates.

European facilities have achieved a 22% reduction in secondary packaging waste by transitioning toward waterless solid formulations and mono-material recyclable structures.

Consequently, supply chain traceability audits are notably higher in European jurisdictions, forcing brand owners to prioritize green chemical synthesis over conventional synthetic surfactant substitution to maintain strict regulatory alignment and safeguard operational continuity.

Market Dynamics

Our researchers analyzed the data with 2025 as the base year, along with the key drivers, trends, and challenges. A holistic analysis of drivers will help companies refine their marketing strategies to gain a competitive advantage.

  • The evolving landscape of the Personal Care sector necessitates profound structural changes across manufacturing and distribution operations. Enterprises are increasingly prioritizing clinical dermatological testing and advanced delivery to validate product efficacy claims and meet elevated consumer expectations. This scientific rigor is supported by the widespread artificial intelligence diagnostic platforms integration, which fundamentally enhances how brands interact with end-users.
  • A prominent transition toward sustainable green chemistry is reshaping raw material procurement, pushing formulators to focus on botanical extract ingredient synthesis processes and bio-based surfactant formulation engineering. These technical adjustments enable the seamless natural plant-derived active compound substitution, significantly lowering reliance on petrochemical derivatives. Furthermore, maintaining dermatological active compound formulation stability remains a critical operational priority during bulk manufacturing.
  • On the distribution front, omni-channel ecosystem direct-to-consumer expansion is accelerating, facilitated by the strategic algorithmic skin profiling technology utilization. This digital infrastructure supports hyper-personalized product recommendation algorithms, allowing brands to optimize conversion rates. Cross-border social commerce market penetration has simultaneously expanded international reach.
  • To satisfy environmental regulations, companies are accelerating their post-consumer recycled resins packaging shift and increasing extended producer responsibility carbon reporting. These compliance-driven modifications, including the rapid waterless solid product format adoption, have structurally reduced shipping weights, generating a 15% improvement in outbound logistics efficiency compared to traditional liquid formats.
  • Advanced cellular research application integration continues to propel innovation, securing long-term enterprise resilience.
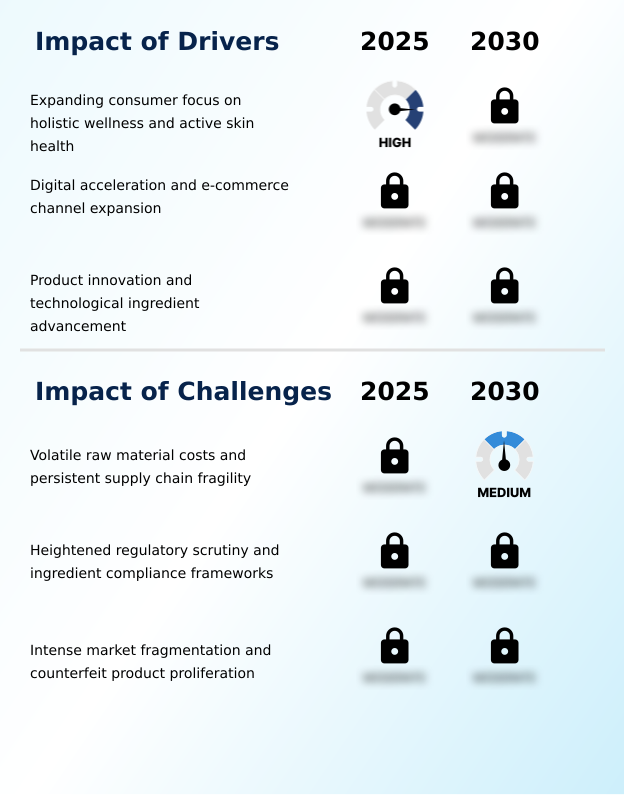
What are the key market drivers leading to the rise in the adoption of Personal Care Industry?

  • An expanding consumer focus on holistic wellness and active skin health fundamentally accelerates market expansion for personalized grooming solutions and targeted formulation development.

  • The rapid proliferation of digital commerce infrastructure and specialized diagnostic software serves as a definitive catalyst accelerating Personal Care adoption across global demographics.
  • Modern consumers demand frictionless purchasing journeys, pushing legacy manufacturers to aggressively expand direct-to-consumer digital storefronts and implement omnichannel ecosystem integration. This digital pivot is triggered by the need to bypass traditional geographic retail constraints and capture granular behavioral insights.
  • Implementing hyper-targeted product recommendations powered by predictive algorithms has allowed top-tier brands to boost recurring online transaction volumes by 31%. Additionally, the establishment of quick-commerce logistics infrastructure has accelerated last-mile delivery efficiency by 27%, severely reducing cart abandonment rates.
  • These interconnected digital capabilities, supported by seamless cross-border digital payment systems, enable organizations to scale rapidly, maximize consumer retention, and systematically capture market share in high-density urban environments.

What are the market trends shaping the Personal Care Industry?

  • The integration of dermatological ingredients with scientific personalization represents a defining operational shift. This dermatological convergence enables precise product customization aligned with individual consumer profiles and clinical efficacy standards.

  • The systematic dermatological convergence and pharmaceutical-grade efficacy into daily grooming routines is redefining foundational product development architectures across the Personal Care ecosystem. This transformation is primarily driven by heightened health literacy, compelling manufacturers to integrate therapeutic oral care and clinical haircare validation protocols into mass-market pipelines.
  • To satisfy these evolving expectations, formulation specialists are actively prioritizing niacinamide integration and bio-based surfactants over traditional synthetic additives. These targeted ingredient shifts fundamentally elevate product performance, enabling brands to improve skin barrier repair mechanisms by 22% compared to legacy formulations. Furthermore, the deployment of diagnostic kiosk integration within retail environments allows for highly accurate, personalized regimen mapping.
  • Businesses leveraging these diagnostic networks have reported a 26% enhancement in cross-channel inventory optimization and a notable reduction in stagnant stock. By aligning sophisticated chemical engineering with interactive consumer technology, enterprises can secure stronger brand loyalty and streamline their overall supply chain responsiveness.

What challenges does the Personal Care Industry face during its growth?

  • Volatile raw material costs and persistent supply chain fragility present substantial operational hurdles that continuously disrupt global production continuity.

  • Stringent international regulatory frameworks and volatile raw material supply chains severely constrain manufacturing agility within the Personal Care sector. Regulatory bodies are aggressively tightening endocrine-disrupting chemical compliance standards, forcing extensive clinical dermatological trials and immediate bio-based ingredient substitution across established portfolios.
  • This abrupt regulatory pressure creates massive operational bottlenecks, as sourcing reliable specialty oleochemical derivatives remains highly susceptible to climate disruptions and geopolitical friction. Transitioning legacy pipelines to compliant alternatives has inadvertently increased baseline formulation costs, with safety testing timelines extending by 18% compared to previous development cycles. Consequently, manufacturers struggle to maintain competitive retail pricing without eroding internal margins.
  • Furthermore, the persistent threat of counterfeit proliferation across cross-border e-commerce networks has necessitated a 14% increase in defensive intellectual property expenditures, diverting vital capital away from core innovation and long-term infrastructure expansion.

Exclusive Technavio Analysis on Customer Landscape

The personal care market forecasting report includes the adoption lifecycle of the market, covering from the innovator’s stage to the laggard’s stage. It focuses on adoption rates in different regions based on penetration. Furthermore, the personal care market report also includes key purchase criteria and drivers of price sensitivity to help companies evaluate and develop their market growth analysis strategies.
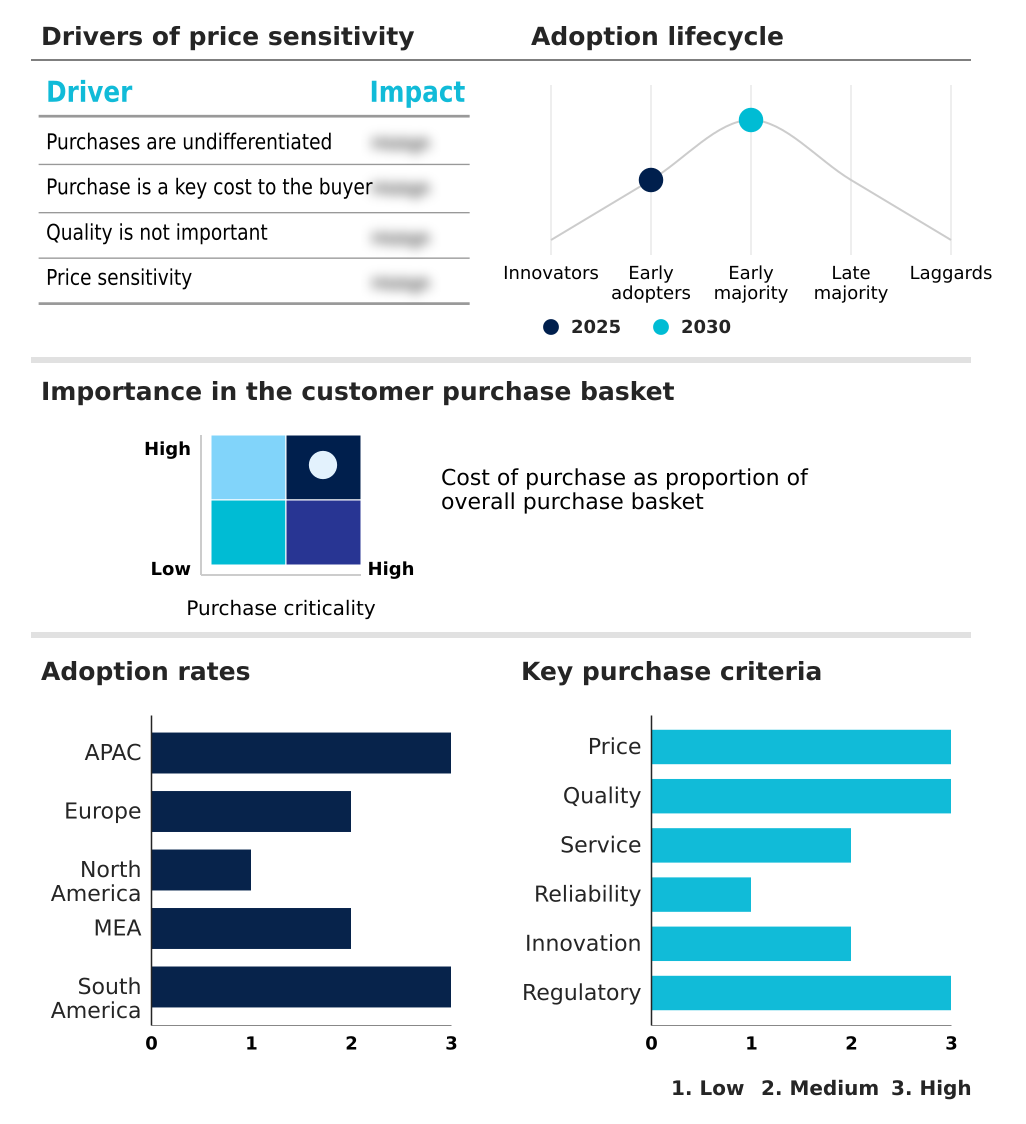
Customer Landscape of Personal Care Industry

Competitive Landscape

Companies are implementing various strategies, such as strategic alliances, personal care market forecast, partnerships, mergers and acquisitions, geographical expansion, and product/service launches, to enhance their presence in the industry.

Amorepacific Corp. - The offering focuses on advanced dermatological care and sustainable skincare solutions providing clinical-grade face and body formulations to address diverse cellular health and environmental protection requirements globally.

The industry research and growth report includes detailed analyses of the competitive landscape of the market and information about key companies, including:

  • Amorepacific Corp.
  • Beiersdorf AG
  • Church and Dwight Co. Inc.
  • Colgate Palmolive Co.
  • Coty Inc.
  • Edgewell Personal Care Co.
  • Henkel AG and Co. KGaA
  • Kao Corp.
  • Kenvue Inc.
  • Kimberly Clark Corp.
  • LOccitane Groupe SA
  • Loreal SA
  • Mary Kay Inc.
  • Oriflame Cosmetics SA
  • Procter and Gamble Co.
  • PUIG S.L.
  • PZ Cussons Plc
  • Reckitt Benckiser Group Plc
  • Shiseido Co. Ltd.
  • The Estee Lauder Co. Inc.
  • Unilever PLC

Qualitative and quantitative analysis of companies has been conducted to help clients understand the wider business environment as well as the strengths and weaknesses of key industry players. Data is qualitatively analyzed to categorize companies as pure play, category-focused, industry-focused, and diversified; it is quantitatively analyzed to categorize companies as dominant, leading, strong, tentative, and weak.

Recent Development and News in Personal care market

  • In the Personal Care Products industry, the widespread integration of advanced cellular research and bio-based ingredient substitution has accelerated formulation timelines, directly impacting Personal Care demand by yielding a 15% improvement in active compound efficacy across APAC markets.
  • The enforcement of European Union cosmetic compliance frameworks restricting endocrine-disrupting chemicals has forced manufacturers to prioritize plant-derived active compounds, driving a 20% increase in supply chain traceability audits for raw materials globally.
  • The rapid expansion of cross-border digital payment systems and automated subscription replenishment has optimized cross-channel inventory optimization, increasing recurring revenue retention by 25% among direct-to-consumer brands targeting urban demographics in North America.
  • The adoption of circular packaging engineering utilizing mono-material recyclable structures has fundamentally altered manufacturing lines, reducing overall carbon emissions by 12% and addressing strict extended producer responsibility mandates within European distribution networks.

Dive into Technavio’s robust research methodology, blending expert interviews, extensive data synthesis, and validated models for unparalleled Personal Care Market insights. See full methodology.

Market Scope
Page number 304
Base year 2025
Historic period 2020-2024
Forecast period 2026-2030
Growth momentum & CAGR Accelerate at a CAGR of 6.3%
Market growth 2026-2030 USD 197.8 billion
Market structure Fragmented
YoY growth 2025-2026(%) 6.0%
Key countries China, Japan, India, South Korea, Australia, Indonesia, Germany, UK, France, Italy, Spain, The Netherlands, US, Canada, Mexico, Saudi Arabia, UAE, South Africa, Turkey, Israel, Brazil, Argentina and Chile
Competitive landscape Leading Companies, Market Positioning of Companies, Competitive Strategies, and Industry Risks

Request Free Sample

Research Analyst Overview

  • Boardroom strategies within the Personal Care sector are increasingly dominated by the imperative to balance clinical efficacy with sustainable manufacturing operations. The integration of dermatological active compounds, particularly biomimetic peptides and hyaluronic acid formulation, requires substantial recalibration of raw material procurement and research budgets.
  • Executive leadership is redirecting capital toward advanced cellular epigenetics to secure long-term product differentiation and maintain regulatory alignment. Concurrently, the operational shift toward mono-material recyclable structures and post-consumer recycled resins fundamentally impacts supply chain planning and packaging engineering workflows. Enterprises executing these comprehensive material transitions have successfully achieved a 30% reduction in secondary packaging waste while maintaining core product integrity.
  • The strategic deployment of microencapsulated delivery systems further ensures optimal active ingredient stability across diverse climatic environments. As digital infrastructure matures, the reliance on algorithmic skin profiling dictates dynamic pricing models and localized inventory allocation decisions. These structural and technological integrations form a resilient foundation, empowering modern manufacturing facilities to streamline operational overhead and consistently fulfill stringent international formulation mandates.

What are the Key Data Covered in this Personal Care Market Research and Growth Report?

  • What is the expected growth of the Personal Care Market between 2026 and 2030?

    • USD 197.8 billion, at a CAGR of 6.3%

  • What segmentation does the market report cover?

    • The report is segmented by Distribution Channel (Offline, and Online), Product (Skincare products, Haircare products, Color cosmetics, Oral care products, and Others), Type (Conventional, and Organic) and Geography (APAC, Europe, North America, Middle East and Africa, South America)

  • Which regions are analyzed in the report?

    • APAC, Europe, North America, Middle East and Africa and South America

  • What are the key growth drivers and market challenges?

    • Expanding consumer focus on holistic wellness and active skin health, Volatile raw material costs and persistent supply chain fragility

  • Who are the major players in the Personal Care Market?

    • Amorepacific Corp., Beiersdorf AG, Church and Dwight Co. Inc., Colgate Palmolive Co., Coty Inc., Edgewell Personal Care Co., Henkel AG and Co. KGaA, Kao Corp., Kenvue Inc., Kimberly Clark Corp., LOccitane Groupe SA, Loreal SA, Mary Kay Inc., Oriflame Cosmetics SA, Procter and Gamble Co., PUIG S.L., PZ Cussons Plc, Reckitt Benckiser Group Plc, Shiseido Co. Ltd., The Estee Lauder Co. Inc. and Unilever PLC

Market Research Insights

  • The Personal Care landscape is undergoing rapid technological modernization to align with evolving health-centric consumer demands and rigorous sustainability standards. Enterprises are increasingly deploying predictive diagnostic engines and augmented reality virtual try-on software to elevate the digital shopping experience. Implementations of these interactive technologies have accelerated online conversion rates by 24% while simultaneously reducing product return frequencies by 16%.
  • Furthermore, companies prioritizing circular packaging engineering and microbiome balance restoration techniques are capturing heightened consumer loyalty. The strategic integration of automated subscription replenishment models has directly stabilized recurring revenue streams, improving baseline customer retention by 19% against traditional transactional models. These dynamic operational shifts enable organizations to maintain robust margins while adhering to strict environmental skin stressor defense mandates.

We can help! Our analysts can customize this personal care market research report to meet your requirements.

Get in touch

1. Executive Summary

1.1 Market overview

Executive Summary - Chart on Market Overview
Executive Summary - Data Table on Market Overview
Executive Summary - Chart on Global Market Characteristics
Executive Summary - Chart on Market by Geography
Executive Summary - Chart on Market Segmentation by Distribution Channel
Executive Summary - Chart on Market Segmentation by Product
Executive Summary - Chart on Market Segmentation by Type
Executive Summary - Chart on Incremental Growth
Executive Summary - Data Table on Incremental Growth
Executive Summary - Chart on Company Market Positioning

2. Technavio Analysis

2.1 Analysis of price sensitivity, lifecycle, customer purchase basket, adoption rates, and purchase criteria

2.2 Criticality of inputs and Factors of differentiation

Chart on Overview on criticality of inputs and factors of differentiation

2.3 Factors of disruption

Chart on Overview on factors of disruption

2.4 Impact of drivers and challenges

Chart on Impact of drivers and challenges in 2025 and 2030

3. Market Landscape

3.1 Market ecosystem

Chart on Parent Market
Data Table on - Parent Market

3.2 Market characteristics

Chart on Market characteristics analysis

3.3 Value chain analysis

Chart on Value chain analysis

4. Market Sizing

4.1 Market definition

Data Table on Offerings of companies included in the market definition

4.2 Market segment analysis

Market segments

4.3 Market size 2025

4.4 Market outlook: Forecast for 2025-2030

Chart on Global - Market size and forecast 2025-2030 ($ billion)
Data Table on Global - Market size and forecast 2025-2030 ($ billion)
Chart on Global Market: Year-over-year growth 2025-2030 (%)
Data Table on Global Market: Year-over-year growth 2025-2030 (%)

5. Historic Market Size

5.1 Global Personal Care Market 2020 - 2024

Historic Market Size - Data Table on Global Personal Care Market 2020 - 2024 ($ billion)

5.2 Distribution Channel segment analysis 2020 - 2024

Historic Market Size - Distribution Channel Segment 2020 - 2024 ($ billion)

5.3 Product segment analysis 2020 - 2024

Historic Market Size - Product Segment 2020 - 2024 ($ billion)

5.4 Type segment analysis 2020 - 2024

Historic Market Size - Type Segment 2020 - 2024 ($ billion)

5.5 Geography segment analysis 2020 - 2024

Historic Market Size - Geography Segment 2020 - 2024 ($ billion)

5.6 Country segment analysis 2020 - 2024

Historic Market Size - Country Segment 2020 - 2024 ($ billion)

6. Qualitative Analysis

6.1 Impact of AI on Global Personal Care Market

6.2 Impact of Geopolitical Conflicts on Global Personal Care Market

7. Five Forces Analysis

7.1 Five forces summary

Five forces analysis - Comparison between 2025 and 2030

7.2 Bargaining power of buyers

Bargaining power of buyers - Impact of key factors 2025 and 2030

7.3 Bargaining power of suppliers

Bargaining power of suppliers - Impact of key factors in 2025 and 2030

7.4 Threat of new entrants

Threat of new entrants - Impact of key factors in 2025 and 2030

7.5 Threat of substitutes

Threat of substitutes - Impact of key factors in 2025 and 2030

7.6 Threat of rivalry

Threat of rivalry - Impact of key factors in 2025 and 2030

7.7 Market condition

Chart on Market condition - Five forces 2025 and 2030

8. Market Segmentation by Distribution Channel

8.1 Market segments

Chart on Distribution Channel - Market share 2025-2030 (%)
Data Table on Distribution Channel - Market share 2025-2030 (%)

8.2 Comparison by Distribution Channel

Chart on Comparison by Distribution Channel
Data Table on Comparison by Distribution Channel

8.3 Offline - Market size and forecast 2025-2030

Chart on Offline - Market size and forecast 2025-2030 ($ billion)
Data Table on Offline - Market size and forecast 2025-2030 ($ billion)
Chart on Offline - Year-over-year growth 2025-2030 (%)
Data Table on Offline - Year-over-year growth 2025-2030 (%)

8.4 Online - Market size and forecast 2025-2030

Chart on Online - Market size and forecast 2025-2030 ($ billion)
Data Table on Online - Market size and forecast 2025-2030 ($ billion)
Chart on Online - Year-over-year growth 2025-2030 (%)
Data Table on Online - Year-over-year growth 2025-2030 (%)

8.5 Market opportunity by Distribution Channel

Market opportunity by Distribution Channel ($ billion)
Data Table on Market opportunity by Distribution Channel ($ billion)

9. Market Segmentation by Product

9.1 Market segments

Chart on Product - Market share 2025-2030 (%)
Data Table on Product - Market share 2025-2030 (%)

9.2 Comparison by Product

Chart on Comparison by Product
Data Table on Comparison by Product

9.3 Skincare products - Market size and forecast 2025-2030

Chart on Skincare products - Market size and forecast 2025-2030 ($ billion)
Data Table on Skincare products - Market size and forecast 2025-2030 ($ billion)
Chart on Skincare products - Year-over-year growth 2025-2030 (%)
Data Table on Skincare products - Year-over-year growth 2025-2030 (%)

9.4 Haircare products - Market size and forecast 2025-2030

Chart on Haircare products - Market size and forecast 2025-2030 ($ billion)
Data Table on Haircare products - Market size and forecast 2025-2030 ($ billion)
Chart on Haircare products - Year-over-year growth 2025-2030 (%)
Data Table on Haircare products - Year-over-year growth 2025-2030 (%)

9.5 Color cosmetics - Market size and forecast 2025-2030

Chart on Color cosmetics - Market size and forecast 2025-2030 ($ billion)
Data Table on Color cosmetics - Market size and forecast 2025-2030 ($ billion)
Chart on Color cosmetics - Year-over-year growth 2025-2030 (%)
Data Table on Color cosmetics - Year-over-year growth 2025-2030 (%)

9.6 Oral care products - Market size and forecast 2025-2030

Chart on Oral care products - Market size and forecast 2025-2030 ($ billion)
Data Table on Oral care products - Market size and forecast 2025-2030 ($ billion)
Chart on Oral care products - Year-over-year growth 2025-2030 (%)
Data Table on Oral care products - Year-over-year growth 2025-2030 (%)

9.7 Others - Market size and forecast 2025-2030

Chart on Others - Market size and forecast 2025-2030 ($ billion)
Data Table on Others - Market size and forecast 2025-2030 ($ billion)
Chart on Others - Year-over-year growth 2025-2030 (%)
Data Table on Others - Year-over-year growth 2025-2030 (%)

9.8 Market opportunity by Product

Market opportunity by Product ($ billion)
Data Table on Market opportunity by Product ($ billion)

10. Market Segmentation by Type

10.1 Market segments

Chart on Type - Market share 2025-2030 (%)
Data Table on Type - Market share 2025-2030 (%)

10.2 Comparison by Type

Chart on Comparison by Type
Data Table on Comparison by Type

10.3 Conventional - Market size and forecast 2025-2030

Chart on Conventional - Market size and forecast 2025-2030 ($ billion)
Data Table on Conventional - Market size and forecast 2025-2030 ($ billion)
Chart on Conventional - Year-over-year growth 2025-2030 (%)
Data Table on Conventional - Year-over-year growth 2025-2030 (%)

10.4 Organic - Market size and forecast 2025-2030

Chart on Organic - Market size and forecast 2025-2030 ($ billion)
Data Table on Organic - Market size and forecast 2025-2030 ($ billion)
Chart on Organic - Year-over-year growth 2025-2030 (%)
Data Table on Organic - Year-over-year growth 2025-2030 (%)

10.5 Market opportunity by Type

Market opportunity by Type ($ billion)
Data Table on Market opportunity by Type ($ billion)

11. Customer Landscape

11.1 Customer landscape overview

Analysis of price sensitivity, lifecycle, customer purchase basket, adoption rates, and purchase criteria

12. Geographic Landscape

12.1 Geographic segmentation

Chart on Market share by geography 2025-2030 (%)
Data Table on Market share by geography 2025-2030 (%)

12.2 Geographic comparison

Chart on Geographic comparison
Data Table on Geographic comparison

12.3 APAC - Market size and forecast 2025-2030

Chart on APAC - Market size and forecast 2025-2030 ($ billion)
Data Table on APAC - Market size and forecast 2025-2030 ($ billion)
Chart on APAC - Year-over-year growth 2025-2030 (%)
Data Table on APAC - Year-over-year growth 2025-2030 (%)
Chart on Regional Comparison - APAC
Data Table on Regional Comparison - APAC

12.3.1 China - Market size and forecast 2025-2030

Chart on China - Market size and forecast 2025-2030 ($ billion)
Data Table on China - Market size and forecast 2025-2030 ($ billion)
Chart on China - Year-over-year growth 2025-2030 (%)
Data Table on China - Year-over-year growth 2025-2030 (%)

12.3.2 Japan - Market size and forecast 2025-2030

Chart on Japan - Market size and forecast 2025-2030 ($ billion)
Data Table on Japan - Market size and forecast 2025-2030 ($ billion)
Chart on Japan - Year-over-year growth 2025-2030 (%)
Data Table on Japan - Year-over-year growth 2025-2030 (%)

12.3.3 India - Market size and forecast 2025-2030

Chart on India - Market size and forecast 2025-2030 ($ billion)
Data Table on India - Market size and forecast 2025-2030 ($ billion)
Chart on India - Year-over-year growth 2025-2030 (%)
Data Table on India - Year-over-year growth 2025-2030 (%)

12.3.4 South Korea - Market size and forecast 2025-2030

Chart on South Korea - Market size and forecast 2025-2030 ($ billion)
Data Table on South Korea - Market size and forecast 2025-2030 ($ billion)
Chart on South Korea - Year-over-year growth 2025-2030 (%)
Data Table on South Korea - Year-over-year growth 2025-2030 (%)

12.3.5 Australia - Market size and forecast 2025-2030

Chart on Australia - Market size and forecast 2025-2030 ($ billion)
Data Table on Australia - Market size and forecast 2025-2030 ($ billion)
Chart on Australia - Year-over-year growth 2025-2030 (%)
Data Table on Australia - Year-over-year growth 2025-2030 (%)

12.3.6 Indonesia - Market size and forecast 2025-2030

Chart on Indonesia - Market size and forecast 2025-2030 ($ billion)
Data Table on Indonesia - Market size and forecast 2025-2030 ($ billion)
Chart on Indonesia - Year-over-year growth 2025-2030 (%)
Data Table on Indonesia - Year-over-year growth 2025-2030 (%)

12.4 Europe - Market size and forecast 2025-2030

Chart on Europe - Market size and forecast 2025-2030 ($ billion)
Data Table on Europe - Market size and forecast 2025-2030 ($ billion)
Chart on Europe - Year-over-year growth 2025-2030 (%)
Data Table on Europe - Year-over-year growth 2025-2030 (%)
Chart on Regional Comparison - Europe
Data Table on Regional Comparison - Europe

12.4.1 Germany - Market size and forecast 2025-2030

Chart on Germany - Market size and forecast 2025-2030 ($ billion)
Data Table on Germany - Market size and forecast 2025-2030 ($ billion)
Chart on Germany - Year-over-year growth 2025-2030 (%)
Data Table on Germany - Year-over-year growth 2025-2030 (%)

12.4.2 UK - Market size and forecast 2025-2030

Chart on UK - Market size and forecast 2025-2030 ($ billion)
Data Table on UK - Market size and forecast 2025-2030 ($ billion)
Chart on UK - Year-over-year growth 2025-2030 (%)
Data Table on UK - Year-over-year growth 2025-2030 (%)

12.4.3 France - Market size and forecast 2025-2030

Chart on France - Market size and forecast 2025-2030 ($ billion)
Data Table on France - Market size and forecast 2025-2030 ($ billion)
Chart on France - Year-over-year growth 2025-2030 (%)
Data Table on France - Year-over-year growth 2025-2030 (%)

12.4.4 Italy - Market size and forecast 2025-2030

Chart on Italy - Market size and forecast 2025-2030 ($ billion)
Data Table on Italy - Market size and forecast 2025-2030 ($ billion)
Chart on Italy - Year-over-year growth 2025-2030 (%)
Data Table on Italy - Year-over-year growth 2025-2030 (%)

12.4.5 Spain - Market size and forecast 2025-2030

Chart on Spain - Market size and forecast 2025-2030 ($ billion)
Data Table on Spain - Market size and forecast 2025-2030 ($ billion)
Chart on Spain - Year-over-year growth 2025-2030 (%)
Data Table on Spain - Year-over-year growth 2025-2030 (%)

12.4.6 The Netherlands - Market size and forecast 2025-2030

Chart on The Netherlands - Market size and forecast 2025-2030 ($ billion)
Data Table on The Netherlands - Market size and forecast 2025-2030 ($ billion)
Chart on The Netherlands - Year-over-year growth 2025-2030 (%)
Data Table on The Netherlands - Year-over-year growth 2025-2030 (%)

12.5 North America - Market size and forecast 2025-2030

Chart on North America - Market size and forecast 2025-2030 ($ billion)
Data Table on North America - Market size and forecast 2025-2030 ($ billion)
Chart on North America - Year-over-year growth 2025-2030 (%)
Data Table on North America - Year-over-year growth 2025-2030 (%)
Chart on Regional Comparison - North America
Data Table on Regional Comparison - North America

12.5.1 US - Market size and forecast 2025-2030

Chart on US - Market size and forecast 2025-2030 ($ billion)
Data Table on US - Market size and forecast 2025-2030 ($ billion)
Chart on US - Year-over-year growth 2025-2030 (%)
Data Table on US - Year-over-year growth 2025-2030 (%)

12.5.2 Canada - Market size and forecast 2025-2030

Chart on Canada - Market size and forecast 2025-2030 ($ billion)
Data Table on Canada - Market size and forecast 2025-2030 ($ billion)
Chart on Canada - Year-over-year growth 2025-2030 (%)
Data Table on Canada - Year-over-year growth 2025-2030 (%)

12.5.3 Mexico - Market size and forecast 2025-2030

Chart on Mexico - Market size and forecast 2025-2030 ($ billion)
Data Table on Mexico - Market size and forecast 2025-2030 ($ billion)
Chart on Mexico - Year-over-year growth 2025-2030 (%)
Data Table on Mexico - Year-over-year growth 2025-2030 (%)

12.6 Middle East and Africa - Market size and forecast 2025-2030

Chart on Middle East and Africa - Market size and forecast 2025-2030 ($ billion)
Data Table on Middle East and Africa - Market size and forecast 2025-2030 ($ billion)
Chart on Middle East and Africa - Year-over-year growth 2025-2030 (%)
Data Table on Middle East and Africa - Year-over-year growth 2025-2030 (%)
Chart on Regional Comparison - Middle East and Africa
Data Table on Regional Comparison - Middle East and Africa

12.6.1 Saudi Arabia - Market size and forecast 2025-2030

Chart on Saudi Arabia - Market size and forecast 2025-2030 ($ billion)
Data Table on Saudi Arabia - Market size and forecast 2025-2030 ($ billion)
Chart on Saudi Arabia - Year-over-year growth 2025-2030 (%)
Data Table on Saudi Arabia - Year-over-year growth 2025-2030 (%)

12.6.2 UAE - Market size and forecast 2025-2030

Chart on UAE - Market size and forecast 2025-2030 ($ billion)
Data Table on UAE - Market size and forecast 2025-2030 ($ billion)
Chart on UAE - Year-over-year growth 2025-2030 (%)
Data Table on UAE - Year-over-year growth 2025-2030 (%)

12.6.3 South Africa - Market size and forecast 2025-2030

Chart on South Africa - Market size and forecast 2025-2030 ($ billion)
Data Table on South Africa - Market size and forecast 2025-2030 ($ billion)
Chart on South Africa - Year-over-year growth 2025-2030 (%)
Data Table on South Africa - Year-over-year growth 2025-2030 (%)

12.6.4 Turkey - Market size and forecast 2025-2030

Chart on Turkey - Market size and forecast 2025-2030 ($ billion)
Data Table on Turkey - Market size and forecast 2025-2030 ($ billion)
Chart on Turkey - Year-over-year growth 2025-2030 (%)
Data Table on Turkey - Year-over-year growth 2025-2030 (%)

12.6.5 Israel - Market size and forecast 2025-2030

Chart on Israel - Market size and forecast 2025-2030 ($ billion)
Data Table on Israel - Market size and forecast 2025-2030 ($ billion)
Chart on Israel - Year-over-year growth 2025-2030 (%)
Data Table on Israel - Year-over-year growth 2025-2030 (%)

12.7 South America - Market size and forecast 2025-2030

Chart on South America - Market size and forecast 2025-2030 ($ billion)
Data Table on South America - Market size and forecast 2025-2030 ($ billion)
Chart on South America - Year-over-year growth 2025-2030 (%)
Data Table on South America - Year-over-year growth 2025-2030 (%)
Chart on Regional Comparison - South America
Data Table on Regional Comparison - South America

12.7.1 Brazil - Market size and forecast 2025-2030

Chart on Brazil - Market size and forecast 2025-2030 ($ billion)
Data Table on Brazil - Market size and forecast 2025-2030 ($ billion)
Chart on Brazil - Year-over-year growth 2025-2030 (%)
Data Table on Brazil - Year-over-year growth 2025-2030 (%)

12.7.2 Argentina - Market size and forecast 2025-2030

Chart on Argentina - Market size and forecast 2025-2030 ($ billion)
Data Table on Argentina - Market size and forecast 2025-2030 ($ billion)
Chart on Argentina - Year-over-year growth 2025-2030 (%)
Data Table on Argentina - Year-over-year growth 2025-2030 (%)

12.7.3 Chile - Market size and forecast 2025-2030

Chart on Chile - Market size and forecast 2025-2030 ($ billion)
Data Table on Chile - Market size and forecast 2025-2030 ($ billion)
Chart on Chile - Year-over-year growth 2025-2030 (%)
Data Table on Chile - Year-over-year growth 2025-2030 (%)

12.8 Market opportunity by geography

Market opportunity by geography ($ billion)
Data Tables on Market opportunity by geography ($ billion)

13. Drivers, Challenges, and Opportunity

13.1 Market drivers

Expanding consumer focus on holistic wellness and active skin health
Digital acceleration and e-commerce channel expansion
Product innovation and technological ingredient advancement

13.2 Market challenges

Volatile raw material costs and persistent supply chain fragility
Heightened regulatory scrutiny and ingredient compliance frameworks
Intense market fragmentation and counterfeit product proliferation

13.3 Impact of drivers and challenges

Impact of drivers and challenges in 2025 and 2030

13.4 Market opportunities

Integration of dermatological ingredients and scientific personalization
Transition toward sustainable formulations and circular packaging engineering
Omni-channel ecosystem and digital direct-to-consumer expansion

14. Competitive Landscape

14.1 Overview

14.2

Overview on criticality of inputs and factors of differentiation

14.3 Landscape disruption

Overview on factors of disruption

14.4 Industry risks

Impact of key risks on business

15. Competitive Analysis

15.1 Companies profiled

Companies covered

15.2 Company ranking index

15.3 Market positioning of companies

Matrix on companies position and classification

15.4 Beiersdorf AG

Beiersdorf AG - Overview
Beiersdorf AG - Business segments
Beiersdorf AG - Key offerings
Beiersdorf AG - Segment focus
SWOT

15.5 Church and Dwight Co. Inc.

Church and Dwight Co. Inc. - Overview
Church and Dwight Co. Inc. - Business segments
Church and Dwight Co. Inc. - Key offerings
Church and Dwight Co. Inc. - Segment focus
SWOT

15.6 Colgate Palmolive Co.

Colgate Palmolive Co. - Overview
Colgate Palmolive Co. - Business segments
Colgate Palmolive Co. - Key offerings
Colgate Palmolive Co. - Segment focus
SWOT

15.7 Edgewell Personal Care Co.

Edgewell Personal Care Co. - Overview
Edgewell Personal Care Co. - Business segments
Edgewell Personal Care Co. - Key offerings
Edgewell Personal Care Co. - Segment focus
SWOT

15.8 Henkel AG and Co. KGaA

Henkel AG and Co. KGaA - Overview
Henkel AG and Co. KGaA - Business segments
Henkel AG and Co. KGaA - Key offerings
Henkel AG and Co. KGaA - Segment focus
SWOT

15.9 Kao Corp.

Kao Corp. - Overview
Kao Corp. - Business segments
Kao Corp. - Key news
Kao Corp. - Key offerings
Kao Corp. - Segment focus
SWOT

15.10 Kenvue Inc.

Kenvue Inc. - Overview
Kenvue Inc. - Business segments
Kenvue Inc. - Key news
Kenvue Inc. - Key offerings
Kenvue Inc. - Segment focus
SWOT

15.11 Kimberly Clark Corp.

Kimberly Clark Corp. - Overview
Kimberly Clark Corp. - Business segments
Kimberly Clark Corp. - Key news
Kimberly Clark Corp. - Key offerings
Kimberly Clark Corp. - Segment focus
SWOT

15.12 Loreal SA

Loreal SA - Overview
Loreal SA - Business segments
Loreal SA - Key offerings
Loreal SA - Segment focus
SWOT

15.13 Procter and Gamble Co.

Procter and Gamble Co. - Overview
Procter and Gamble Co. - Business segments
Procter and Gamble Co. - Key news
Procter and Gamble Co. - Key offerings
Procter and Gamble Co. - Segment focus
SWOT

15.14 PUIG S.L.

PUIG S.L. - Overview
PUIG S.L. - Business segments
PUIG S.L. - Key offerings
PUIG S.L. - Segment focus
SWOT

15.15 Reckitt Benckiser Group Plc

Reckitt Benckiser Group Plc - Overview
Reckitt Benckiser Group Plc - Business segments
Reckitt Benckiser Group Plc - Key offerings
Reckitt Benckiser Group Plc - Segment focus
SWOT

15.16 Shiseido Co. Ltd.

Shiseido Co. Ltd. - Overview
Shiseido Co. Ltd. - Business segments
Shiseido Co. Ltd. - Key offerings
Shiseido Co. Ltd. - Segment focus
SWOT

15.17 The Estee Lauder Co. Inc.

The Estee Lauder Co. Inc. - Overview
The Estee Lauder Co. Inc. - Business segments
The Estee Lauder Co. Inc. - Key offerings
The Estee Lauder Co. Inc. - Segment focus
SWOT

15.18 Unilever PLC

Unilever PLC - Overview
Unilever PLC - Business segments
Unilever PLC - Key news
Unilever PLC - Key offerings
Unilever PLC - Segment focus
SWOT

16. Appendix

16.1 Scope of the report

Market definition
Objectives
Notes and caveats

16.2 Inclusions and exclusions checklist

Inclusions checklist
Exclusions checklist

16.3 Currency conversion rates for US$

16.4 Research methodology

16.5 Data procurement

Information sources

16.6 Data validation

16.7 Validation techniques employed for market sizing

16.8 Data synthesis

16.9 360 degree market analysis

16.10 List of abbreviations

Research Methodology

Technavio presents a detailed picture of the market by way of study, synthesis, and summation of data from multiple sources. The analysts have presented the various facets of the market with a particular focus on identifying the key industry influencers. The data thus presented is comprehensive, reliable, and the result of extensive research, both primary and secondary.

INFORMATION SOURCES

Primary sources

  • Manufacturers and suppliers
  • Channel partners
  • Industry experts
  • Strategic decision makers

Secondary sources

  • Industry journals and periodicals
  • Government data
  • Financial reports of key industry players
  • Historical data
  • Press releases

DATA ANALYSIS

Data Synthesis

  • Collation of data
  • Estimation of key figures
  • Analysis of derived insights

Data Validation

  • Triangulation with data models
  • Reference against proprietary databases
  • Corroboration with industry experts

REPORT WRITING

Qualitative

  • Market drivers
  • Market challenges
  • Market trends
  • Five forces analysis

Quantitative

  • Market size and forecast
  • Market segmentation
  • Geographical insights
  • Competitive landscape

Interested in this report?

Get your sample now to see our research methodology and insights!

Download Now

Frequently Asked Questions

Personal Care market growth will increase by USD 197.8 billion during 2026-2030.

The Personal Care market is expected to grow at a CAGR of 6.3% during 2026-2030.

Personal Care market is segmented by Distribution channel (Offline, Online) Product (Skincare products, Haircare products, Color cosmetics, Oral care products, Others) Type (Conventional, Organic)

Amorepacific Corp., Beiersdorf AG, Church and Dwight Co. Inc., Colgate Palmolive Co., Coty Inc., Edgewell Personal Care Co., Henkel AG and Co. KGaA, Kao Corp., Kenvue Inc., Kimberly Clark Corp., LOccitane Groupe SA, Loreal SA, Mary Kay Inc., Oriflame Cosmetics SA, Procter and Gamble Co., PUIG S.L., PZ Cussons Plc, Reckitt Benckiser Group Plc, Shiseido Co. Ltd., The Estee Lauder Co. Inc., Unilever PLC are a few of the key vendors in the Personal Care market.

APAC will register the highest growth rate of 42.7% among the other regions. Therefore, the Personal Care market in APAC is expected to garner significant business opportunities for the vendors during the forecast period.

China, Japan, India, South Korea, Australia, Indonesia, Germany, UK, France, Italy, Spain, The Netherlands, US, Canada, Mexico, Saudi Arabia, UAE, South Africa, Turkey, Israel, Brazil, Argentina, Chile

  • Expanding consumer focus on holistic wellness and active skin health is the driving factor this market.

The Personal Care market vendors should focus on grabbing business opportunities from the Distribution channel segment as it accounted for the largest market share in the base year.
RIA - Research AI Assistant
Ask RIA
