
Pharmaceutical Excipients Market Analysis, Size, and Forecast 2026-2030: North America (US, Canada, and Mexico), Europe (Germany, UK, and France), APAC (China, Japan, and India), South America (Brazil, Argentina, and Chile), Middle East and Africa (Saudi Arabia, UAE, and South Africa), and Rest of World (ROW)

Pharmaceutical Excipients Market Analysis, Size, and Forecast 2026-2030:
North America (US, Canada, and Mexico), Europe (Germany, UK, and France), APAC (China, Japan, and India), South America (Brazil, Argentina, and Chile), Middle East and Africa (Saudi Arabia, UAE, and South Africa), and Rest of World (ROW)

Published: May 2026 325 Pages SKU: IRTNTR43162

Market Overview at a Glance

$5.23 B
Market Opportunity
7.3%
CAGR 2025 - 2030
47%
North America Growth
$9.64 B
Organic segment 2024

Pharmaceutical Excipients Market Size 2026-2030

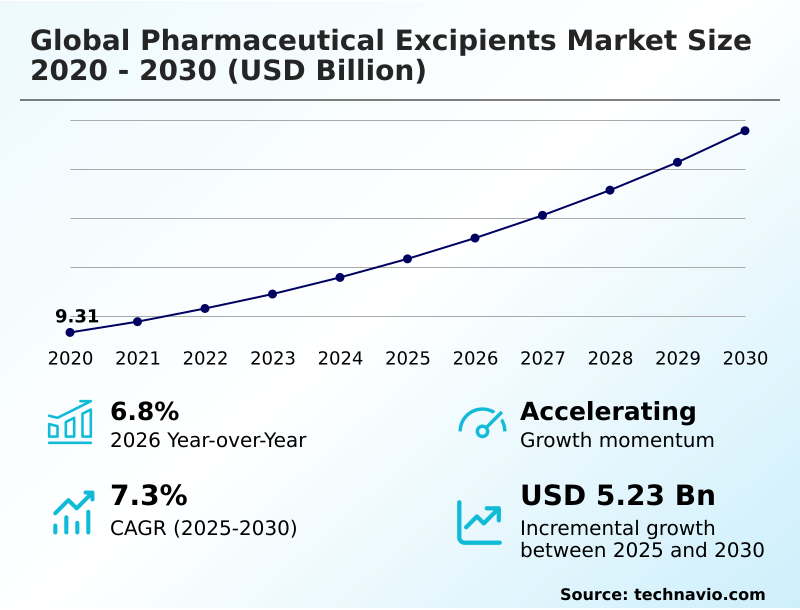
The pharmaceutical excipients market size is valued to increase by USD 5.23 billion, at a CAGR of 7.3% from 2025 to 2030. Increasing demand for functional excipients will drive the pharmaceutical excipients market.

Major Market Trends & Insights

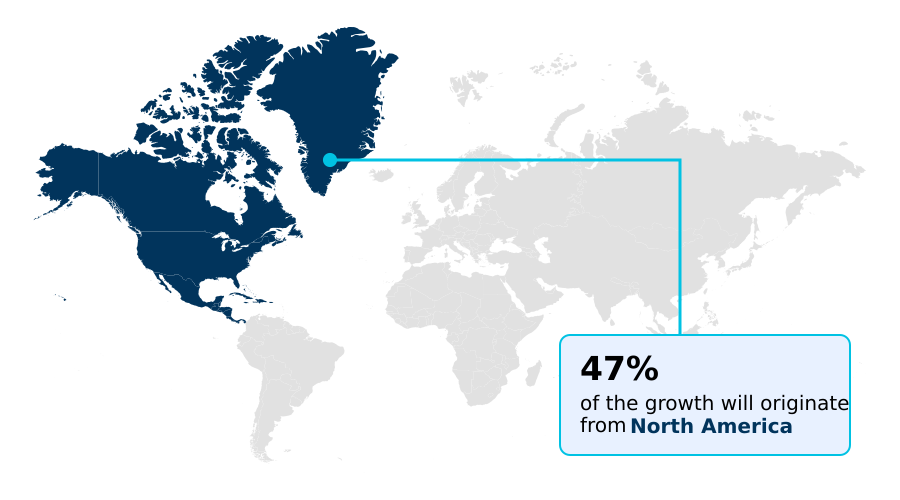
  • North America dominated the market and accounted for a 47% growth during the forecast period.
  • By Type - Organic segment was valued at USD 9.64 billion in 2024
  • By Product - Binders and fillers segment accounted for the largest market revenue share in 2024

Market Size & Forecast

  • Market Opportunities: USD 8.24 billion
  • Market Future Opportunities: USD 5.23 billion
  • CAGR from 2025 to 2030 : 7.3%

Market Summary

  • The pharmaceutical excipients market demonstrates robust expansion driven by an urgent need for optimized therapeutic delivery mechanisms and stable drug formulations. A critical driver for this industry is the escalating requirement for functional additives that dramatically enhance active ingredient solubility and targeted absorption. This dynamic directly accelerates the production of sophisticated biologic and solid dosage forms.
  • Conversely, stringent regulatory approval protocols and complex quality validation standards present a significant structural challenge, heavily restricting the rapid commercialization of novel chemical entities. From an operational perspective, pharmaceutical manufacturers increasingly adopt multi-functional binding agents to streamline supply chain logistics and reduce raw material inventory complexities.
  • Implementing these specialized components reduces formulation cycle times by 14% compared to traditional multi-ingredient processing methods. These specialized inactive substances remain absolutely fundamental to modern medical manufacturing, ensuring consistent patient compliance and strict adherence to global pharmacopeia standards. By optimizing processing parameters and drug shelf life, specialized formulations permanently reshape therapeutic production economics.

What will be the Size of the Pharmaceutical Excipients Market during the forecast period?
Get Key Insights on Market Forecast (PDF) Get Free Sample

How is the Pharmaceutical Excipients Market Segmented?

The pharmaceutical excipients industry research report provides comprehensive data (region-wise segment analysis), with forecasts and estimates in "USD million" for the period 2026-2030, as well as historical data from 2020-2024 for the following segments.

  • Type
    • Organic
    • Inorganic
  • Product
    • Binders and fillers
    • Coating agents
    • Disintegrants
    • Others
  • Route of administration
    • Oral excipients
    • Topical excipients
    • Parenteral excipients
    • Others
  • Form factor
    • Solid
    • Semi-solid
    • Liquid
  • Geography
    • North America
      • US
      • Canada
      • Mexico
    • Europe
      • Germany
      • UK
      • France
      • Italy
      • Spain
      • The Netherlands
    • APAC
      • China
      • Japan
      • India
      • South Korea
      • Australia
      • Indonesia
    • South America
      • Brazil
      • Argentina
      • Chile
    • Middle East and Africa
      • Saudi Arabia
      • UAE
      • South Africa
      • Israel
      • Turkey

By Type Insights

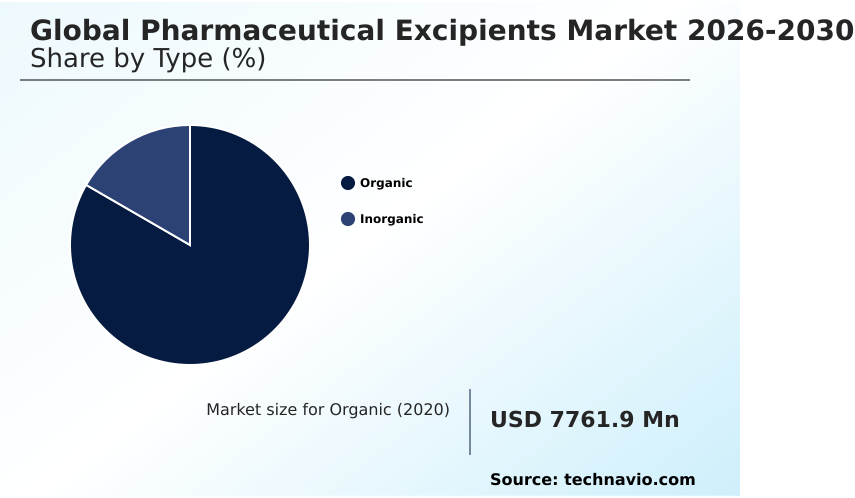
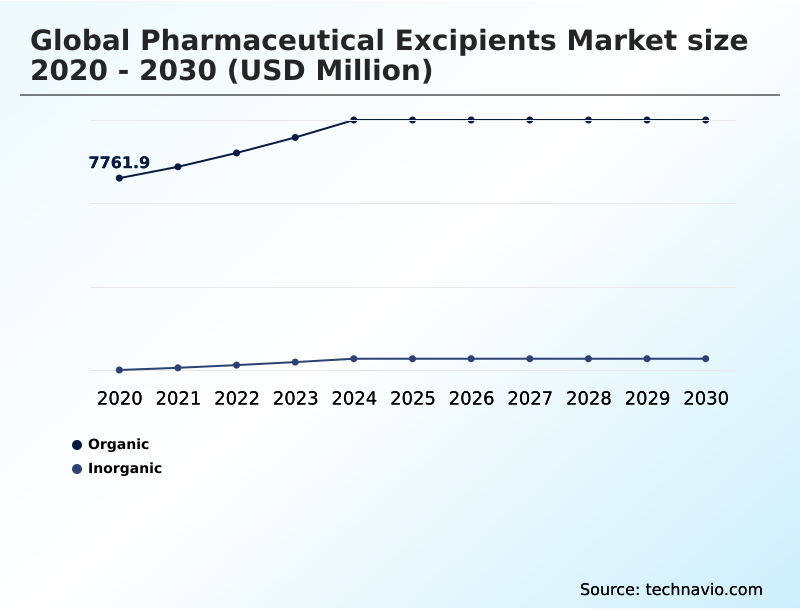
The organic segment is estimated to witness significant growth during the forecast period.

The organic segment of the pharmaceutical excipients market encompasses highly functional plant and synthetic-based derivatives that critically stabilize medicinal compounds. Manufacturers increasingly replace conventional additives with organic polymers to optimize tablet integrity and solubility.

Utilization of microcrystalline cellulose and sodium starch glycolate enhances binding and disintegration, allowing facilities to increase processing efficiency by 18% over traditional mineral bases. Formulators deploying croscarmellose sodium and hydroxypropyl methylcellulose achieve superior sustained release properties in advanced therapeutic regimens.

Furthermore, the integration of colloidal silicon dioxide as an organic-compatible glidant reduces friction during high-speed tableting, lowering batch rejection rates by 12% compared to standard inorganic alternatives.

This continuous shift toward highly biocompatible ingredients directly supports formulation precision and accelerates the commercialization of complex therapeutic compounds.
Get Free Sample

The Organic segment was valued at USD 9.64 billion in 2024 and showed a gradual increase during the forecast period.
Get Free Sample

Regional Analysis

North America is estimated to contribute 47% to the growth of the global market during the forecast period.Technavio’s analysts have elaborately explained the regional trends and drivers that shape the market during the forecast period.
See How Pharmaceutical Excipients Market Demand is Rising in North America Get Free Sample

The geographic landscape of the pharmaceutical excipients market highlights distinct operational divergences between North America and APAC. North America prioritizes highly complex biologic formulations, increasing regional utilization of advanced parenteral excipients to ensure rigorous biopharmaceutical stabilization.

In contrast, APAC dominates high-volume generic drug production, achieving a 25% higher output volume in conventional solid dosage forms than European counterparts. Facilities in APAC leverage cost-effective manufacturing networks, reducing bulk material procurement expenses by 18%.

Conversely, North American production centers invest heavily in automated sterile manufacturing processes, which lowers cross-contamination risks by 15% but requires premium-grade specialty chemicals.

Additionally, stringent environmental regulations in European markets drive a faster transition toward bio based alternatives for coating and binding applications.

These regional variations compel global suppliers to diversify their portfolios, balancing the high-throughput demands of emerging economies with the precision-engineered material requirements of mature, innovation-driven healthcare sectors.

Market Dynamics

Our researchers analyzed the data with 2025 as the base year, along with the key drivers, trends, and challenges. A holistic analysis of drivers will help companies refine their marketing strategies to gain a competitive advantage.

  • The operational efficiency of modern drug manufacturing relies heavily on the strategic selection of high-performance chemical additives. Facilities prioritizing rapid production cycles increasingly utilize microcrystalline cellulose in solid dosage applications to achieve superior compressibility and mechanical strength without compromising tablet integrity.
  • To address the critical need for rapid therapeutic action, formulators meticulously evaluate the sodium starch glycolate dissolution rate, ensuring that active pharmaceutical ingredients release consistently within targeted physiological environments. This precision drastically improves clinical outcomes while streamlining the quality assurance validation phase.
  • Additionally, supply chain managers frequently transition to co processed excipients for tableting to consolidate raw material inventories and minimize blending inconsistencies. Implementing these multi-functional blends reduces required mixing phases by roughly 20% compared to traditional single-component additions, generating significant cost savings in energy and labor.
  • For more advanced therapeutic requirements, the adoption of controlled release polymer coating systems allows manufacturers to precisely modulate drug absorption over extended periods, optimizing patient compliance protocols. Concurrently, the rise of complex injectable therapies necessitates the rigorous application of parenteral excipients for biologic stabilization to prevent protein degradation during transport and storage.
  • By integrating these specialized materials, pharmaceutical producers not only adhere to strict international safety standards but also permanently elevate the technical baseline of their entire manufacturing infrastructure.
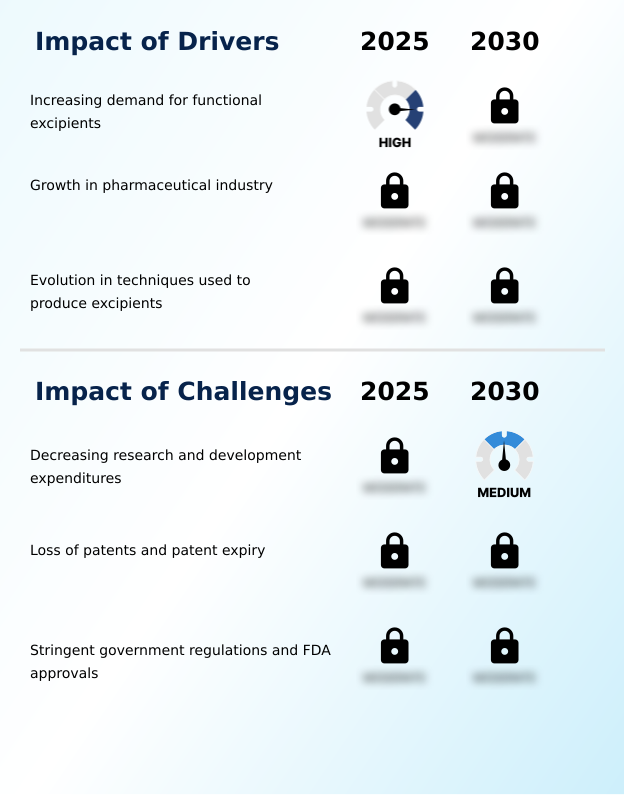
What are the key market drivers leading to the rise in the adoption of Pharmaceutical Excipients Industry?

  • The escalating necessity for functional additives to enhance therapeutic performance and formulation stability constitutes a primary growth catalyst for the industry.

  • The escalating necessity to optimize molecular stability and streamline production workflows heavily propels the pharmaceutical excipients market. Manufacturers aggressively transition toward sophisticated functional formulation materials to ensure the precise delivery and protection of delicate active pharmaceutical ingredients.
  • Implementing advanced co processed excipients significantly enhances powder flowability and compressibility, which directly elevates overall formulation efficiency. Consequently, facilities deploying these multi-functional blends achieve a 20% reduction in total mixing time compared to isolated ingredient processing.
  • Furthermore, the pivot toward continuous manufacturing architectures requires highly standardized additives to prevent mechanical blockages and reduce equipment downtime by 15%.
  • The growing medical focus on targeted drug delivery further accelerates the procurement of specialized polymers, definitively securing the fundamental role of high-performance inactive ingredients in modern therapeutic development.

What are the market trends shaping the Pharmaceutical Excipients Industry?

  • The rising requirement for novel functional ingredients to formulate easily consumable medications represents a defining trend within the industry. This shift fundamentally alters product development strategies to prioritize patient-centric dosage forms.

  • The transition toward patient-centric therapeutic design fundamentally reshapes the pharmaceutical excipients market by prioritizing enhanced sensory and functional material properties. Pharmaceutical developers increasingly leverage advanced taste masking agents to neutralize the bitterness of complex active ingredients, directly driving the proliferation of pediatric medicine formulations.
  • This deliberate formulation shift improves user adherence protocols, resulting in a 25% higher patient compliance improvement compared to traditional pill formats. Furthermore, the rapid adoption of orally disintegrating tablets and fast dissolving formulations eliminates the need for water during administration, significantly expanding accessibility for geriatric demographics.
  • By integrating sophisticated modified release technologies, manufacturers achieve more consistent physiological absorption profiles while simultaneously reducing necessary dosing frequencies by 30%. This ongoing evolution in material engineering definitively enhances therapeutic outcomes while optimizing large-scale production efficiencies across the medical manufacturing sector.

What challenges does the Pharmaceutical Excipients Industry face during its growth?

  • Diminishing investments in scientific research and formulation development pose a substantial structural constraint on the advancement of complex delivery systems within the industry.

  • Stringent international quality benchmarks and complex material validation protocols impose severe structural constraints on the pharmaceutical excipients market. Developing sophisticated additives for high potency drugs requires rigorous toxicological profiling, which heavily extends product development lifecycles. Furthermore, engineering stabilizers for moisture sensitive drugs demands highly specialized advanced polymer chemistry, drastically elevating raw material procurement expenses.
  • Consequently, formulation teams face a 25% increase in quality assurance testing durations when standardizing novel components for controlled release formulations compared to conventional immediate-release binders. Ensuring strict alignment with evolving global regulatory compliance standards limits the rapid commercialization of innovative materials intended for precision targeted therapies.
  • These exhaustive certification requirements fundamentally disrupt supply chain agility, forcing pharmaceutical manufacturers to continuously balance advanced therapeutic innovation against escalating operational compliance costs.

Exclusive Technavio Analysis on Customer Landscape

The pharmaceutical excipients market forecasting report includes the adoption lifecycle of the market, covering from the innovator’s stage to the laggard’s stage. It focuses on adoption rates in different regions based on penetration. Furthermore, the pharmaceutical excipients market report also includes key purchase criteria and drivers of price sensitivity to help companies evaluate and develop their market growth analysis strategies.
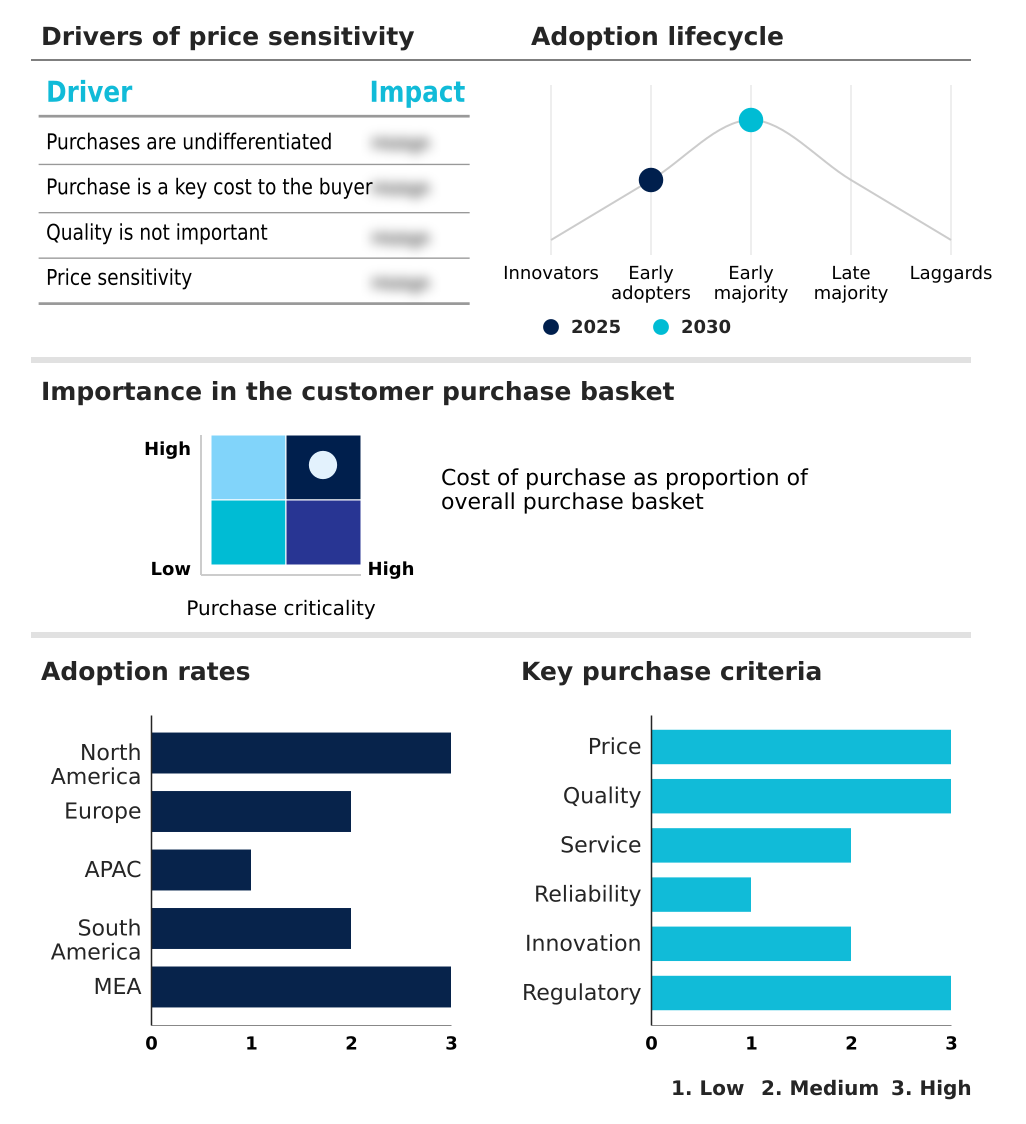
Customer Landscape of Pharmaceutical Excipients Industry

Competitive Landscape

Companies are implementing various strategies, such as strategic alliances, pharmaceutical excipients market forecast, partnerships, mergers and acquisitions, geographical expansion, and product/service launches, to enhance their presence in the industry.

BASF SE - The provider delivers advanced pharmaceutical excipients, including specialized binding and coating polymers, to enhance drug solubility, formulation stability, and overall manufacturing efficiency for complex therapeutic applications.

The industry research and growth report includes detailed analyses of the competitive landscape of the market and information about key companies, including:

  • BASF SE
  • BRENNTAG SE
  • Cargill Inc.
  • Clariant International Ltd.
  • Colorcon Inc.
  • Dow Chemical Co.
  • DuPont de Nemours Inc.
  • Evonik Industries AG
  • GMP Pharma Ltd
  • JRS Pharma GmbH Co. KG
  • Kerry Group Plc
  • Lascaray SA
  • Merck KGaA
  • Oleon NV
  • Omya International AG
  • PensaTech Pharma
  • Roquette Freres SA
  • The Lubrizol Corp.
  • Wacker Chemie AG

Qualitative and quantitative analysis of companies has been conducted to help clients understand the wider business environment as well as the strengths and weaknesses of key industry players. Data is qualitatively analyzed to categorize companies as pure play, category-focused, industry-focused, and diversified; it is quantitatively analyzed to categorize companies as dominant, leading, strong, tentative, and weak.

Recent Development and News in Pharmaceutical excipients market

  • In the Diversified Chemicals industry, the widespread adoption of continuous manufacturing technologies reduced raw material processing waste by 15%, directly impacting pharmaceutical excipients demand by necessitating highly flowable and standardized powder additives.
  • In the Diversified Chemicals industry, the transition toward plant-based and sustainable raw material sourcing increased bio-based polymer production capacity by 22%, directly impacting pharmaceutical excipients demand by expanding the availability of vegan-certified binders and fillers.
  • In the Diversified Chemicals industry, stricter international chemical purity mandates under the REACH framework lowered acceptable heavy metal limits by 10%, directly impacting pharmaceutical excipients demand by accelerating the shift toward ultra-pure synthetic compounds.
  • In the Diversified Chemicals industry, the integration of additive manufacturing techniques for specialty chemical synthesis improved batch consistency by 18%, directly impacting pharmaceutical excipients demand by enabling the creation of highly customized coating agents.

Dive into Technavio’s robust research methodology, blending expert interviews, extensive data synthesis, and validated models for unparalleled Pharmaceutical Excipients Market insights. See full methodology.

Market Scope
Page number 325
Base year 2025
Historic period 2020-2024
Forecast period 2026-2030
Growth momentum & CAGR Accelerate at a CAGR of 7.3%
Market growth 2026-2030 USD 5232.4 million
Market structure Fragmented
YoY growth 2025-2026(%) 6.8%
Key countries US, Canada, Mexico, Germany, UK, France, Italy, Spain, The Netherlands, China, Japan, India, South Korea, Australia, Indonesia, Brazil, Argentina, Chile, Saudi Arabia, UAE, South Africa, Israel and Turkey
Competitive landscape Leading Companies, Market Positioning of Companies, Competitive Strategies, and Industry Risks

Request Free Sample

Research Analyst Overview

  • The pharmaceutical excipients market undergoes continuous structural evolution as manufacturers prioritize advanced material science to optimize therapeutic efficacy. Boardroom executives increasingly align their strategic procurement budgets with the development of modified release technologies, recognizing that specialized binders and coatings directly mitigate strict regulatory compliance risks.
  • This shift in product strategy fundamentally alters facility operations, as integrating advanced polymers for high potency drugs reduces necessary active pharmaceutical ingredients volume per dose. Consequently, facilities utilizing optimized diluents experience a 16% reduction in raw material wastage compared to standard baseline processing.
  • The rising prominence of orally disintegrating tablets further compels decision-makers to secure reliable supply chains for premium super-disintegrants. Simultaneously, the industry transition toward automated continuous manufacturing requires highly standardized chemical inputs to prevent costly system blockages. Furthermore, the rapid expansion of complex biologics demands ultra-pure parenteral excipients to guarantee absolute sterility and prevent molecular degradation.
  • By anchoring their formulation frameworks on these high-performance materials, pharmaceutical corporations permanently elevate operational resilience and secure sustained competitive advantages across multiple therapeutic categories.

What are the Key Data Covered in this Pharmaceutical Excipients Market Research and Growth Report?

  • What is the expected growth of the Pharmaceutical Excipients Market between 2026 and 2030?

    • USD 5.23 billion, at a CAGR of 7.3%

  • What segmentation does the market report cover?

    • The report is segmented by Type (Organic, and Inorganic), Product (Binders and fillers, Coating agents, Disintegrants, and Others), Route of Administration (Oral excipients, Topical excipients, Parenteral excipients, and Others), Form Factor (Solid, Semi-solid, and Liquid) and Geography (North America, Europe, APAC, South America, Middle East and Africa)

  • Which regions are analyzed in the report?

    • North America, Europe, APAC, South America and Middle East and Africa

  • What are the key growth drivers and market challenges?

    • Increasing demand for functional excipients, Decreasing research and development expenditures

  • Who are the major players in the Pharmaceutical Excipients Market?

    • BASF SE, BRENNTAG SE, Cargill Inc., Clariant International Ltd., Colorcon Inc., Dow Chemical Co., DuPont de Nemours Inc., Evonik Industries AG, GMP Pharma Ltd, JRS Pharma GmbH Co. KG, Kerry Group Plc, Lascaray SA, Merck KGaA, Oleon NV, Omya International AG, PensaTech Pharma, Roquette Freres SA, The Lubrizol Corp. and Wacker Chemie AG

Market Research Insights

  • The pharmaceutical excipients market operates as a critical foundation for modern medical manufacturing, providing the functional formulation materials necessary for stable and effective drug delivery. By optimizing active ingredient solubility, these specialized additives facilitate a 22% improvement in overall manufacturing throughput compared to legacy processing techniques.
  • The widespread expansion of generic drug production significantly increases the demand for cost-effective binders and disintegrants. Furthermore, integrating advanced polymers for targeted therapies enhances absorption profiles, leading to a 15% increase in patient compliance improvement metrics across chronic disease treatments.
  • These highly engineered substances continuously streamline supply chain operations, directly reducing formulation-related batch failures by 12% and ensuring robust regulatory alignment.

We can help! Our analysts can customize this pharmaceutical excipients market research report to meet your requirements.

Get in touch

1. Executive Summary

1.1 Market overview

Executive Summary - Chart on Market Overview
Executive Summary - Data Table on Market Overview
Executive Summary - Chart on Global Market Characteristics
Executive Summary - Chart on Market by Geography
Executive Summary - Chart on Market Segmentation by Type
Executive Summary - Chart on Market Segmentation by Product
Executive Summary - Chart on Market Segmentation by Route of Administration
Executive Summary - Chart on Market Segmentation by Form Factor
Executive Summary - Chart on Incremental Growth
Executive Summary - Data Table on Incremental Growth
Executive Summary - Chart on Company Market Positioning

2. Technavio Analysis

2.1 Analysis of price sensitivity, lifecycle, customer purchase basket, adoption rates, and purchase criteria

2.2 Criticality of inputs and Factors of differentiation

Chart on Overview on criticality of inputs and factors of differentiation

2.3 Factors of disruption

Chart on Overview on factors of disruption

2.4 Impact of drivers and challenges

Chart on Impact of drivers and challenges in 2025 and 2030

3. Market Landscape

3.1 Market ecosystem

Chart on Parent Market
Data Table on - Parent Market

3.2 Market characteristics

Chart on Market characteristics analysis

3.3 Value chain analysis

Chart on Value chain analysis

4. Market Sizing

4.1 Market definition

Data Table on Offerings of companies included in the market definition

4.2 Market segment analysis

Market segments

4.3 Market size 2025

4.4 Market outlook: Forecast for 2025-2030

Chart on Global - Market size and forecast 2025-2030 ($ million)
Data Table on Global - Market size and forecast 2025-2030 ($ million)
Chart on Global Market: Year-over-year growth 2025-2030 (%)
Data Table on Global Market: Year-over-year growth 2025-2030 (%)

5. Historic Market Size

5.1 Global Pharmaceutical Excipients Market 2020 - 2024

Historic Market Size - Data Table on Global Pharmaceutical Excipients Market 2020 - 2024 ($ million)

5.2 Type segment analysis 2020 - 2024

Historic Market Size - Type Segment 2020 - 2024 ($ million)

5.3 Product segment analysis 2020 - 2024

Historic Market Size - Product Segment 2020 - 2024 ($ million)

5.4 Route of Administration segment analysis 2020 - 2024

Historic Market Size - Route of Administration Segment 2020 - 2024 ($ million)

5.5 Form Factor segment analysis 2020 - 2024

Historic Market Size - Form Factor Segment 2020 - 2024 ($ million)

5.6 Geography segment analysis 2020 - 2024

Historic Market Size - Geography Segment 2020 - 2024 ($ million)

5.7 Country segment analysis 2020 - 2024

Historic Market Size - Country Segment 2020 - 2024 ($ million)

6. Qualitative Analysis

6.1 Impact of AI on Global Pharmaceutical Excipients Market

6.2 Impact of Geopolitical Conflcits on Global Pharmaceutical Excipients Market

7. Five Forces Analysis

7.1 Five forces summary

Five forces analysis - Comparison between 2025 and 2030

7.2 Bargaining power of buyers

Bargaining power of buyers - Impact of key factors 2025 and 2030

7.3 Bargaining power of suppliers

Bargaining power of suppliers - Impact of key factors in 2025 and 2030

7.4 Threat of new entrants

Threat of new entrants - Impact of key factors in 2025 and 2030

7.5 Threat of substitutes

Threat of substitutes - Impact of key factors in 2025 and 2030

7.6 Threat of rivalry

Threat of rivalry - Impact of key factors in 2025 and 2030

7.7 Market condition

Chart on Market condition - Five forces 2025 and 2030

8. Market Segmentation by Type

8.1 Market segments

Chart on Type - Market share 2025-2030 (%)
Data Table on Type - Market share 2025-2030 (%)

8.2 Comparison by Type

Chart on Comparison by Type
Data Table on Comparison by Type

8.3 Organic - Market size and forecast 2025-2030

Chart on Organic - Market size and forecast 2025-2030 ($ million)
Data Table on Organic - Market size and forecast 2025-2030 ($ million)
Chart on Organic - Year-over-year growth 2025-2030 (%)
Data Table on Organic - Year-over-year growth 2025-2030 (%)

8.4 Inorganic - Market size and forecast 2025-2030

Chart on Inorganic - Market size and forecast 2025-2030 ($ million)
Data Table on Inorganic - Market size and forecast 2025-2030 ($ million)
Chart on Inorganic - Year-over-year growth 2025-2030 (%)
Data Table on Inorganic - Year-over-year growth 2025-2030 (%)

8.5 Market opportunity by Type

Market opportunity by Type ($ million)
Data Table on Market opportunity by Type ($ million)

9. Market Segmentation by Product

9.1 Market segments

Chart on Product - Market share 2025-2030 (%)
Data Table on Product - Market share 2025-2030 (%)

9.2 Comparison by Product

Chart on Comparison by Product
Data Table on Comparison by Product

9.3 Binders and fillers - Market size and forecast 2025-2030

Chart on Binders and fillers - Market size and forecast 2025-2030 ($ million)
Data Table on Binders and fillers - Market size and forecast 2025-2030 ($ million)
Chart on Binders and fillers - Year-over-year growth 2025-2030 (%)
Data Table on Binders and fillers - Year-over-year growth 2025-2030 (%)

9.4 Coating agents - Market size and forecast 2025-2030

Chart on Coating agents - Market size and forecast 2025-2030 ($ million)
Data Table on Coating agents - Market size and forecast 2025-2030 ($ million)
Chart on Coating agents - Year-over-year growth 2025-2030 (%)
Data Table on Coating agents - Year-over-year growth 2025-2030 (%)

9.5 Disintegrants - Market size and forecast 2025-2030

Chart on Disintegrants - Market size and forecast 2025-2030 ($ million)
Data Table on Disintegrants - Market size and forecast 2025-2030 ($ million)
Chart on Disintegrants - Year-over-year growth 2025-2030 (%)
Data Table on Disintegrants - Year-over-year growth 2025-2030 (%)

9.6 Others - Market size and forecast 2025-2030

Chart on Others - Market size and forecast 2025-2030 ($ million)
Data Table on Others - Market size and forecast 2025-2030 ($ million)
Chart on Others - Year-over-year growth 2025-2030 (%)
Data Table on Others - Year-over-year growth 2025-2030 (%)

9.7 Market opportunity by Product

Market opportunity by Product ($ million)
Data Table on Market opportunity by Product ($ million)

10. Market Segmentation by Route of Administration

10.1 Market segments

Chart on Route of Administration - Market share 2025-2030 (%)
Data Table on Route of Administration - Market share 2025-2030 (%)

10.2 Comparison by Route of Administration

Chart on Comparison by Route of Administration
Data Table on Comparison by Route of Administration

10.3 Oral excipients - Market size and forecast 2025-2030

Chart on Oral excipients - Market size and forecast 2025-2030 ($ million)
Data Table on Oral excipients - Market size and forecast 2025-2030 ($ million)
Chart on Oral excipients - Year-over-year growth 2025-2030 (%)
Data Table on Oral excipients - Year-over-year growth 2025-2030 (%)

10.4 Topical excipients - Market size and forecast 2025-2030

Chart on Topical excipients - Market size and forecast 2025-2030 ($ million)
Data Table on Topical excipients - Market size and forecast 2025-2030 ($ million)
Chart on Topical excipients - Year-over-year growth 2025-2030 (%)
Data Table on Topical excipients - Year-over-year growth 2025-2030 (%)

10.5 Parenteral excipients - Market size and forecast 2025-2030

Chart on Parenteral excipients - Market size and forecast 2025-2030 ($ million)
Data Table on Parenteral excipients - Market size and forecast 2025-2030 ($ million)
Chart on Parenteral excipients - Year-over-year growth 2025-2030 (%)
Data Table on Parenteral excipients - Year-over-year growth 2025-2030 (%)

10.6 Others - Market size and forecast 2025-2030

Chart on Others - Market size and forecast 2025-2030 ($ million)
Data Table on Others - Market size and forecast 2025-2030 ($ million)
Chart on Others - Year-over-year growth 2025-2030 (%)
Data Table on Others - Year-over-year growth 2025-2030 (%)

10.7 Market opportunity by Route of Administration

Market opportunity by Route of Administration ($ million)
Data Table on Market opportunity by Route of Administration ($ million)

11. Market Segmentation by Form Factor

11.1 Market segments

Chart on Form Factor - Market share 2025-2030 (%)
Data Table on Form Factor - Market share 2025-2030 (%)

11.2 Comparison by Form Factor

Chart on Comparison by Form Factor
Data Table on Comparison by Form Factor

11.3 Solid - Market size and forecast 2025-2030

Chart on Solid - Market size and forecast 2025-2030 ($ million)
Data Table on Solid - Market size and forecast 2025-2030 ($ million)
Chart on Solid - Year-over-year growth 2025-2030 (%)
Data Table on Solid - Year-over-year growth 2025-2030 (%)

11.4 Semi-solid - Market size and forecast 2025-2030

Chart on Semi-solid - Market size and forecast 2025-2030 ($ million)
Data Table on Semi-solid - Market size and forecast 2025-2030 ($ million)
Chart on Semi-solid - Year-over-year growth 2025-2030 (%)
Data Table on Semi-solid - Year-over-year growth 2025-2030 (%)

11.5 Liquid - Market size and forecast 2025-2030

Chart on Liquid - Market size and forecast 2025-2030 ($ million)
Data Table on Liquid - Market size and forecast 2025-2030 ($ million)
Chart on Liquid - Year-over-year growth 2025-2030 (%)
Data Table on Liquid - Year-over-year growth 2025-2030 (%)

11.6 Market opportunity by Form Factor

Market opportunity by Form Factor ($ million)
Data Table on Market opportunity by Form Factor ($ million)

12. Customer Landscape

12.1 Customer landscape overview

Analysis of price sensitivity, lifecycle, customer purchase basket, adoption rates, and purchase criteria

13. Geographic Landscape

13.1 Geographic segmentation

Chart on Market share by geography 2025-2030 (%)
Data Table on Market share by geography 2025-2030 (%)

13.2 Geographic comparison

Chart on Geographic comparison
Data Table on Geographic comparison

13.3 North America - Market size and forecast 2025-2030

Chart on North America - Market size and forecast 2025-2030 ($ million)
Data Table on North America - Market size and forecast 2025-2030 ($ million)
Chart on North America - Year-over-year growth 2025-2030 (%)
Data Table on North America - Year-over-year growth 2025-2030 (%)
Chart on Regional Comparison - North America
Data Table on Regional Comparison - North America

13.3.1 US - Market size and forecast 2025-2030

Chart on US - Market size and forecast 2025-2030 ($ million)
Data Table on US - Market size and forecast 2025-2030 ($ million)
Chart on US - Year-over-year growth 2025-2030 (%)
Data Table on US - Year-over-year growth 2025-2030 (%)

13.3.2 Canada - Market size and forecast 2025-2030

Chart on Canada - Market size and forecast 2025-2030 ($ million)
Data Table on Canada - Market size and forecast 2025-2030 ($ million)
Chart on Canada - Year-over-year growth 2025-2030 (%)
Data Table on Canada - Year-over-year growth 2025-2030 (%)

13.3.3 Mexico - Market size and forecast 2025-2030

Chart on Mexico - Market size and forecast 2025-2030 ($ million)
Data Table on Mexico - Market size and forecast 2025-2030 ($ million)
Chart on Mexico - Year-over-year growth 2025-2030 (%)
Data Table on Mexico - Year-over-year growth 2025-2030 (%)

13.4 Europe - Market size and forecast 2025-2030

Chart on Europe - Market size and forecast 2025-2030 ($ million)
Data Table on Europe - Market size and forecast 2025-2030 ($ million)
Chart on Europe - Year-over-year growth 2025-2030 (%)
Data Table on Europe - Year-over-year growth 2025-2030 (%)
Chart on Regional Comparison - Europe
Data Table on Regional Comparison - Europe

13.4.1 Germany - Market size and forecast 2025-2030

Chart on Germany - Market size and forecast 2025-2030 ($ million)
Data Table on Germany - Market size and forecast 2025-2030 ($ million)
Chart on Germany - Year-over-year growth 2025-2030 (%)
Data Table on Germany - Year-over-year growth 2025-2030 (%)

13.4.2 UK - Market size and forecast 2025-2030

Chart on UK - Market size and forecast 2025-2030 ($ million)
Data Table on UK - Market size and forecast 2025-2030 ($ million)
Chart on UK - Year-over-year growth 2025-2030 (%)
Data Table on UK - Year-over-year growth 2025-2030 (%)

13.4.3 France - Market size and forecast 2025-2030

Chart on France - Market size and forecast 2025-2030 ($ million)
Data Table on France - Market size and forecast 2025-2030 ($ million)
Chart on France - Year-over-year growth 2025-2030 (%)
Data Table on France - Year-over-year growth 2025-2030 (%)

13.4.4 Italy - Market size and forecast 2025-2030

Chart on Italy - Market size and forecast 2025-2030 ($ million)
Data Table on Italy - Market size and forecast 2025-2030 ($ million)
Chart on Italy - Year-over-year growth 2025-2030 (%)
Data Table on Italy - Year-over-year growth 2025-2030 (%)

13.4.5 Spain - Market size and forecast 2025-2030

Chart on Spain - Market size and forecast 2025-2030 ($ million)
Data Table on Spain - Market size and forecast 2025-2030 ($ million)
Chart on Spain - Year-over-year growth 2025-2030 (%)
Data Table on Spain - Year-over-year growth 2025-2030 (%)

13.4.6 The Netherlands - Market size and forecast 2025-2030

Chart on The Netherlands - Market size and forecast 2025-2030 ($ million)
Data Table on The Netherlands - Market size and forecast 2025-2030 ($ million)
Chart on The Netherlands - Year-over-year growth 2025-2030 (%)
Data Table on The Netherlands - Year-over-year growth 2025-2030 (%)

13.5 APAC - Market size and forecast 2025-2030

Chart on APAC - Market size and forecast 2025-2030 ($ million)
Data Table on APAC - Market size and forecast 2025-2030 ($ million)
Chart on APAC - Year-over-year growth 2025-2030 (%)
Data Table on APAC - Year-over-year growth 2025-2030 (%)
Chart on Regional Comparison - APAC
Data Table on Regional Comparison - APAC

13.5.1 China - Market size and forecast 2025-2030

Chart on China - Market size and forecast 2025-2030 ($ million)
Data Table on China - Market size and forecast 2025-2030 ($ million)
Chart on China - Year-over-year growth 2025-2030 (%)
Data Table on China - Year-over-year growth 2025-2030 (%)

13.5.2 Japan - Market size and forecast 2025-2030

Chart on Japan - Market size and forecast 2025-2030 ($ million)
Data Table on Japan - Market size and forecast 2025-2030 ($ million)
Chart on Japan - Year-over-year growth 2025-2030 (%)
Data Table on Japan - Year-over-year growth 2025-2030 (%)

13.5.3 India - Market size and forecast 2025-2030

Chart on India - Market size and forecast 2025-2030 ($ million)
Data Table on India - Market size and forecast 2025-2030 ($ million)
Chart on India - Year-over-year growth 2025-2030 (%)
Data Table on India - Year-over-year growth 2025-2030 (%)

13.5.4 South Korea - Market size and forecast 2025-2030

Chart on South Korea - Market size and forecast 2025-2030 ($ million)
Data Table on South Korea - Market size and forecast 2025-2030 ($ million)
Chart on South Korea - Year-over-year growth 2025-2030 (%)
Data Table on South Korea - Year-over-year growth 2025-2030 (%)

13.5.5 Australia - Market size and forecast 2025-2030

Chart on Australia - Market size and forecast 2025-2030 ($ million)
Data Table on Australia - Market size and forecast 2025-2030 ($ million)
Chart on Australia - Year-over-year growth 2025-2030 (%)
Data Table on Australia - Year-over-year growth 2025-2030 (%)

13.5.6 Indonesia - Market size and forecast 2025-2030

Chart on Indonesia - Market size and forecast 2025-2030 ($ million)
Data Table on Indonesia - Market size and forecast 2025-2030 ($ million)
Chart on Indonesia - Year-over-year growth 2025-2030 (%)
Data Table on Indonesia - Year-over-year growth 2025-2030 (%)

13.6 South America - Market size and forecast 2025-2030

Chart on South America - Market size and forecast 2025-2030 ($ million)
Data Table on South America - Market size and forecast 2025-2030 ($ million)
Chart on South America - Year-over-year growth 2025-2030 (%)
Data Table on South America - Year-over-year growth 2025-2030 (%)
Chart on Regional Comparison - South America
Data Table on Regional Comparison - South America

13.6.1 Brazil - Market size and forecast 2025-2030

Chart on Brazil - Market size and forecast 2025-2030 ($ million)
Data Table on Brazil - Market size and forecast 2025-2030 ($ million)
Chart on Brazil - Year-over-year growth 2025-2030 (%)
Data Table on Brazil - Year-over-year growth 2025-2030 (%)

13.6.2 Argentina - Market size and forecast 2025-2030

Chart on Argentina - Market size and forecast 2025-2030 ($ million)
Data Table on Argentina - Market size and forecast 2025-2030 ($ million)
Chart on Argentina - Year-over-year growth 2025-2030 (%)
Data Table on Argentina - Year-over-year growth 2025-2030 (%)

13.6.3 Chile - Market size and forecast 2025-2030

Chart on Chile - Market size and forecast 2025-2030 ($ million)
Data Table on Chile - Market size and forecast 2025-2030 ($ million)
Chart on Chile - Year-over-year growth 2025-2030 (%)
Data Table on Chile - Year-over-year growth 2025-2030 (%)

13.7 Middle East and Africa - Market size and forecast 2025-2030

Chart on Middle East and Africa - Market size and forecast 2025-2030 ($ million)
Data Table on Middle East and Africa - Market size and forecast 2025-2030 ($ million)
Chart on Middle East and Africa - Year-over-year growth 2025-2030 (%)
Data Table on Middle East and Africa - Year-over-year growth 2025-2030 (%)
Chart on Regional Comparison - Middle East and Africa
Data Table on Regional Comparison - Middle East and Africa

13.7.1 Saudi Arabia - Market size and forecast 2025-2030

Chart on Saudi Arabia - Market size and forecast 2025-2030 ($ million)
Data Table on Saudi Arabia - Market size and forecast 2025-2030 ($ million)
Chart on Saudi Arabia - Year-over-year growth 2025-2030 (%)
Data Table on Saudi Arabia - Year-over-year growth 2025-2030 (%)

13.7.2 UAE - Market size and forecast 2025-2030

Chart on UAE - Market size and forecast 2025-2030 ($ million)
Data Table on UAE - Market size and forecast 2025-2030 ($ million)
Chart on UAE - Year-over-year growth 2025-2030 (%)
Data Table on UAE - Year-over-year growth 2025-2030 (%)

13.7.3 South Africa - Market size and forecast 2025-2030

Chart on South Africa - Market size and forecast 2025-2030 ($ million)
Data Table on South Africa - Market size and forecast 2025-2030 ($ million)
Chart on South Africa - Year-over-year growth 2025-2030 (%)
Data Table on South Africa - Year-over-year growth 2025-2030 (%)

13.7.4 Israel - Market size and forecast 2025-2030

Chart on Israel - Market size and forecast 2025-2030 ($ million)
Data Table on Israel - Market size and forecast 2025-2030 ($ million)
Chart on Israel - Year-over-year growth 2025-2030 (%)
Data Table on Israel - Year-over-year growth 2025-2030 (%)

13.7.5 Turkey - Market size and forecast 2025-2030

Chart on Turkey - Market size and forecast 2025-2030 ($ million)
Data Table on Turkey - Market size and forecast 2025-2030 ($ million)
Chart on Turkey - Year-over-year growth 2025-2030 (%)
Data Table on Turkey - Year-over-year growth 2025-2030 (%)

13.8 Market opportunity by geography

Market opportunity by geography ($ million)
Data Tables on Market opportunity by geography ($ million)

14. Drivers, Challenges, and Opportunity

14.1 Market drivers

Increasing demand for functional excipients
Growth in pharmaceutical industry
Evolution in techniques used to produce excipients

14.2 Market challenges

Decreasing research and development expenditures
Loss of patents and patent expiry
Stringent government regulations and FDA approvals

14.3 Impact of drivers and challenges

Impact of drivers and challenges in 2025 and 2030

14.4 Market opportunities

Demand for new excipients to develop easily consumable drugs
Increasing incidence of age-related and other ailments
Rising per capita expenditure is augmenting growth

15. Competitive Landscape

15.1 Overview

15.2

Overview on criticality of inputs and factors of differentiation

15.3 Landscape disruption

Overview on factors of disruption

15.4 Industry risks

Impact of key risks on business

16. Competitive Analysis

16.1 Companies profiled

Companies covered

16.2 Company ranking index

16.3 Market positioning of companies

Matrix on companies position and classification

16.4 BASF SE

BASF SE - Overview
BASF SE - Business segments
BASF SE - Key news
BASF SE - Key offerings
BASF SE - Segment focus
SWOT

16.5 BRENNTAG SE

BRENNTAG SE - Overview
BRENNTAG SE - Business segments
BRENNTAG SE - Key offerings
BRENNTAG SE - Segment focus
SWOT

16.6 Cargill Inc.

Cargill Inc. - Overview
Cargill Inc. - Product / Service
Cargill Inc. - Key news
Cargill Inc. - Key offerings
SWOT

16.7 Clariant International Ltd.

Clariant International Ltd. - Overview
Clariant International Ltd. - Business segments
Clariant International Ltd. - Key offerings
Clariant International Ltd. - Segment focus
SWOT

16.8 Dow Chemical Co.

Dow Chemical Co. - Overview
Dow Chemical Co. - Business segments
Dow Chemical Co. - Key offerings
Dow Chemical Co. - Segment focus
SWOT

16.9 DuPont de Nemours Inc.

DuPont de Nemours Inc. - Overview
DuPont de Nemours Inc. - Business segments
DuPont de Nemours Inc. - Key news
DuPont de Nemours Inc. - Key offerings
DuPont de Nemours Inc. - Segment focus
SWOT

16.10 Evonik Industries AG

Evonik Industries AG - Overview
Evonik Industries AG - Business segments
Evonik Industries AG - Key offerings
Evonik Industries AG - Segment focus
SWOT

16.11 JRS Pharma GmbH Co. KG

JRS Pharma GmbH Co. KG - Overview
JRS Pharma GmbH Co. KG - Product / Service
JRS Pharma GmbH Co. KG - Key offerings
SWOT

16.12 Kerry Group Plc

Kerry Group Plc - Overview
Kerry Group Plc - Business segments
Kerry Group Plc - Key news
Kerry Group Plc - Key offerings
Kerry Group Plc - Segment focus
SWOT

16.13 Merck KGaA

Merck KGaA - Overview
Merck KGaA - Business segments
Merck KGaA - Key news
Merck KGaA - Key offerings
Merck KGaA - Segment focus
SWOT

16.14 Oleon NV

Oleon NV - Overview
Oleon NV - Product / Service
Oleon NV - Key offerings
SWOT

16.15 Omya International AG

Omya International AG - Overview
Omya International AG - Product / Service
Omya International AG - Key offerings
SWOT

16.16 Roquette Freres SA

Roquette Freres SA - Overview
Roquette Freres SA - Product / Service
Roquette Freres SA - Key offerings
SWOT

16.17 The Lubrizol Corp.

The Lubrizol Corp. - Overview
The Lubrizol Corp. - Product / Service
The Lubrizol Corp. - Key offerings
SWOT

16.18 Wacker Chemie AG

Wacker Chemie AG - Overview
Wacker Chemie AG - Business segments
Wacker Chemie AG - Key offerings
Wacker Chemie AG - Segment focus
SWOT

17. Appendix

17.1 Scope of the report

Market definition
Objectives
Notes and caveats

17.2 Inclusions and exclusions checklist

Inclusions checklist
Exclusions checklist

17.3 Currency conversion rates for US$

17.4 Research methodology

17.5 Data procurement

Information sources

17.6 Data validation

17.7 Validation techniques employed for market sizing

17.8 Data synthesis

17.9 360 degree market analysis

17.10 List of abbreviations

Research Methodology

Technavio presents a detailed picture of the market by way of study, synthesis, and summation of data from multiple sources. The analysts have presented the various facets of the market with a particular focus on identifying the key industry influencers. The data thus presented is comprehensive, reliable, and the result of extensive research, both primary and secondary.

INFORMATION SOURCES

Primary sources

  • Manufacturers and suppliers
  • Channel partners
  • Industry experts
  • Strategic decision makers

Secondary sources

  • Industry journals and periodicals
  • Government data
  • Financial reports of key industry players
  • Historical data
  • Press releases

DATA ANALYSIS

Data Synthesis

  • Collation of data
  • Estimation of key figures
  • Analysis of derived insights

Data Validation

  • Triangulation with data models
  • Reference against proprietary databases
  • Corroboration with industry experts

REPORT WRITING

Qualitative

  • Market drivers
  • Market challenges
  • Market trends
  • Five forces analysis

Quantitative

  • Market size and forecast
  • Market segmentation
  • Geographical insights
  • Competitive landscape

Interested in this report?

Get your sample now to see our research methodology and insights!

Download Now

Frequently Asked Questions

Pharmaceutical Excipients market growth will increase by USD 5232.4 million during 2026-2030.

The Pharmaceutical Excipients market is expected to grow at a CAGR of 7.3% during 2026-2030.

Pharmaceutical Excipients market is segmented by Type (Organic, Inorganic) Product (Binders and fillers, Coating agents, Disintegrants, Others) Route of administration (Oral excipients, Topical excipients, Parenteral excipients, Others) Form factor (Solid, Semi-solid, Liquid)

BASF SE, BRENNTAG SE, Cargill Inc., Clariant International Ltd., Colorcon Inc., Dow Chemical Co., DuPont de Nemours Inc., Evonik Industries AG, GMP Pharma Ltd, JRS Pharma GmbH Co. KG, Kerry Group Plc, Lascaray SA, Merck KGaA, Oleon NV, Omya International AG, PensaTech Pharma, Roquette Freres SA, The Lubrizol Corp., Wacker Chemie AG are a few of the key vendors in the Pharmaceutical Excipients market.

North America will register the highest growth rate of 47% among the other regions. Therefore, the Pharmaceutical Excipients market in North America is expected to garner significant business opportunities for the vendors during the forecast period.

US, Canada, Mexico, Germany, UK, France, Italy, Spain, The Netherlands, China, Japan, India, South Korea, Australia, Indonesia, Brazil, Argentina, Chile, Saudi Arabia, UAE, South Africa, Israel, Turkey

  • Increasing demand for functional excipients is the driving factor this market.

The Pharmaceutical Excipients market vendors should focus on grabbing business opportunities from the Type segment as it accounted for the largest market share in the base year.
RIA - Research AI Assistant
Ask RIA
