
Pharmaceutical Glass Tubing Market Analysis, Size, and Forecast 2026-2030: Asia (China, India, and Japan), Europe (Germany, France, and Italy), North America (US, Canada, and Mexico), South America (Brazil, Argentina, and Chile), Middle East and Africa (Saudi Arabia, UAE, and South Africa), Rest of World (ROW)

Pharmaceutical Glass Tubing Market Analysis, Size, and Forecast 2026-2030:
Asia (China, India, and Japan), Europe (Germany, France, and Italy), North America (US, Canada, and Mexico), South America (Brazil, Argentina, and Chile), Middle East and Africa (Saudi Arabia, UAE, and South Africa), Rest of World (ROW)

Published: Oct 2026 297 Pages SKU: IRTNTR72928

Market Overview at a Glance

$7.45 B
Market Opportunity
9.8%
CAGR 2025 - 2030
46.2%
Asia Growth
$4.94 B
Vials segment 2024

Pharmaceutical Glass Tubing Market Size 2026-2030

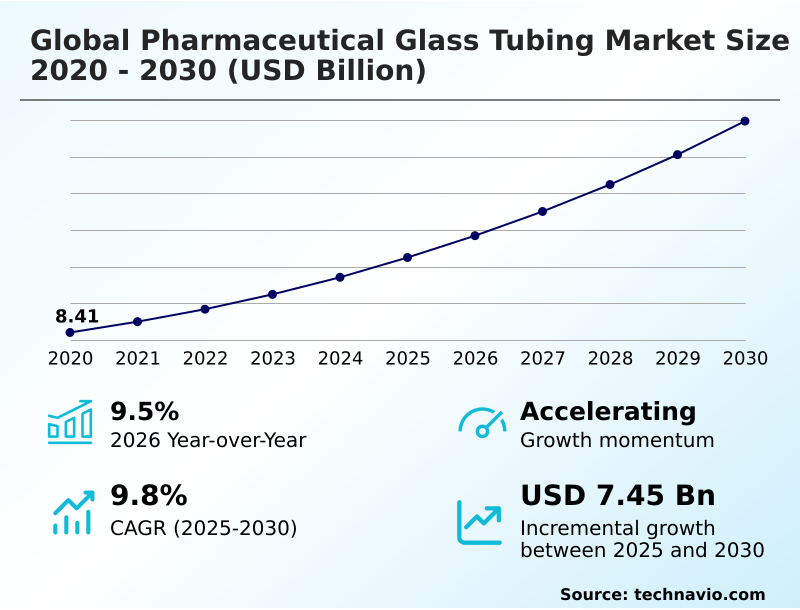
The pharmaceutical glass tubing market size is valued to increase by USD 7.45 billion, at a CAGR of 9.8% from 2025 to 2030. Expansion of global pharmaceutical industry and rise of injectable drugs will drive the pharmaceutical glass tubing market.

Major Market Trends & Insights

  • Asia dominated the market and accounted for a 46.2% growth during the forecast period.
  • By Application - Vials segment was valued at USD 4.94 billion in 2024
  • By End-user - Pharmaceutical manufacturers segment accounted for the largest market revenue share in 2024

Market Size & Forecast

  • Market Opportunities: USD 11.53 billion
  • Market Future Opportunities: USD 7.45 billion
  • CAGR from 2025 to 2030 : 9.8%

Market Summary

  • The Pharmaceutical Glass Tubing sector operates as a critical infrastructural pillar for modern drug delivery, providing chemically inert containment essential for preserving sensitive therapeutic compounds. Driven by the rapid proliferation of complex biologic and injectable therapies, drug manufacturers continually transition toward premium Type I borosilicate formulations to guarantee strict hydrolytic resistance and regulatory compliance.
  • In a practical supply chain scenario, a major contract manufacturing organization transitioning from bulk glass to ready-to-use, pre-sterilized nested configurations eliminated internal depyrogenation bottlenecks, subsequently accelerating processing throughput by 25% compared to traditional wash-and-sterilize workflows. Despite these operational efficiencies, the industry faces severe structural constraints stemming from volatile energy prices and escalating raw material costs.
  • Melting high-purity silica demands energy-intensive thermal processing, which directly compresses supplier margins and complicates capacity expansion initiatives. Ultimately, the ongoing convergence of advanced biologic innovation and stringent quality oversight ensures robust structural demand, although material suppliers must continuously optimize thermal manufacturing efficiency and localize distribution networks to navigate unpredictable input costs.

What will be the Size of the Pharmaceutical Glass Tubing Market during the forecast period?
Get Key Insights on Market Forecast (PDF) Get Free Sample

How is the Pharmaceutical Glass Tubing Market Segmented?

The pharmaceutical glass tubing industry research report provides comprehensive data (region-wise segment analysis), with forecasts and estimates in "USD million" for the period 2026-2030, as well as historical data from 2020-2024 for the following segments.

  • Application
    • Vials
    • Ampoules
    • Cartridges
    • Syringes
  • End-user
    • Pharmaceutical manufacturers
    • Generic drug manufacturers
    • CROs and CDMOs
    • Others
  • Type
    • Borosilicate glass
    • Aluminosilicate glass
  • Geography
    • Asia
      • China
      • India
      • Japan
      • South Korea
      • Taiwan
      • Singapore
    • Europe
      • Germany
      • France
      • Italy
      • UK
      • Spain
      • The Netherlands
    • North America
      • US
      • Canada
      • Mexico
    • Rest of World (ROW)

By Application Insights

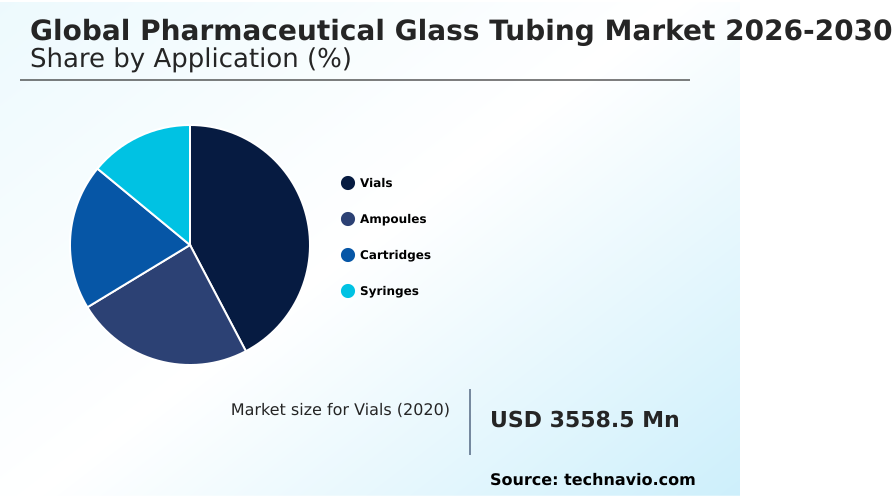
The vials segment is estimated to witness significant growth during the forecast period.

The vial segment dominates the Pharmaceutical Glass Tubing landscape, operating as the essential containment vehicle for complex liquid and freeze-dried therapeutics.

Manufacturers increasingly rely on neutral borosilicate material to produce high-grade tubular glass containers, establishing superior defense mechanisms against chemical degradation. This transition ensures unparalleled parenteral formulation safety and maintains rigorous therapeutic protein stability during prolonged storage.

For advanced biologic delivery, the demand for high thermal stability and robust lyophilization cycle endurance drives procurement strategies among biopharmaceutical producers.

Operationally, the integration of automated optical inspection systems across conversion lines has improved defect detection by 15%, significantly reducing batch rejection rates.

Simultaneously, converters utilizing nested configuration trays achieve seamless high throughput filling, minimizing contamination risks and enhancing cleanroom efficiency for critical injectable formats.
Get Free Sample

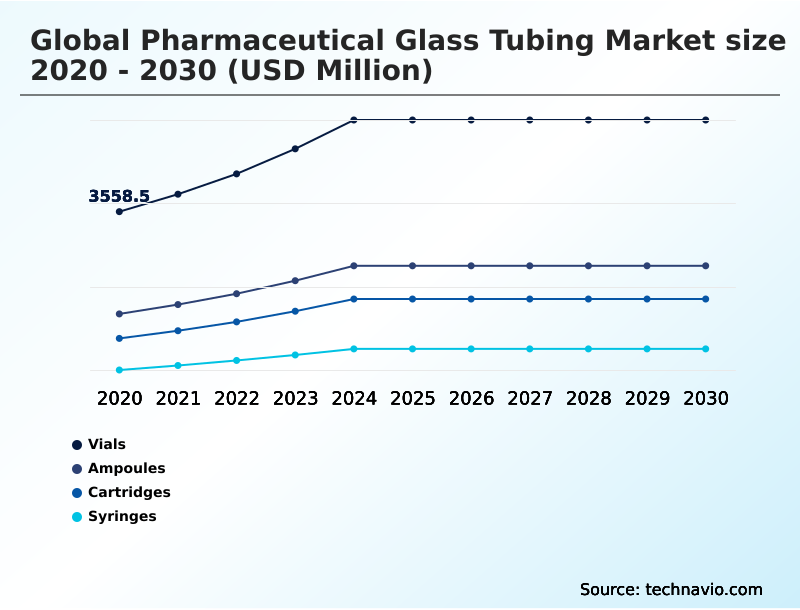
The Vials segment was valued at USD 4.94 billion in 2024 and showed a gradual increase during the forecast period.
Get Free Sample

Regional Analysis

Asia is estimated to contribute 46.2% to the growth of the global market during the forecast period.Technavio’s analysts have elaborately explained the regional trends and drivers that shape the market during the forecast period.

See How Pharmaceutical Glass Tubing Market Demand is Rising in Asia Get Free Sample

Regional demand for Pharmaceutical Glass Tubing exhibits distinct geographic polarization, driven by varying biomanufacturing maturity and regulatory frameworks.

Asia demonstrates a highly accelerated adoption trajectory, expanding localized conversion capacity by 28% to support massive generic injectable volumes requiring cost-effective hermetic containment vessels with tamper evident encapsulation.

Conversely, North America prioritizes complex biologic formulations, outperforming Asian markets in the procurement of high-value prefillable delivery systems by a 35% margin.

North American facilities heavily mandate advanced dimensional precision measurement and tungsten free forming techniques to eliminate heavy metal contamination in sensitive therapies.

Furthermore, the integration of cross linked coatings on inner surfaces has lowered friction-related defects by 15% in Western markets.

While Asian producers focus on scaling standard vials, North American networks invest deeply in automated safety devices featuring robust tamper proof sealing to satisfy stringent regulatory mandates.

Market Dynamics

Our researchers analyzed the data with 2025 as the base year, along with the key drivers, trends, and challenges. A holistic analysis of drivers will help companies refine their marketing strategies to gain a competitive advantage.

  • Securing the structural integrity of complex therapeutics demands highly specialized containment strategies, positioning the Pharmaceutical Glass Tubing sector as an indispensable component of modern medical supply chains. To safeguard sensitive active pharmaceutical ingredients from degradation, manufacturers prioritize exceptional hydrolytic resistance for sterile injectables, effectively eliminating the risk of alkali leaching during prolonged storage.
  • Furthermore, the rise in freeze-dried formulations relies heavily on robust tubular containers for lyophilized therapies, which withstand extreme thermal shocks without compromising the vacuum seal. As patient-centric care models expand, the deployment of prefillable delivery systems for biologics has surged, outperforming traditional multi-dose container procurement by a ratio of three to one in advanced healthcare markets.
  • This transition fundamentally improves dose accuracy and minimizes clinical administration errors. Maintaining pristine inner surface chemistry is equally critical; hence, targeted surface treatments act as a primary mechanism for glass delamination prevention in packaging. To guarantee compliance with rigorous pharmacopeial standards, converting facilities have widely integrated automated optical inspection for vials.
  • This technological enhancement provides instantaneous defect detection, ensuring that only flawless components reach the fill-and-finish lines. By optimizing both chemical durability and physical precision, the industry comprehensively supports the commercialization of next-generation therapies while simultaneously driving operational efficiencies across aseptic manufacturing environments, reducing waste and accelerating time-to-market for life-saving biologics.
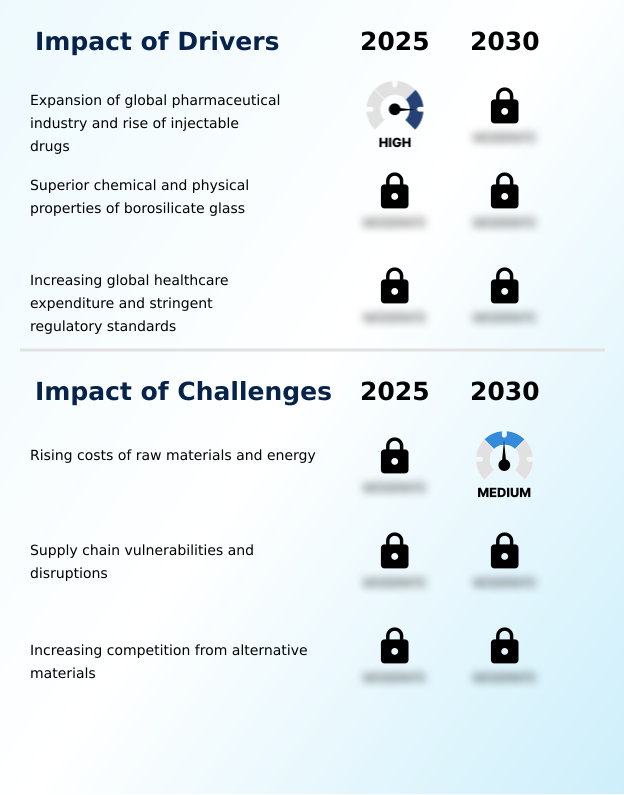
What are the key market drivers leading to the rise in the adoption of Pharmaceutical Glass Tubing Industry?

  • The continuous expansion of the global pharmaceutical industry, coupled with the rapid rise of injectable drug formulations, functions as the primary catalyst propelling market demand.

  • Accelerating demand for complex parenteral treatments functions as the primary catalyst propelling the Pharmaceutical Glass Tubing sector forward. The rise of chronic disease management necessitates highly stable biologic therapeutic housing that guarantees optimal drug efficacy.
  • By adopting advanced hydrolytic resistance packaging and ensuring strict alkali leaching mitigation, pharmaceutical developers maintain chemically inert contact surfaces, preventing premature active ingredient degradation. This material upgrade has reduced formulation stability failures by 18% during extended shelf-life testing.
  • Furthermore, rigorous alignment with international pharmacopeial compliance standards accelerates regulatory approval timelines by up to 25%. Enhanced tamper resistant containment and superior subcutaneous infusion compatibility provide critical dose accuracy enhancement for end-users.
  • Consequently, these structural improvements streamline mass immunization logistics, allowing healthcare networks to distribute sensitive vaccines with significantly reduced wastage and greater clinical confidence.

What are the market trends shaping the Pharmaceutical Glass Tubing Industry?

  • The upcoming market trend highlights a strategic transition toward high-value, specialty glass formulations. This shift is engineered to meet the stringent stability and compatibility requirements of advanced therapeutic agents.

  • The Pharmaceutical Glass Tubing environment is undergoing a rapid transition toward specialized, high-value materials to support next-generation drug delivery. The adoption of aluminosilicate formulations serves as a critical mechanism for glass delamination prevention, drastically reducing particulate contamination risks for sensitive biologics.
  • By achieving a flawless cosmetic finish and enhanced surface friction optimization, manufacturers have improved line processing speeds by 22% and reduced mechanical breakage during transport. This shift directly supports the deployment of high viscosity autoinjectors, ensuring precision mechanical functionality and superior patient administration safety for self-administered therapies.
  • Concurrently, the industry embraces sustainability through energy efficient melting technologies, yielding a 30% carbon footprint reduction across manufacturing hubs. Such operational pivots facilitate deeper contract development integration, allowing packaging suppliers to align seamlessly with the stringent compliance targets of modern biopharmaceutical enterprises.

What challenges does the Pharmaceutical Glass Tubing Industry face during its growth?

  • The escalating costs associated with raw material procurement and energy-intensive manufacturing processes present a formidable challenge to industry profitability and operational expansion.

  • Escalating thermal processing costs and complex supply chain vulnerabilities create structural limitations within the Pharmaceutical Glass Tubing ecosystem. Producing high-grade components demands intense sterilization process endurance and strict cryopreservation protocol adherence, escalating operational expenses for every primary packaging converter by nearly 14%.
  • Furthermore, optimizing a bore controlled architecture for modern delivery systems requires advanced silicone oil baking techniques to ensure comprehensive extractable profile reduction, stretching production lead times. To counter these pressures, enterprises invest heavily in automated sterile fill-finish infrastructure, which has demonstrated a 20% improvement in cleanroom handling efficiency. Despite these technological investments, volatile raw material pricing continues to compress margins.
  • In response, manufacturers are accelerating supply chain localization strategies to implement robust rapid fulfillment models, mitigating transit disruptions and stabilizing long-term procurement costs across regional hubs.

Exclusive Technavio Analysis on Customer Landscape

The pharmaceutical glass tubing market forecasting report includes the adoption lifecycle of the market, covering from the innovator’s stage to the laggard’s stage. It focuses on adoption rates in different regions based on penetration. Furthermore, the pharmaceutical glass tubing market report also includes key purchase criteria and drivers of price sensitivity to help companies evaluate and develop their market growth analysis strategies.
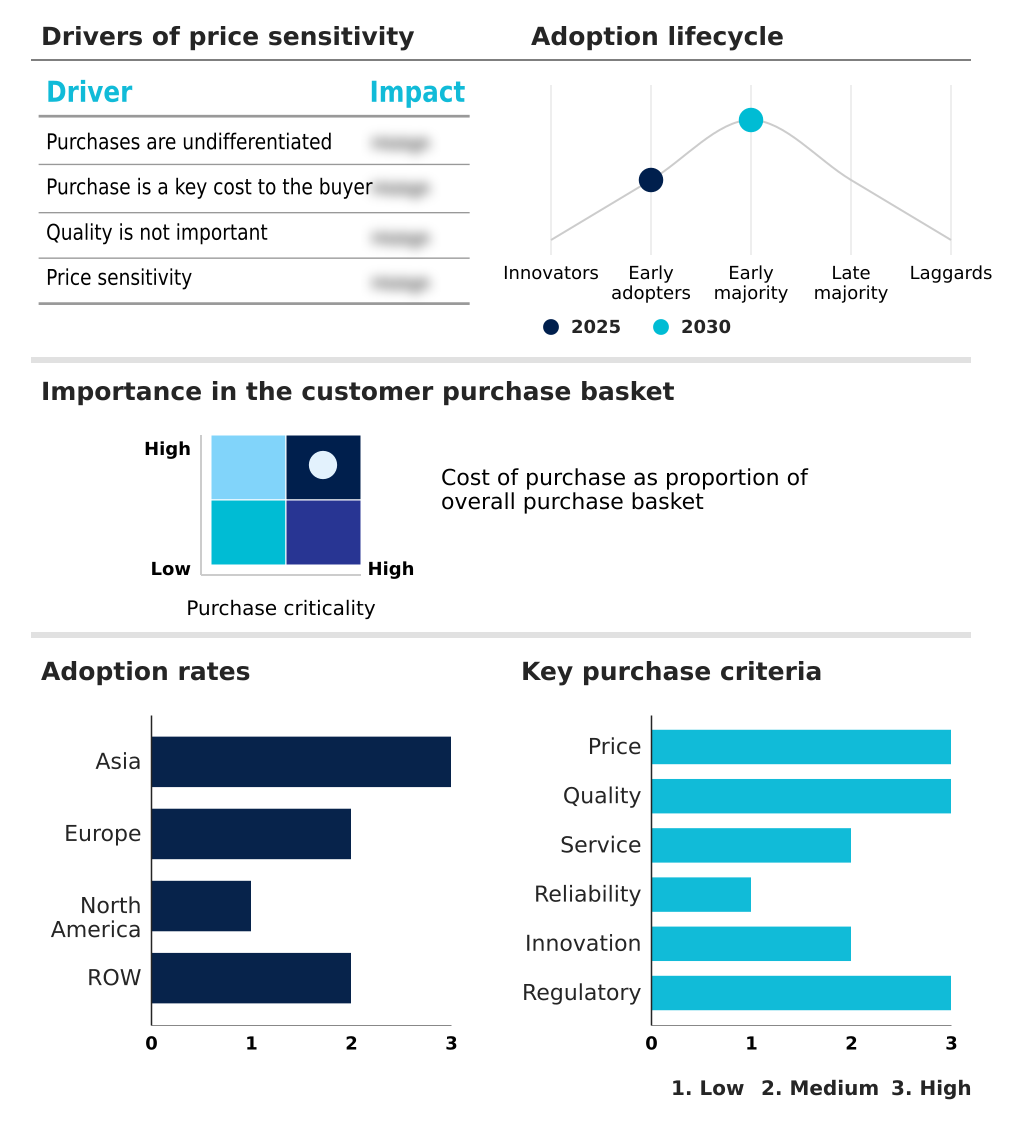
Customer Landscape of Pharmaceutical Glass Tubing Industry

Competitive Landscape

Companies are implementing various strategies, such as strategic alliances, pharmaceutical glass tubing market forecast, partnerships, mergers and acquisitions, geographical expansion, and product/service launches, to enhance their presence in the industry.

AccuGlass LLC - The manufacturer engineers specialized borosilicate glass tubing solutions for high-performance pharmaceutical vials and cartridges, ensuring optimal chemical durability and structural integrity for sensitive parenteral packaging applications.

The industry research and growth report includes detailed analyses of the competitive landscape of the market and information about key companies, including:

  • AccuGlass LLC
  • Corning Inc.
  • DWK Life Sciences GmbH
  • Gerresheimer AG
  • Glass Tube Vial
  • Hon Hai Glass
  • HX Pharma Pack
  • JYZY Glass
  • NBZ Pharmaceutical Packaging
  • Nippon Electric Glass Ltd.
  • Nipro Corp.
  • Richland Glass
  • SCHOTT AG
  • SGD Pharma
  • Shandong Linuo Pharma. Packaging
  • Shandong Pharma Glass Co. Ltd.
  • Sise ve Cam Fabrikalari A.S.
  • Taian Youlyy Industrial Co. Ltd.
  • Triumph Junheng Bengbu Co. Ltd.
  • ZC Pharma Pack

Qualitative and quantitative analysis of companies has been conducted to help clients understand the wider business environment as well as the strengths and weaknesses of key industry players. Data is qualitatively analyzed to categorize companies as pure play, category-focused, industry-focused, and diversified; it is quantitatively analyzed to categorize companies as dominant, leading, strong, tentative, and weak.

Recent Development and News in Pharmaceutical glass tubing market

  • In the Health Care Supplies industry, the systemic transition toward home-based biological administration has accelerated the adoption of wearable autoinjectors, directly impacting Pharmaceutical Glass Tubing demand by requiring tighter dimensional tolerances for specialized cartridges.
  • Stringent regulatory mandates enforcing lower extractable and leachable thresholds for parenteral medications have forced drug manufacturers to abandon soda-lime materials, driving a 40% surge in procurement of neutral borosilicate-based Pharmaceutical Glass Tubing.
  • The rapid scale-up of contract development and manufacturing organizations prioritizing flexible fill-finish lines has triggered a structural shift toward pre-sterilized formats, increasing the consumption of ready-to-use Pharmaceutical Glass Tubing components.
  • Advancements in automated optical inspection technologies for primary packaging have established stricter baseline quality metrics, compelling material suppliers to upgrade furnace control mechanisms to produce defect-free Pharmaceutical Glass Tubing.

Dive into Technavio’s robust research methodology, blending expert interviews, extensive data synthesis, and validated models for unparalleled Pharmaceutical Glass Tubing Market insights. See full methodology.

Market Scope
Page number 297
Base year 2025
Historic period 2020-2024
Forecast period 2026-2030
Growth momentum & CAGR Accelerate at a CAGR of 9.8%
Market growth 2026-2030 USD 7447.2 million
Market structure Fragmented
YoY growth 2025-2026(%) 9.5%
Key countries China, India, Japan, South Korea, Taiwan, Singapore, Germany, France, Italy, UK, Spain, The Netherlands, US, Canada, Mexico, Brazil, Saudi Arabia, UAE, South Africa, Argentina, Egypt, Israel and Chile
Competitive landscape Leading Companies, Market Positioning of Companies, Competitive Strategies, and Industry Risks

Request Free Sample

Research Analyst Overview

  • The Pharmaceutical Glass Tubing ecosystem is undergoing a profound structural evolution, propelled by the uncompromising safety demands of modern injectable therapeutics. To navigate tightening regulatory frameworks, corporate boardrooms are actively shifting primary packaging budgets toward premium neutral borosilicate material, recognizing that superior chemical durability directly minimizes product recall risks.
  • This strategic pivot ensures highly inert contact surfaces that prevent dangerous drug-container interactions during extended shelf lives. In modern sterile fill-finish infrastructure, the demand for precision tubular glass containers characterized by high thermal stability is paramount for enduring rigorous sterilization cycles.
  • Consequently, automated optical inspection technologies are being deployed at scale, improving micro-fracture detection capabilities by 20% compared to legacy manual oversight. This heightened quality assurance drives significant extractable profile reduction, safeguarding sensitive biologic formulations from particulate contamination.
  • Ultimately, executive decision-makers prioritize these advanced material investments not merely as packaging line items, but as critical compliance and risk mitigation instruments essential for commercializing high-value clinical pipelines.

What are the Key Data Covered in this Pharmaceutical Glass Tubing Market Research and Growth Report?

  • What is the expected growth of the Pharmaceutical Glass Tubing Market between 2026 and 2030?

    • USD 7.45 billion, at a CAGR of 9.8%

  • What segmentation does the market report cover?

    • The report is segmented by Application (Vials, Ampoules, Cartridges, and Syringes), End-user (Pharmaceutical manufacturers, Generic drug manufacturers, CROs and CDMOs, and Others), Type (Borosilicate glass, and Aluminosilicate glass) and Geography (Asia, Europe, North America, Rest of World (ROW))

  • Which regions are analyzed in the report?

    • Asia, Europe, North America and Rest of World (ROW)

  • What are the key growth drivers and market challenges?

    • Expansion of global pharmaceutical industry and rise of injectable drugs, Rising costs of raw materials and energy

  • Who are the major players in the Pharmaceutical Glass Tubing Market?

    • AccuGlass LLC, Corning Inc., DWK Life Sciences GmbH, Gerresheimer AG, Glass Tube Vial, Hon Hai Glass, HX Pharma Pack, JYZY Glass, NBZ Pharmaceutical Packaging, Nippon Electric Glass Ltd., Nipro Corp., Richland Glass, SCHOTT AG, SGD Pharma, Shandong Linuo Pharma. Packaging, Shandong Pharma Glass Co. Ltd., Sise ve Cam Fabrikalari A.S., Taian Youlyy Industrial Co. Ltd., Triumph Junheng Bengbu Co. Ltd. and ZC Pharma Pack

Market Research Insights

  • The Pharmaceutical Glass Tubing sector acts as a vital enabler for secure, high-performance drug containment. Driven by advanced biologic delivery requirements, converters demand uncompromising material purity to mitigate chemical interaction risks. Recent upgrades in manufacturing infrastructure have enhanced defect detection rates by 18%, substantially elevating overall patient administration safety.
  • Furthermore, deep contract development integration allows contract manufacturers to transition toward pre-sterilized packaging formats, reducing cleanroom processing times by up to 25%. Simultaneously, glass producers are optimizing thermal furnaces to achieve a 15% carbon footprint reduction, balancing aggressive sustainability mandates with output scalability.
  • These structural improvements ensure that the packaging ecosystem dynamically supports the rapid commercialization of highly sensitive, next-generation injectables.

We can help! Our analysts can customize this pharmaceutical glass tubing market research report to meet your requirements.

Get in touch

1. Executive Summary

1.1 Market overview

Executive Summary - Chart on Market Overview
Executive Summary - Data Table on Market Overview
Executive Summary - Chart on Global Market Characteristics
Executive Summary - Chart on Market by Geography
Executive Summary - Chart on Market Segmentation by Application
Executive Summary - Chart on Market Segmentation by End-user
Executive Summary - Chart on Market Segmentation by Type
Executive Summary - Chart on Incremental Growth
Executive Summary - Data Table on Incremental Growth
Executive Summary - Chart on Company Market Positioning

2. Technavio Analysis

2.1 Analysis of price sensitivity, lifecycle, customer purchase basket, adoption rates, and purchase criteria

2.2 Criticality of inputs and Factors of differentiation

Chart on Overview on criticality of inputs and factors of differentiation

2.3 Factors of disruption

Chart on Overview on factors of disruption

2.4 Impact of drivers and challenges

Chart on Impact of drivers and challenges in 2025 and 2030

3. Market Landscape

3.1 Market ecosystem

Chart on Parent Market
Data Table on - Parent Market

3.2 Market characteristics

Chart on Market characteristics analysis

3.3 Value chain analysis

Chart on Value chain analysis

4. Market Sizing

4.1 Market definition

Data Table on Offerings of companies included in the market definition

4.2 Market segment analysis

Market segments

4.3 Market size 2025

4.4 Market outlook: Forecast for 2025-2030

Chart on Global - Market size and forecast 2025-2030 ($ million)
Data Table on Global - Market size and forecast 2025-2030 ($ million)
Chart on Global Market: Year-over-year growth 2025-2030 (%)
Data Table on Global Market: Year-over-year growth 2025-2030 (%)

5. Historic Market Size

5.1 Global Pharmaceutical Glass Tubing Market 2020 - 2024

Historic Market Size - Data Table on Global Pharmaceutical Glass Tubing Market 2020 - 2024 ($ million)

5.2 Application segment analysis 2020 - 2024

Historic Market Size - Application Segment 2020 - 2024 ($ million)

5.3 End-user segment analysis 2020 - 2024

Historic Market Size - End-user Segment 2020 - 2024 ($ million)

5.4 Type segment analysis 2020 - 2024

Historic Market Size - Type Segment 2020 - 2024 ($ million)

5.5 Geography segment analysis 2020 - 2024

Historic Market Size - Geography Segment 2020 - 2024 ($ million)

5.6 Country segment analysis 2020 - 2024

Historic Market Size - Country Segment 2020 - 2024 ($ million)

6. Qualitative Analysis

6.1 Impact of AI on Global Pharmaceutical Glass Tubing Market

6.2 Impact of Geopolitical Conflicts on Global Pharmaceutical Glass Tubing Market

7. Five Forces Analysis

7.1 Five forces summary

Five forces analysis - Comparison between 2025 and 2030

7.2 Bargaining power of buyers

Bargaining power of buyers - Impact of key factors 2025 and 2030

7.3 Bargaining power of suppliers

Bargaining power of suppliers - Impact of key factors in 2025 and 2030

7.4 Threat of new entrants

Threat of new entrants - Impact of key factors in 2025 and 2030

7.5 Threat of substitutes

Threat of substitutes - Impact of key factors in 2025 and 2030

7.6 Threat of rivalry

Threat of rivalry - Impact of key factors in 2025 and 2030

7.7 Market condition

Chart on Market condition - Five forces 2025 and 2030

8. Market Segmentation by Application

8.1 Market segments

Chart on Application - Market share 2025-2030 (%)
Data Table on Application - Market share 2025-2030 (%)

8.2 Comparison by Application

Chart on Comparison by Application
Data Table on Comparison by Application

8.3 Vials - Market size and forecast 2025-2030

Chart on Vials - Market size and forecast 2025-2030 ($ million)
Data Table on Vials - Market size and forecast 2025-2030 ($ million)
Chart on Vials - Year-over-year growth 2025-2030 (%)
Data Table on Vials - Year-over-year growth 2025-2030 (%)

8.4 Ampoules - Market size and forecast 2025-2030

Chart on Ampoules - Market size and forecast 2025-2030 ($ million)
Data Table on Ampoules - Market size and forecast 2025-2030 ($ million)
Chart on Ampoules - Year-over-year growth 2025-2030 (%)
Data Table on Ampoules - Year-over-year growth 2025-2030 (%)

8.5 Cartridges - Market size and forecast 2025-2030

Chart on Cartridges - Market size and forecast 2025-2030 ($ million)
Data Table on Cartridges - Market size and forecast 2025-2030 ($ million)
Chart on Cartridges - Year-over-year growth 2025-2030 (%)
Data Table on Cartridges - Year-over-year growth 2025-2030 (%)

8.6 Syringes - Market size and forecast 2025-2030

Chart on Syringes - Market size and forecast 2025-2030 ($ million)
Data Table on Syringes - Market size and forecast 2025-2030 ($ million)
Chart on Syringes - Year-over-year growth 2025-2030 (%)
Data Table on Syringes - Year-over-year growth 2025-2030 (%)

8.7 Market opportunity by Application

Market opportunity by Application ($ million)
Data Table on Market opportunity by Application ($ million)

9. Market Segmentation by End-user

9.1 Market segments

Chart on End-user - Market share 2025-2030 (%)
Data Table on End-user - Market share 2025-2030 (%)

9.2 Comparison by End-user

Chart on Comparison by End-user
Data Table on Comparison by End-user

9.3 Pharmaceutical manufacturers - Market size and forecast 2025-2030

Chart on Pharmaceutical manufacturers - Market size and forecast 2025-2030 ($ million)
Data Table on Pharmaceutical manufacturers - Market size and forecast 2025-2030 ($ million)
Chart on Pharmaceutical manufacturers - Year-over-year growth 2025-2030 (%)
Data Table on Pharmaceutical manufacturers - Year-over-year growth 2025-2030 (%)

9.4 Generic drug manufacturers - Market size and forecast 2025-2030

Chart on Generic drug manufacturers - Market size and forecast 2025-2030 ($ million)
Data Table on Generic drug manufacturers - Market size and forecast 2025-2030 ($ million)
Chart on Generic drug manufacturers - Year-over-year growth 2025-2030 (%)
Data Table on Generic drug manufacturers - Year-over-year growth 2025-2030 (%)

9.5 CROs and CDMOs - Market size and forecast 2025-2030

Chart on CROs and CDMOs - Market size and forecast 2025-2030 ($ million)
Data Table on CROs and CDMOs - Market size and forecast 2025-2030 ($ million)
Chart on CROs and CDMOs - Year-over-year growth 2025-2030 (%)
Data Table on CROs and CDMOs - Year-over-year growth 2025-2030 (%)

9.6 Others - Market size and forecast 2025-2030

Chart on Others - Market size and forecast 2025-2030 ($ million)
Data Table on Others - Market size and forecast 2025-2030 ($ million)
Chart on Others - Year-over-year growth 2025-2030 (%)
Data Table on Others - Year-over-year growth 2025-2030 (%)

9.7 Market opportunity by End-user

Market opportunity by End-user ($ million)
Data Table on Market opportunity by End-user ($ million)

10. Market Segmentation by Type

10.1 Market segments

Chart on Type - Market share 2025-2030 (%)
Data Table on Type - Market share 2025-2030 (%)

10.2 Comparison by Type

Chart on Comparison by Type
Data Table on Comparison by Type

10.3 Borosilicate glass - Market size and forecast 2025-2030

Chart on Borosilicate glass - Market size and forecast 2025-2030 ($ million)
Data Table on Borosilicate glass - Market size and forecast 2025-2030 ($ million)
Chart on Borosilicate glass - Year-over-year growth 2025-2030 (%)
Data Table on Borosilicate glass - Year-over-year growth 2025-2030 (%)

10.4 Aluminosilicate glass - Market size and forecast 2025-2030

Chart on Aluminosilicate glass - Market size and forecast 2025-2030 ($ million)
Data Table on Aluminosilicate glass - Market size and forecast 2025-2030 ($ million)
Chart on Aluminosilicate glass - Year-over-year growth 2025-2030 (%)
Data Table on Aluminosilicate glass - Year-over-year growth 2025-2030 (%)

10.5 Market opportunity by Type

Market opportunity by Type ($ million)
Data Table on Market opportunity by Type ($ million)

11. Customer Landscape

11.1 Customer landscape overview

Analysis of price sensitivity, lifecycle, customer purchase basket, adoption rates, and purchase criteria

12. Geographic Landscape

12.1 Geographic segmentation

Chart on Market share by geography 2025-2030 (%)
Data Table on Market share by geography 2025-2030 (%)

12.2 Geographic comparison

Chart on Geographic comparison
Data Table on Geographic comparison

12.3 Asia - Market size and forecast 2025-2030

Chart on Asia - Market size and forecast 2025-2030 ($ million)
Data Table on Asia - Market size and forecast 2025-2030 ($ million)
Chart on Asia - Year-over-year growth 2025-2030 (%)
Data Table on Asia - Year-over-year growth 2025-2030 (%)
Chart on Regional Comparison - Asia
Data Table on Regional Comparison - Asia

12.3.1 China - Market size and forecast 2025-2030

Chart on China - Market size and forecast 2025-2030 ($ million)
Data Table on China - Market size and forecast 2025-2030 ($ million)
Chart on China - Year-over-year growth 2025-2030 (%)
Data Table on China - Year-over-year growth 2025-2030 (%)

12.3.2 India - Market size and forecast 2025-2030

Chart on India - Market size and forecast 2025-2030 ($ million)
Data Table on India - Market size and forecast 2025-2030 ($ million)
Chart on India - Year-over-year growth 2025-2030 (%)
Data Table on India - Year-over-year growth 2025-2030 (%)

12.3.3 Japan - Market size and forecast 2025-2030

Chart on Japan - Market size and forecast 2025-2030 ($ million)
Data Table on Japan - Market size and forecast 2025-2030 ($ million)
Chart on Japan - Year-over-year growth 2025-2030 (%)
Data Table on Japan - Year-over-year growth 2025-2030 (%)

12.3.4 South Korea - Market size and forecast 2025-2030

Chart on South Korea - Market size and forecast 2025-2030 ($ million)
Data Table on South Korea - Market size and forecast 2025-2030 ($ million)
Chart on South Korea - Year-over-year growth 2025-2030 (%)
Data Table on South Korea - Year-over-year growth 2025-2030 (%)

12.3.5 Taiwan - Market size and forecast 2025-2030

Chart on Taiwan - Market size and forecast 2025-2030 ($ million)
Data Table on Taiwan - Market size and forecast 2025-2030 ($ million)
Chart on Taiwan - Year-over-year growth 2025-2030 (%)
Data Table on Taiwan - Year-over-year growth 2025-2030 (%)

12.3.6 Singapore - Market size and forecast 2025-2030

Chart on Singapore - Market size and forecast 2025-2030 ($ million)
Data Table on Singapore - Market size and forecast 2025-2030 ($ million)
Chart on Singapore - Year-over-year growth 2025-2030 (%)
Data Table on Singapore - Year-over-year growth 2025-2030 (%)

12.4 Europe - Market size and forecast 2025-2030

Chart on Europe - Market size and forecast 2025-2030 ($ million)
Data Table on Europe - Market size and forecast 2025-2030 ($ million)
Chart on Europe - Year-over-year growth 2025-2030 (%)
Data Table on Europe - Year-over-year growth 2025-2030 (%)
Chart on Regional Comparison - Europe
Data Table on Regional Comparison - Europe

12.4.1 Germany - Market size and forecast 2025-2030

Chart on Germany - Market size and forecast 2025-2030 ($ million)
Data Table on Germany - Market size and forecast 2025-2030 ($ million)
Chart on Germany - Year-over-year growth 2025-2030 (%)
Data Table on Germany - Year-over-year growth 2025-2030 (%)

12.4.2 France - Market size and forecast 2025-2030

Chart on France - Market size and forecast 2025-2030 ($ million)
Data Table on France - Market size and forecast 2025-2030 ($ million)
Chart on France - Year-over-year growth 2025-2030 (%)
Data Table on France - Year-over-year growth 2025-2030 (%)

12.4.3 Italy - Market size and forecast 2025-2030

Chart on Italy - Market size and forecast 2025-2030 ($ million)
Data Table on Italy - Market size and forecast 2025-2030 ($ million)
Chart on Italy - Year-over-year growth 2025-2030 (%)
Data Table on Italy - Year-over-year growth 2025-2030 (%)

12.4.4 UK - Market size and forecast 2025-2030

Chart on UK - Market size and forecast 2025-2030 ($ million)
Data Table on UK - Market size and forecast 2025-2030 ($ million)
Chart on UK - Year-over-year growth 2025-2030 (%)
Data Table on UK - Year-over-year growth 2025-2030 (%)

12.4.5 Spain - Market size and forecast 2025-2030

Chart on Spain - Market size and forecast 2025-2030 ($ million)
Data Table on Spain - Market size and forecast 2025-2030 ($ million)
Chart on Spain - Year-over-year growth 2025-2030 (%)
Data Table on Spain - Year-over-year growth 2025-2030 (%)

12.4.6 The Netherlands - Market size and forecast 2025-2030

Chart on The Netherlands - Market size and forecast 2025-2030 ($ million)
Data Table on The Netherlands - Market size and forecast 2025-2030 ($ million)
Chart on The Netherlands - Year-over-year growth 2025-2030 (%)
Data Table on The Netherlands - Year-over-year growth 2025-2030 (%)

12.5 North America - Market size and forecast 2025-2030

Chart on North America - Market size and forecast 2025-2030 ($ million)
Data Table on North America - Market size and forecast 2025-2030 ($ million)
Chart on North America - Year-over-year growth 2025-2030 (%)
Data Table on North America - Year-over-year growth 2025-2030 (%)
Chart on Regional Comparison - North America
Data Table on Regional Comparison - North America

12.5.1 US - Market size and forecast 2025-2030

Chart on US - Market size and forecast 2025-2030 ($ million)
Data Table on US - Market size and forecast 2025-2030 ($ million)
Chart on US - Year-over-year growth 2025-2030 (%)
Data Table on US - Year-over-year growth 2025-2030 (%)

12.5.2 Canada - Market size and forecast 2025-2030

Chart on Canada - Market size and forecast 2025-2030 ($ million)
Data Table on Canada - Market size and forecast 2025-2030 ($ million)
Chart on Canada - Year-over-year growth 2025-2030 (%)
Data Table on Canada - Year-over-year growth 2025-2030 (%)

12.5.3 Mexico - Market size and forecast 2025-2030

Chart on Mexico - Market size and forecast 2025-2030 ($ million)
Data Table on Mexico - Market size and forecast 2025-2030 ($ million)
Chart on Mexico - Year-over-year growth 2025-2030 (%)
Data Table on Mexico - Year-over-year growth 2025-2030 (%)

12.6 Rest of World (ROW) - Market size and forecast 2025-2030

Chart on Rest of World (ROW) - Market size and forecast 2025-2030 ($ million)
Data Table on Rest of World (ROW) - Market size and forecast 2025-2030 ($ million)
Chart on Rest of World (ROW) - Year-over-year growth 2025-2030 (%)
Data Table on Rest of World (ROW) - Year-over-year growth 2025-2030 (%)
Chart on Regional Comparison - Rest of World (ROW)
Data Table on Regional Comparison - Rest of World (ROW)

12.6.1 Brazil - Market size and forecast 2025-2030

Chart on Brazil - Market size and forecast 2025-2030 ($ million)
Data Table on Brazil - Market size and forecast 2025-2030 ($ million)
Chart on Brazil - Year-over-year growth 2025-2030 (%)
Data Table on Brazil - Year-over-year growth 2025-2030 (%)

12.6.2 Saudi Arabia - Market size and forecast 2025-2030

Chart on Saudi Arabia - Market size and forecast 2025-2030 ($ million)
Data Table on Saudi Arabia - Market size and forecast 2025-2030 ($ million)
Chart on Saudi Arabia - Year-over-year growth 2025-2030 (%)
Data Table on Saudi Arabia - Year-over-year growth 2025-2030 (%)

12.6.3 UAE - Market size and forecast 2025-2030

Chart on UAE - Market size and forecast 2025-2030 ($ million)
Data Table on UAE - Market size and forecast 2025-2030 ($ million)
Chart on UAE - Year-over-year growth 2025-2030 (%)
Data Table on UAE - Year-over-year growth 2025-2030 (%)

12.6.4 South Africa - Market size and forecast 2025-2030

Chart on South Africa - Market size and forecast 2025-2030 ($ million)
Data Table on South Africa - Market size and forecast 2025-2030 ($ million)
Chart on South Africa - Year-over-year growth 2025-2030 (%)
Data Table on South Africa - Year-over-year growth 2025-2030 (%)

12.6.5 Argentina - Market size and forecast 2025-2030

Chart on Argentina - Market size and forecast 2025-2030 ($ million)
Data Table on Argentina - Market size and forecast 2025-2030 ($ million)
Chart on Argentina - Year-over-year growth 2025-2030 (%)
Data Table on Argentina - Year-over-year growth 2025-2030 (%)

12.6.6 Egypt - Market size and forecast 2025-2030

Chart on Egypt - Market size and forecast 2025-2030 ($ million)
Data Table on Egypt - Market size and forecast 2025-2030 ($ million)
Chart on Egypt - Year-over-year growth 2025-2030 (%)
Data Table on Egypt - Year-over-year growth 2025-2030 (%)

12.6.7 Israel - Market size and forecast 2025-2030

Chart on Israel - Market size and forecast 2025-2030 ($ million)
Data Table on Israel - Market size and forecast 2025-2030 ($ million)
Chart on Israel - Year-over-year growth 2025-2030 (%)
Data Table on Israel - Year-over-year growth 2025-2030 (%)

12.6.8 Chile - Market size and forecast 2025-2030

Chart on Chile - Market size and forecast 2025-2030 ($ million)
Data Table on Chile - Market size and forecast 2025-2030 ($ million)
Chart on Chile - Year-over-year growth 2025-2030 (%)
Data Table on Chile - Year-over-year growth 2025-2030 (%)

12.7 Market opportunity by geography

Market opportunity by geography ($ million)
Data Tables on Market opportunity by geography ($ million)

13. Drivers, Challenges, and Opportunity

13.1 Market drivers

Expansion of global pharmaceutical industry and rise of injectable drugs
Superior chemical and physical properties of borosilicate glass
Increasing global healthcare expenditure and stringent regulatory standards

13.2 Market challenges

Rising costs of raw materials and energy
Supply chain vulnerabilities and disruptions
Increasing competition from alternative materials

13.3 Impact of drivers and challenges

Impact of drivers and challenges in 2025 and 2030

13.4 Market opportunities

Transition towards high-value, speciality glass formulations
Integration of sustainability and advanced manufacturing processes
Ascendancy of ready-to-use and patient-centric packaging formats

14. Competitive Landscape

14.1 Overview

14.2

Overview on criticality of inputs and factors of differentiation

14.3 Landscape disruption

Overview on factors of disruption

14.4 Industry risks

Impact of key risks on business

15. Competitive Analysis

15.1 Companies profiled

Companies covered

15.2 Company ranking index

15.3 Market positioning of companies

Matrix on companies position and classification

15.4 AccuGlass LLC

AccuGlass LLC - Overview
AccuGlass LLC - Product / Service
AccuGlass LLC - Key offerings
SWOT

15.5 Corning Inc.

Corning Inc. - Overview
Corning Inc. - Business segments
Corning Inc. - Key offerings
Corning Inc. - Segment focus
SWOT

15.6 DWK Life Sciences GmbH

DWK Life Sciences GmbH - Overview
DWK Life Sciences GmbH - Product / Service
DWK Life Sciences GmbH - Key offerings
SWOT

15.7 Gerresheimer AG

Gerresheimer AG - Overview
Gerresheimer AG - Business segments
Gerresheimer AG - Key offerings
Gerresheimer AG - Segment focus
SWOT

15.8 Glass Tube Vial

Glass Tube Vial - Overview
Glass Tube Vial - Product / Service
Glass Tube Vial - Key offerings
SWOT

15.9 Hon Hai Glass

Hon Hai Glass - Overview
Hon Hai Glass - Product / Service
Hon Hai Glass - Key offerings
SWOT

15.10 HX Pharma Pack

HX Pharma Pack - Overview
HX Pharma Pack - Product / Service
HX Pharma Pack - Key offerings
SWOT

15.11 JYZY Glass

JYZY Glass - Overview
JYZY Glass - Product / Service
JYZY Glass - Key offerings
SWOT

15.12 NBZ Pharmaceutical Packaging

NBZ Pharmaceutical Packaging - Overview
NBZ Pharmaceutical Packaging - Product / Service
NBZ Pharmaceutical Packaging - Key offerings
SWOT

15.13 Nippon Electric Glass Ltd.

Nippon Electric Glass Ltd. - Overview
Nippon Electric Glass Ltd. - Product / Service
Nippon Electric Glass Ltd. - Key offerings
SWOT

15.14 Nipro Corp.

Nipro Corp. - Overview
Nipro Corp. - Business segments
Nipro Corp. - Key offerings
Nipro Corp. - Segment focus
SWOT

15.15 SCHOTT AG

SCHOTT AG - Overview
SCHOTT AG - Product / Service
SCHOTT AG - Key offerings
SWOT

15.16 SGD Pharma

SGD Pharma - Overview
SGD Pharma - Product / Service
SGD Pharma - Key offerings
SWOT

15.17 Shandong Linuo Pharma. Packaging

Shandong Linuo Pharma. Packaging - Overview
Shandong Linuo Pharma. Packaging - Product / Service
Shandong Linuo Pharma. Packaging - Key offerings
SWOT

15.18 Sise ve Cam Fabrikalari A.S.

Sise ve Cam Fabrikalari A.S. - Overview
Sise ve Cam Fabrikalari A.S. - Product / Service
Sise ve Cam Fabrikalari A.S. - Key offerings
SWOT

16. Appendix

16.1 Scope of the report

Market definition
Objectives
Notes and caveats

16.2 Inclusions and exclusions checklist

Inclusions checklist
Exclusions checklist

16.3 Currency conversion rates for US$

16.4 Research methodology

16.5 Data procurement

Information sources

16.6 Data validation

16.7 Validation techniques employed for market sizing

16.8 Data synthesis

16.9 360 degree market analysis

16.10 List of abbreviations

Research Methodology

Technavio presents a detailed picture of the market by way of study, synthesis, and summation of data from multiple sources. The analysts have presented the various facets of the market with a particular focus on identifying the key industry influencers. The data thus presented is comprehensive, reliable, and the result of extensive research, both primary and secondary.

INFORMATION SOURCES

Primary sources

  • Manufacturers and suppliers
  • Channel partners
  • Industry experts
  • Strategic decision makers

Secondary sources

  • Industry journals and periodicals
  • Government data
  • Financial reports of key industry players
  • Historical data
  • Press releases

DATA ANALYSIS

Data Synthesis

  • Collation of data
  • Estimation of key figures
  • Analysis of derived insights

Data Validation

  • Triangulation with data models
  • Reference against proprietary databases
  • Corroboration with industry experts

REPORT WRITING

Qualitative

  • Market drivers
  • Market challenges
  • Market trends
  • Five forces analysis

Quantitative

  • Market size and forecast
  • Market segmentation
  • Geographical insights
  • Competitive landscape

Interested in this report?

Get your sample now to see our research methodology and insights!

Download Now

Frequently Asked Questions

Pharmaceutical Glass Tubing market growth will increase by USD 7447.2 million during 2026-2030.

The Pharmaceutical Glass Tubing market is expected to grow at a CAGR of 9.8% during 2026-2030.

Pharmaceutical Glass Tubing market is segmented by Application (Vials, Ampoules, Cartridges, Syringes) End-user (Pharmaceutical manufacturers, Generic drug manufacturers, CROs and CDMOs, Others) Type (Borosilicate glass, Aluminosilicate glass)

AccuGlass LLC, Corning Inc., DWK Life Sciences GmbH, Gerresheimer AG, Glass Tube Vial, Hon Hai Glass, HX Pharma Pack, JYZY Glass, NBZ Pharmaceutical Packaging, Nippon Electric Glass Ltd., Nipro Corp., Richland Glass, SCHOTT AG, SGD Pharma, Shandong Linuo Pharma. Packaging, Shandong Pharma Glass Co. Ltd., Sise ve Cam Fabrikalari A.S., Taian Youlyy Industrial Co. Ltd., Triumph Junheng Bengbu Co. Ltd., ZC Pharma Pack are a few of the key vendors in the Pharmaceutical Glass Tubing market.

Asia will register the highest growth rate of 46.2% among the other regions. Therefore, the Pharmaceutical Glass Tubing market in Asia is expected to garner significant business opportunities for the vendors during the forecast period.

China, India, Japan, South Korea, Taiwan, Singapore, Germany, France, Italy, UK, Spain, The Netherlands, US, Canada, Mexico, Brazil, Saudi Arabia, UAE, South Africa, Argentina, Egypt, Israel, Chile

  • Expansion of global pharmaceutical industry and rise of injectable drugs is the driving factor this market.

The Pharmaceutical Glass Tubing market vendors should focus on grabbing business opportunities from the Application segment as it accounted for the largest market share in the base year.
RIA - Research AI Assistant
Ask RIA
