
Plastic Pipes Market Analysis, Size, and Forecast 2026-2030: APAC (China, India, and Japan), North America (US, Canada, and Mexico), Europe (Germany, UK, and France), Middle East and Africa (Saudi Arabia, UAE, and South Africa), South America (Brazil, Argentina, and Chile), and Rest of World (ROW)

Plastic Pipes Market Analysis, Size, and Forecast 2026-2030:
APAC (China, India, and Japan), North America (US, Canada, and Mexico), Europe (Germany, UK, and France), Middle East and Africa (Saudi Arabia, UAE, and South Africa), South America (Brazil, Argentina, and Chile), and Rest of World (ROW)

Published: Jul 2026 312 Pages SKU: IRTNTR80145

Market Overview at a Glance

$28.04 B
Market Opportunity
5.8%
CAGR 2025 - 2030
60.7%
APAC Growth
$32.08 B
Polyvinyl chloride segment 2024

Plastic Pipes Market Size 2026-2030

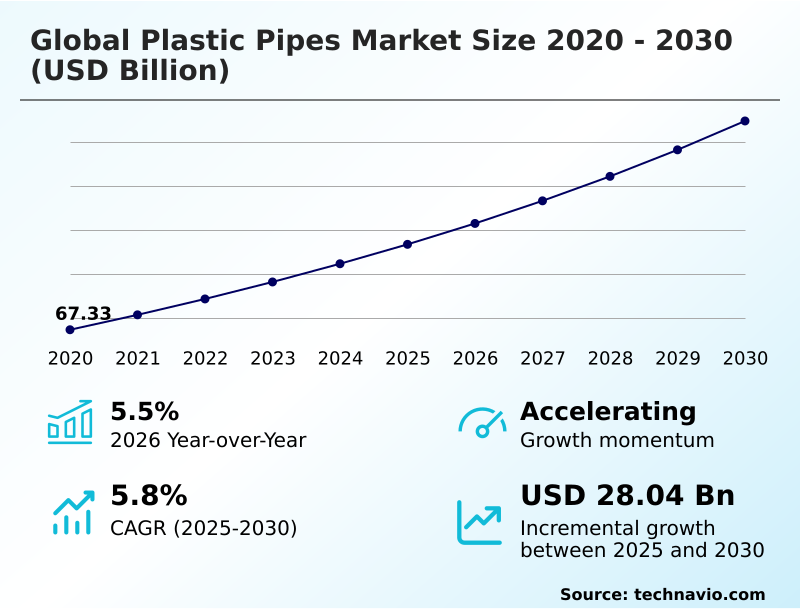
The plastic pipes market size is valued to increase by USD 28.04 billion, at a CAGR of 5.8% from 2025 to 2030. Rapid urbanization and global infrastructure investment will drive the plastic pipes market.

Major Market Trends & Insights

  • APAC dominated the market and accounted for a 60.7% growth during the forecast period.
  • By Material - Polyvinyl chloride segment was valued at USD 32.08 billion in 2024
  • By Application - Water supply and distribution segment accounted for the largest market revenue share in 2024

Market Size & Forecast

  • Market Opportunities: USD 47.45 billion
  • Market Future Opportunities: USD 28.04 billion
  • CAGR from 2025 to 2030 : 5.8%

Market Summary

  • The Plastic Pipes Market is characterized by a massive industrial transition toward highly durable, corrosion-resistant fluid transport systems. Rapid urbanization and extensive infrastructure modernization function as primary drivers, compelling municipalities to replace decaying metallic water mains to prevent catastrophic failures and service interruptions.
  • Conversely, manufacturers face persistent challenges stemming from the volatility of raw material pricing, as fluctuating petrochemical costs directly compress profit margins and disrupt long-term supply agreements. In a real-world supply chain optimization scenario, utility providers are increasingly specifying high-density polyethylene systems for natural gas distribution to eliminate the need for costly cathodic protection.
  • This strategic shift away from traditional materials has allowed contractors to lower project lifecycle maintenance expenses by 25% compared to legacy steel networks. These advanced thermoplastic solutions drastically reduce transportation logistics and simplify on-site handling through lightweight construction.
  • As agricultural operations implement sophisticated micro-irrigation systems to maximize crop yields, the reliance on resilient piping networks continues to expand across both developed and emerging economies.

What will be the Size of the Plastic Pipes Market during the forecast period?
Get Key Insights on Market Forecast (PDF) Get Free Sample

How is the Plastic Pipes Market Segmented?

The plastic pipes industry research report provides comprehensive data (region-wise segment analysis), with forecasts and estimates in "USD million" for the period 2026-2030, as well as historical data from 2020-2024 for the following segments.

  • Material
    • Polyvinyl chloride
    • Polyethylene
    • Polypropylene
    • Others
  • Application
    • Water supply and distribution
    • Sewage and drainage
    • Gas distribution
    • Agriculture
    • Others
  • Type
    • Smoothwalls
    • Corrugated
    • Structured wall
    • Multilayer
  • Geography
    • APAC
      • China
      • India
      • Japan
      • Indonesia
      • South Korea
      • Australia
    • North America
      • US
      • Canada
      • Mexico
    • Europe
      • Germany
      • UK
      • France
      • Italy
      • Spain
      • The Netherlands
    • Middle East and Africa
      • Saudi Arabia
      • UAE
      • South Africa
      • Turkey
      • Israel
    • South America
      • Brazil
      • Argentina
      • Chile

By Material Insights

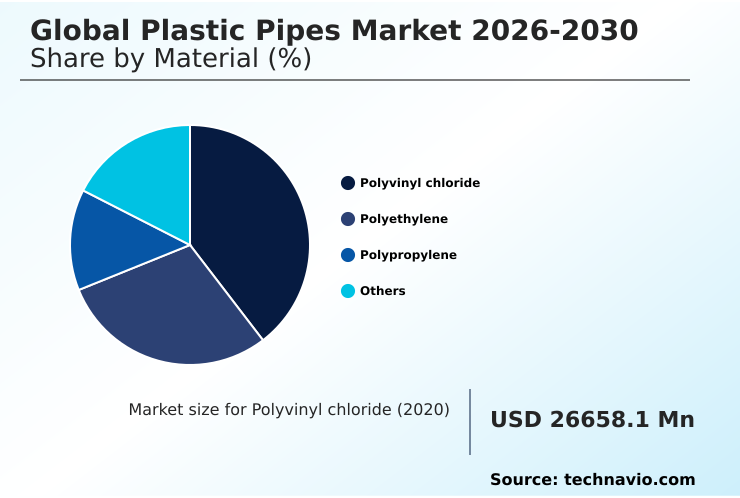
The polyvinyl chloride segment is estimated to witness significant growth during the forecast period.

The polyvinyl chloride segment anchors modern infrastructure development through highly engineered networks designed for rigorous water applications. Advanced engineering yields molecularly oriented structures that enhance tensile strength without adding bulk.

This evolution allows facilities to upgrade piping networks, resulting in fluid friction minimization and a 15% improvement in hydrodynamic flow efficiency compared to legacy metallic systems.

Modern polyvinyl chloride solutions employ a co-extruded multilayer design or cellular core construction to optimize material usage while maintaining strict hydrostatic pressure ratings. Formulations ensure high ultraviolet light stability and reliable chlorine degradation resistance.

Contractors rely on streamlined solvent cementing processes to secure leak-free connections, making these pipes essential for robust stormwater drainage systems and conduits lacking oxygen permeation barriers.
Get Free Sample

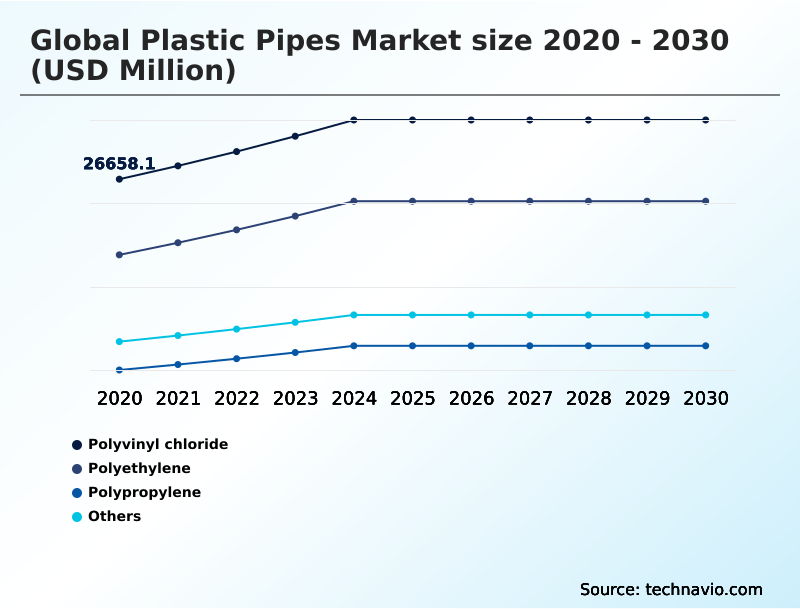
The Polyvinyl chloride segment was valued at USD 32.08 billion in 2024 and showed a gradual increase during the forecast period.
Get Free Sample

Regional Analysis

APAC is estimated to contribute 60.7% to the growth of the global market during the forecast period.Technavio’s analysts have elaborately explained the regional trends and drivers that shape the market during the forecast period.
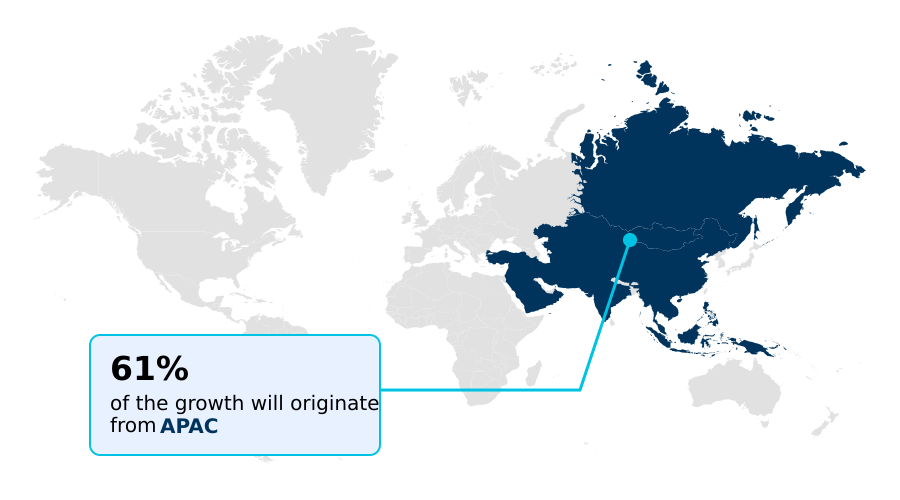
See How Plastic Pipes Market Demand is Rising in APAC Get Free Sample

Regional demand dynamics within the Plastic Pipes Market reveal stark contrasts in infrastructure strategies and technological adoption. APAC dominates consumption through aggressive urbanization, driving rapid installations of large-diameter networks that experience a 45% faster deployment rate than legacy systems.

In contrast, North America focuses primarily on the rehabilitation of aging grids, leading to a 35% higher adoption of trenchless replacement methods than emerging Asian markets.

The Japanese sector prioritizes seismic resilience engineering and soil movement flexibility, demanding advanced polymers that mitigate earthquake-induced ruptures. Meanwhile, European markets aggressively integrate closed-loop hydronic heating and cross-linked polyethylene barriers into modern buildings, driven by stringent energy efficiency directives.

Industrial centers requiring ultrapure water transport rely on specialized polypropylene random copolymer formulations that offer superior chemical resistance and extreme temperature tolerance.

These advanced materials support streamlined off-site manufacturing assembly, ultimately lowering subsurface drainage management costs by 20% and improving overall utility compliance.

Market Dynamics

Our researchers analyzed the data with 2025 as the base year, along with the key drivers, trends, and challenges. A holistic analysis of drivers will help companies refine their marketing strategies to gain a competitive advantage.

  • The evolution of the Plastic Pipes Market is fundamentally altering how municipalities and industrial complexes manage critical fluid transport infrastructure. Engineering focus has shifted toward materials that provide a high strength to weight ratio, allowing construction crews to handle massive pipeline segments without relying on excessively heavy lifting machinery.
  • This logistical advantage drastically accelerates project timelines and reduces the reliance on intensive manual labor. Urban centers are increasingly installing corrosion resistant large diameter mains to replace failing iron and concrete networks that historically suffered from severe degradation and catastrophic blowouts.
  • To ensure total system integrity and prevent the exfiltration of hazardous materials, engineers widely specify piping systems equipped with leak proof heat fused joints, creating seamless and monolithic conduits that outlast traditional gasketed alternatives. As sustainability mandates tighten globally, manufacturers are aggressively investing in advanced polymer recycling sorting technologies.
  • These innovations enable the efficient recovery of post-consumer resins, reintroducing high-quality recycled content into new structural wall pipes without compromising mechanical performance. This closed-loop approach reduces raw material procurement costs by up to 18% compared to relying entirely on virgin fossil-fuel feedstocks.
  • Furthermore, the integration of smart sensors into these piping networks forms the backbone of predictive maintenance for municipal utilities. By continuously monitoring pressure and flow dynamics, utility operators can pinpoint anomalies instantly, mitigating potential water losses and aligning infrastructure management with proactive compliance and operational planning strategies.
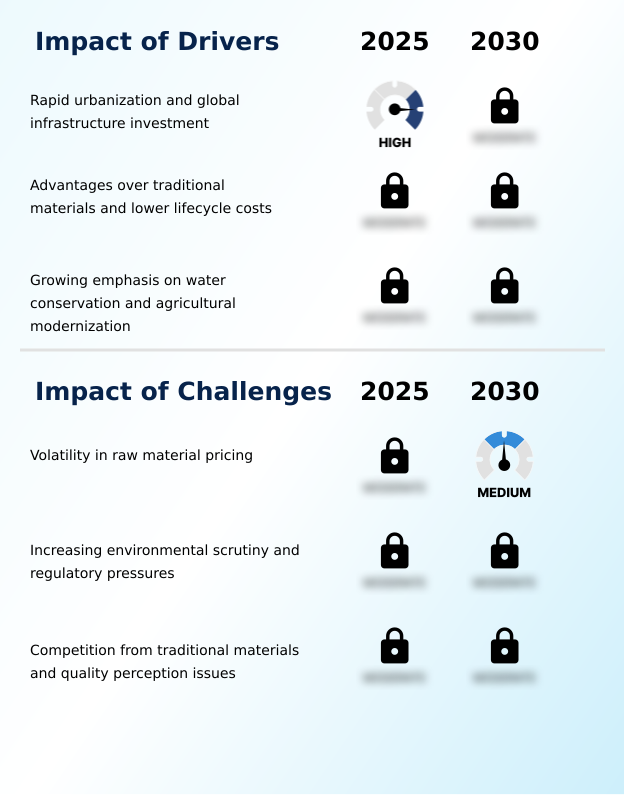
What are the key market drivers leading to the rise in the adoption of Plastic Pipes Industry?

  • Rapid urbanization and extensive global infrastructure investments are accelerating the demand for reliable water and wastewater networks.

  • Accelerating urban population density and the critical decay of legacy utility systems are the primary catalysts propelling the Plastic Pipes Market. Municipalities urgently require durable materials to overhaul failing municipal wastewater infrastructure and expand safe natural gas distribution.
  • Because engineered polymers offer complete electrochemical corrosion resistance, water authorities are aggressively replacing metallic lines, thereby extending asset lifespans and reducing unexpected network downtime by 35%.
  • To minimize disruptive and costly open-cut excavations, contractors widely adopt advanced trenchless installation techniques, which lower surface restoration expenditures by 25% during major trenchless rehabilitation projects.
  • Additionally, the global imperative for agricultural water conservation drives the massive deployment of precise micro-irrigation networks. Advancements in high-speed polyvinyl chloride extrusion facilitate hydraulic capacity optimization, ensuring cost-effective, high-volume fluid transport that enhances overall farming productivity.

What are the market trends shaping the Plastic Pipes Industry?

  • The industry is experiencing a significant shift toward sustainability and circular economy principles. This trend involves increasing the use of recycled materials and adopting eco-friendly manufacturing processes.

  • The Plastic Pipes Market is rapidly evolving as environmental mandates and digitalization fundamentally reshape utility network architectures. Regulatory pressure for circular economy compliance has driven manufacturers toward high-volume post-consumer resin integration and the exploration of bio-based polymer feedstocks for non-pressure applications. This transition directly supports corporate sustainability goals and lowers carbon footprints across the supply chain.
  • Simultaneously, the push for smart city interconnectivity compels the deployment of embedded pipeline integrity sensors and advanced acoustic signature monitoring within critical water mains. Because operators can now leverage predictive maintenance analytics and sophisticated leak detection algorithms, municipalities have achieved a 25% improvement in non-revenue water reduction compared to historically unmonitored systems.
  • By instantly identifying flow anomalies, these intelligent thermoplastic networks drastically minimize emergency repair costs by 18%, optimizing the long-term management of complex underground infrastructure.

What challenges does the Plastic Pipes Industry face during its growth?

  • The inherent volatility in essential raw material pricing severely disrupts manufacturing cost structures and long-term financial planning for industry participants.

  • Extreme volatility in global petrochemical pricing remains a formidable structural barrier within the Plastic Pipes Market. Because the production of advanced high-density polyethylene formulations and bimodal resin technology relies entirely on crude oil derivatives, sudden raw material cost spikes severely compress manufacturer profit margins.
  • This financial instability forces engineering firms to delay the specification of premium glass reinforced plastic and complex thermoplastic corrugated walls for large-scale industrial effluent management projects. Consequently, unpredictable material costs can inflate initial capital expenditures by over 15%, disrupting long-term municipal budgeting and stalling critical infrastructure upgrades.
  • Furthermore, ensuring strict potable water safety demands flawless execution of complex fusion jointing mechanisms in the field. When installation labor lacks specialized training, the resulting joint failures can increase operational remediation costs by 20%, hindering the reliable deployment of pressurized networks and telecommunications cable ducting.

Exclusive Technavio Analysis on Customer Landscape

The plastic pipes market forecasting report includes the adoption lifecycle of the market, covering from the innovator’s stage to the laggard’s stage. It focuses on adoption rates in different regions based on penetration. Furthermore, the plastic pipes market report also includes key purchase criteria and drivers of price sensitivity to help companies evaluate and develop their market growth analysis strategies.
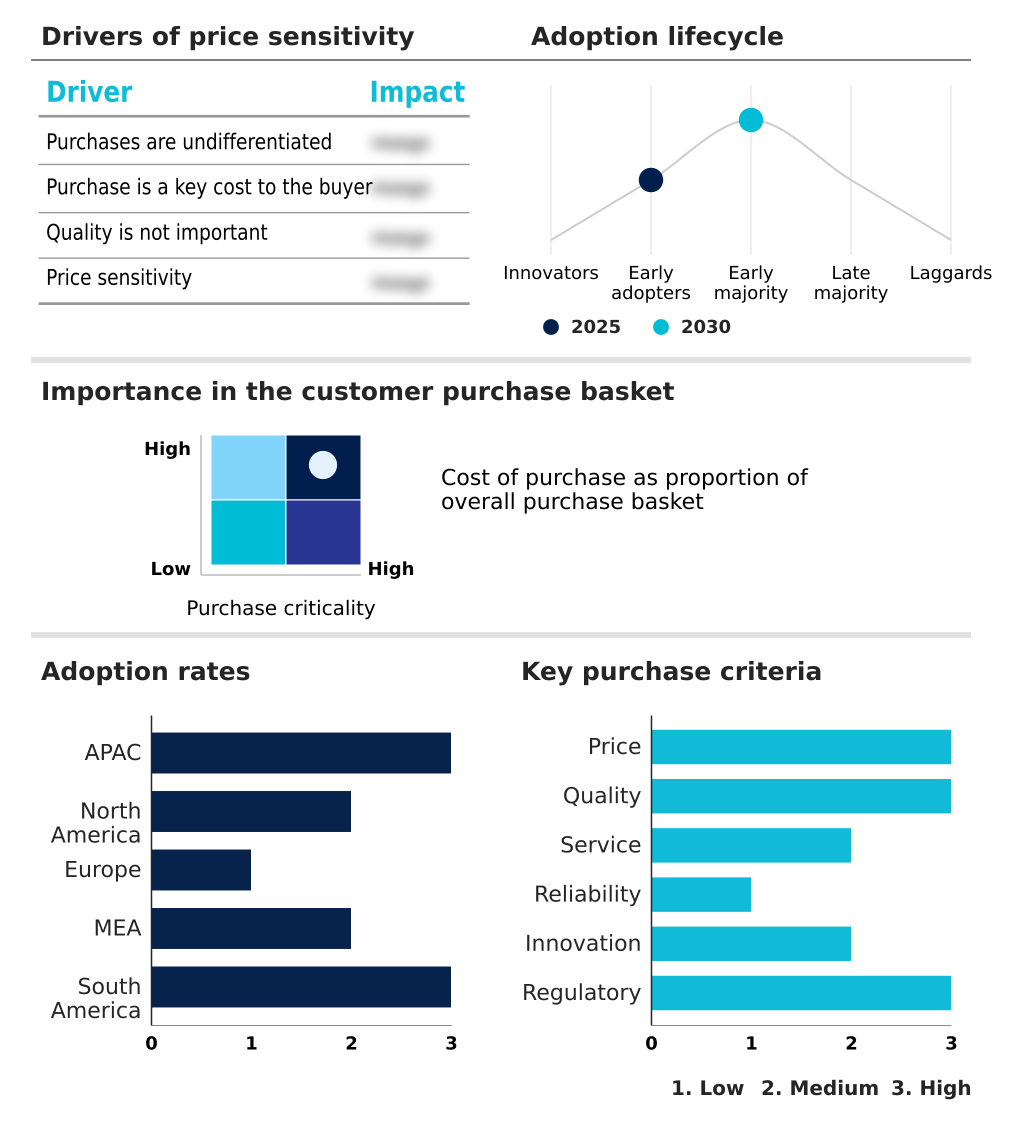
Customer Landscape of Plastic Pipes Industry

Competitive Landscape

Companies are implementing various strategies, such as strategic alliances, plastic pipes market forecast, partnerships, mergers and acquisitions, geographical expansion, and product/service launches, to enhance their presence in the industry.

Advanced Drainage Systems Inc - The company manufactures an extensive portfolio of advanced thermoplastic corrugated pipe and water management solutions, delivering critical infrastructure components for stormwater and wastewater applications across commercial sectors.

The industry research and growth report includes detailed analyses of the competitive landscape of the market and information about key companies, including:

  • Advanced Drainage Systems Inc
  • Aliaxis Holdings SA
  • Aquatherm LP
  • Astral Ltd.
  • China Lesso Group Holdings
  • Finolex Industries Ltd.
  • Genuit Group Plc
  • Georg Fischer Ltd.
  • Jain Irrigation Systems Ltd.
  • JM Eagle Inc.
  • Nan Ya Plastic Corp.
  • National Pipe and Plastics Inc.
  • Orbia
  • Pexgol
  • Plasson Industries Ltd.
  • Prince Pipes and Fittings Ltd.
  • Radius Systems Ltd.
  • Sekisui Chemical Co. Ltd.
  • The Supreme Industries Ltd.
  • Uponor Corp.

Qualitative and quantitative analysis of companies has been conducted to help clients understand the wider business environment as well as the strengths and weaknesses of key industry players. Data is qualitatively analyzed to categorize companies as pure play, category-focused, industry-focused, and diversified; it is quantitatively analyzed to categorize companies as dominant, leading, strong, tentative, and weak.

Recent Development and News in Plastic pipes market

  • In the Building Products industry, the widespread adoption of stringent environmental building codes has accelerated the integration of recycled materials into non-pressure infrastructure, directly impacting Plastic Pipes demand by increasing the specification of recycled high-density polyethylene for subsurface drainage management.
  • The structural shift toward smart city interconnectivity and intelligent water grids has required the deployment of embedded sensor technologies, driving manufacturers to develop advanced pipeline integrity sensors that achieve a 20% improvement in municipal leak detection accuracy.
  • Regulatory mandates targeting lead service line replacements in municipal water networks have created massive replacement cycles, expanding the market as utilities transition to electrochemical corrosion resistance materials to ensure long-term potable water safety.
  • Advancements in trenchless rehabilitation techniques have transformed underground utility installations, propelling the sector by utilizing highly flexible thermoplastic corrugated walls that reduce surface disruption costs by up to 30% compared to traditional open-cut excavation methods.

Dive into Technavio’s robust research methodology, blending expert interviews, extensive data synthesis, and validated models for unparalleled Plastic Pipes Market insights. See full methodology.

Market Scope
Page number 312
Base year 2025
Historic period 2020-2024
Forecast period 2026-2030
Growth momentum & CAGR Accelerate at a CAGR of 5.8%
Market growth 2026-2030 USD 28043.7 million
Market structure Fragmented
YoY growth 2025-2026(%) 5.5%
Key countries China, India, Japan, Indonesia, South Korea, Australia, US, Canada, Mexico, Germany, UK, France, Italy, Spain, The Netherlands, Saudi Arabia, UAE, South Africa, Turkey, Israel, Brazil, Argentina and Chile
Competitive landscape Leading Companies, Market Positioning of Companies, Competitive Strategies, and Industry Risks

Request Free Sample

Research Analyst Overview

  • The Plastic Pipes Market is currently undergoing a structural transformation driven by the critical necessity for resilient and sustainable fluid transport infrastructure. Increasing regulatory pressure regarding water conservation and non-revenue water loss forces municipalities to pivot away from degradation-prone legacy materials.
  • By transitioning to highly engineered thermoplastic networks, urban utility operators have realized a 30% reduction in pipeline maintenance interventions compared to metallic alternatives. This shift strongly influences boardroom-level budgeting, as the lower total cost of ownership allows for reallocation of capital toward proactive network expansion.
  • The industrial adoption of advanced leak detection algorithms and acoustic signature monitoring further refines asset management, shifting strategies from reactive repairs to predictive maintenance. Facilities require robust solutions like bio-based polymer feedstocks and post-consumer resin integration to satisfy aggressive corporate sustainability compliance targets. The ability to deploy lightweight, highly durable conduits using trenchless technology minimizes logistical overhead and surface disruption.
  • Consequently, specialized polymer configurations are becoming the absolute standard for everything from micro-irrigation networks to complex industrial effluent management, securing long-term operational continuity.

What are the Key Data Covered in this Plastic Pipes Market Research and Growth Report?

  • What is the expected growth of the Plastic Pipes Market between 2026 and 2030?

    • USD 28.04 billion, at a CAGR of 5.8%

  • What segmentation does the market report cover?

    • The report is segmented by Material (Polyvinyl chloride, Polyethylene, Polypropylene, and Others), Application (Water supply and distribution, Sewage and drainage, Gas distribution, Agriculture, and Others), Type (Smoothwalls, Corrugated, Structured wall, and Multilayer) and Geography (APAC, North America, Europe, Middle East and Africa, South America)

  • Which regions are analyzed in the report?

    • APAC, North America, Europe, Middle East and Africa and South America

  • What are the key growth drivers and market challenges?

    • Rapid urbanization and global infrastructure investment, Volatility in raw material pricing

  • Who are the major players in the Plastic Pipes Market?

    • Advanced Drainage Systems Inc, Aliaxis Holdings SA, Aquatherm LP, Astral Ltd., China Lesso Group Holdings, Finolex Industries Ltd., Genuit Group Plc, Georg Fischer Ltd., Jain Irrigation Systems Ltd., JM Eagle Inc., Nan Ya Plastic Corp., National Pipe and Plastics Inc., Orbia, Pexgol, Plasson Industries Ltd., Prince Pipes and Fittings Ltd., Radius Systems Ltd., Sekisui Chemical Co. Ltd., The Supreme Industries Ltd. and Uponor Corp.

Market Research Insights

  • The Plastic Pipes Market operates at the intersection of infrastructure modernization and advanced material science. Industrial facilities and municipal utilities are rapidly transitioning toward thermoplastic solutions to secure superior electrochemical corrosion resistance. By integrating advanced pipeline integrity sensors and acoustic signature monitoring, operators have achieved a 30% reduction in non-revenue water loss compared to unmonitored networks.
  • Furthermore, the adoption of trenchless installation techniques lowers surface excavation expenditures by nearly 40%, optimizing project budgets and accelerating deployment timelines. This shift enhances operational planning, allowing utilities to leverage predictive maintenance analytics to foresee potential pipe failures.
  • As manufacturers optimize polyvinyl chloride extrusion processes to meet stringent building codes, the industry continues to deliver measurable improvements in fluid friction minimization and long-term asset reliability.

We can help! Our analysts can customize this plastic pipes market research report to meet your requirements.

Get in touch

1. Executive Summary

1.1 Market overview

Executive Summary - Chart on Market Overview
Executive Summary - Data Table on Market Overview
Executive Summary - Chart on Global Market Characteristics
Executive Summary - Chart on Market by Geography
Executive Summary - Chart on Market Segmentation by Material
Executive Summary - Chart on Market Segmentation by Application
Executive Summary - Chart on Market Segmentation by Type
Executive Summary - Chart on Incremental Growth
Executive Summary - Data Table on Incremental Growth
Executive Summary - Chart on Company Market Positioning

2. Technavio Analysis

2.1 Analysis of price sensitivity, lifecycle, customer purchase basket, adoption rates, and purchase criteria

2.2 Criticality of inputs and Factors of differentiation

Chart on Overview on criticality of inputs and factors of differentiation

2.3 Factors of disruption

Chart on Overview on factors of disruption

2.4 Impact of drivers and challenges

Chart on Impact of drivers and challenges in 2025 and 2030

3. Market Landscape

3.1 Market ecosystem

Chart on Parent Market
Data Table on - Parent Market

3.2 Market characteristics

Chart on Market characteristics analysis

3.3 Value chain analysis

Chart on Value chain analysis

4. Market Sizing

4.1 Market definition

Data Table on Offerings of companies included in the market definition

4.2 Market segment analysis

Market segments

4.3 Market size 2025

4.4 Market outlook: Forecast for 2025-2030

Chart on Global - Market size and forecast 2025-2030 ($ million)
Data Table on Global - Market size and forecast 2025-2030 ($ million)
Chart on Global Market: Year-over-year growth 2025-2030 (%)
Data Table on Global Market: Year-over-year growth 2025-2030 (%)

5. Historic Market Size

5.1 Global Plastic Pipes Market 2020 - 2024

Historic Market Size - Data Table on Global Plastic Pipes Market 2020 - 2024 ($ million)

5.2 Material segment analysis 2020 - 2024

Historic Market Size - Material Segment 2020 - 2024 ($ million)

5.3 Application segment analysis 2020 - 2024

Historic Market Size - Application Segment 2020 - 2024 ($ million)

5.4 Type segment analysis 2020 - 2024

Historic Market Size - Type Segment 2020 - 2024 ($ million)

5.5 Geography segment analysis 2020 - 2024

Historic Market Size - Geography Segment 2020 - 2024 ($ million)

5.6 Country segment analysis 2020 - 2024

Historic Market Size - Country Segment 2020 - 2024 ($ million)

6. Qualitative Analysis

6.1 Impact of AI on Global Plastic Pipes Market

6.2 Impact of Geopolitical Conflicts on Global Plastic Pipes Market

7. Five Forces Analysis

7.1 Five forces summary

Five forces analysis - Comparison between 2025 and 2030

7.2 Bargaining power of buyers

Bargaining power of buyers - Impact of key factors 2025 and 2030

7.3 Bargaining power of suppliers

Bargaining power of suppliers - Impact of key factors in 2025 and 2030

7.4 Threat of new entrants

Threat of new entrants - Impact of key factors in 2025 and 2030

7.5 Threat of substitutes

Threat of substitutes - Impact of key factors in 2025 and 2030

7.6 Threat of rivalry

Threat of rivalry - Impact of key factors in 2025 and 2030

7.7 Market condition

Chart on Market condition - Five forces 2025 and 2030

8. Market Segmentation by Material

8.1 Market segments

Chart on Material - Market share 2025-2030 (%)
Data Table on Material - Market share 2025-2030 (%)

8.2 Comparison by Material

Chart on Comparison by Material
Data Table on Comparison by Material

8.3 Polyvinyl chloride - Market size and forecast 2025-2030

Chart on Polyvinyl chloride - Market size and forecast 2025-2030 ($ million)
Data Table on Polyvinyl chloride - Market size and forecast 2025-2030 ($ million)
Chart on Polyvinyl chloride - Year-over-year growth 2025-2030 (%)
Data Table on Polyvinyl chloride - Year-over-year growth 2025-2030 (%)

8.4 Polyethylene - Market size and forecast 2025-2030

Chart on Polyethylene - Market size and forecast 2025-2030 ($ million)
Data Table on Polyethylene - Market size and forecast 2025-2030 ($ million)
Chart on Polyethylene - Year-over-year growth 2025-2030 (%)
Data Table on Polyethylene - Year-over-year growth 2025-2030 (%)

8.5 Polypropylene - Market size and forecast 2025-2030

Chart on Polypropylene - Market size and forecast 2025-2030 ($ million)
Data Table on Polypropylene - Market size and forecast 2025-2030 ($ million)
Chart on Polypropylene - Year-over-year growth 2025-2030 (%)
Data Table on Polypropylene - Year-over-year growth 2025-2030 (%)

8.6 Others - Market size and forecast 2025-2030

Chart on Others - Market size and forecast 2025-2030 ($ million)
Data Table on Others - Market size and forecast 2025-2030 ($ million)
Chart on Others - Year-over-year growth 2025-2030 (%)
Data Table on Others - Year-over-year growth 2025-2030 (%)

8.7 Market opportunity by Material

Market opportunity by Material ($ million)
Data Table on Market opportunity by Material ($ million)

9. Market Segmentation by Application

9.1 Market segments

Chart on Application - Market share 2025-2030 (%)
Data Table on Application - Market share 2025-2030 (%)

9.2 Comparison by Application

Chart on Comparison by Application
Data Table on Comparison by Application

9.3 Water supply and distribution - Market size and forecast 2025-2030

Chart on Water supply and distribution - Market size and forecast 2025-2030 ($ million)
Data Table on Water supply and distribution - Market size and forecast 2025-2030 ($ million)
Chart on Water supply and distribution - Year-over-year growth 2025-2030 (%)
Data Table on Water supply and distribution - Year-over-year growth 2025-2030 (%)

9.4 Sewage and drainage - Market size and forecast 2025-2030

Chart on Sewage and drainage - Market size and forecast 2025-2030 ($ million)
Data Table on Sewage and drainage - Market size and forecast 2025-2030 ($ million)
Chart on Sewage and drainage - Year-over-year growth 2025-2030 (%)
Data Table on Sewage and drainage - Year-over-year growth 2025-2030 (%)

9.5 Gas distribution - Market size and forecast 2025-2030

Chart on Gas distribution - Market size and forecast 2025-2030 ($ million)
Data Table on Gas distribution - Market size and forecast 2025-2030 ($ million)
Chart on Gas distribution - Year-over-year growth 2025-2030 (%)
Data Table on Gas distribution - Year-over-year growth 2025-2030 (%)

9.6 Agriculture - Market size and forecast 2025-2030

Chart on Agriculture - Market size and forecast 2025-2030 ($ million)
Data Table on Agriculture - Market size and forecast 2025-2030 ($ million)
Chart on Agriculture - Year-over-year growth 2025-2030 (%)
Data Table on Agriculture - Year-over-year growth 2025-2030 (%)

9.7 Others - Market size and forecast 2025-2030

Chart on Others - Market size and forecast 2025-2030 ($ million)
Data Table on Others - Market size and forecast 2025-2030 ($ million)
Chart on Others - Year-over-year growth 2025-2030 (%)
Data Table on Others - Year-over-year growth 2025-2030 (%)

9.8 Market opportunity by Application

Market opportunity by Application ($ million)
Data Table on Market opportunity by Application ($ million)

10. Market Segmentation by Type

10.1 Market segments

Chart on Type - Market share 2025-2030 (%)
Data Table on Type - Market share 2025-2030 (%)

10.2 Comparison by Type

Chart on Comparison by Type
Data Table on Comparison by Type

10.3 Smoothwalls - Market size and forecast 2025-2030

Chart on Smoothwalls - Market size and forecast 2025-2030 ($ million)
Data Table on Smoothwalls - Market size and forecast 2025-2030 ($ million)
Chart on Smoothwalls - Year-over-year growth 2025-2030 (%)
Data Table on Smoothwalls - Year-over-year growth 2025-2030 (%)

10.4 Corrugated - Market size and forecast 2025-2030

Chart on Corrugated - Market size and forecast 2025-2030 ($ million)
Data Table on Corrugated - Market size and forecast 2025-2030 ($ million)
Chart on Corrugated - Year-over-year growth 2025-2030 (%)
Data Table on Corrugated - Year-over-year growth 2025-2030 (%)

10.5 Structured wall - Market size and forecast 2025-2030

Chart on Structured wall - Market size and forecast 2025-2030 ($ million)
Data Table on Structured wall - Market size and forecast 2025-2030 ($ million)
Chart on Structured wall - Year-over-year growth 2025-2030 (%)
Data Table on Structured wall - Year-over-year growth 2025-2030 (%)

10.6 Multilayer - Market size and forecast 2025-2030

Chart on Multilayer - Market size and forecast 2025-2030 ($ million)
Data Table on Multilayer - Market size and forecast 2025-2030 ($ million)
Chart on Multilayer - Year-over-year growth 2025-2030 (%)
Data Table on Multilayer - Year-over-year growth 2025-2030 (%)

10.7 Market opportunity by Type

Market opportunity by Type ($ million)
Data Table on Market opportunity by Type ($ million)

11. Customer Landscape

11.1 Customer landscape overview

Analysis of price sensitivity, lifecycle, customer purchase basket, adoption rates, and purchase criteria

12. Geographic Landscape

12.1 Geographic segmentation

Chart on Market share by geography 2025-2030 (%)
Data Table on Market share by geography 2025-2030 (%)

12.2 Geographic comparison

Chart on Geographic comparison
Data Table on Geographic comparison

12.3 APAC - Market size and forecast 2025-2030

Chart on APAC - Market size and forecast 2025-2030 ($ million)
Data Table on APAC - Market size and forecast 2025-2030 ($ million)
Chart on APAC - Year-over-year growth 2025-2030 (%)
Data Table on APAC - Year-over-year growth 2025-2030 (%)
Chart on Regional Comparison - APAC
Data Table on Regional Comparison - APAC

12.3.1 China - Market size and forecast 2025-2030

Chart on China - Market size and forecast 2025-2030 ($ million)
Data Table on China - Market size and forecast 2025-2030 ($ million)
Chart on China - Year-over-year growth 2025-2030 (%)
Data Table on China - Year-over-year growth 2025-2030 (%)

12.3.2 India - Market size and forecast 2025-2030

Chart on India - Market size and forecast 2025-2030 ($ million)
Data Table on India - Market size and forecast 2025-2030 ($ million)
Chart on India - Year-over-year growth 2025-2030 (%)
Data Table on India - Year-over-year growth 2025-2030 (%)

12.3.3 Japan - Market size and forecast 2025-2030

Chart on Japan - Market size and forecast 2025-2030 ($ million)
Data Table on Japan - Market size and forecast 2025-2030 ($ million)
Chart on Japan - Year-over-year growth 2025-2030 (%)
Data Table on Japan - Year-over-year growth 2025-2030 (%)

12.3.4 Indonesia - Market size and forecast 2025-2030

Chart on Indonesia - Market size and forecast 2025-2030 ($ million)
Data Table on Indonesia - Market size and forecast 2025-2030 ($ million)
Chart on Indonesia - Year-over-year growth 2025-2030 (%)
Data Table on Indonesia - Year-over-year growth 2025-2030 (%)

12.3.5 South Korea - Market size and forecast 2025-2030

Chart on South Korea - Market size and forecast 2025-2030 ($ million)
Data Table on South Korea - Market size and forecast 2025-2030 ($ million)
Chart on South Korea - Year-over-year growth 2025-2030 (%)
Data Table on South Korea - Year-over-year growth 2025-2030 (%)

12.3.6 Australia - Market size and forecast 2025-2030

Chart on Australia - Market size and forecast 2025-2030 ($ million)
Data Table on Australia - Market size and forecast 2025-2030 ($ million)
Chart on Australia - Year-over-year growth 2025-2030 (%)
Data Table on Australia - Year-over-year growth 2025-2030 (%)

12.4 North America - Market size and forecast 2025-2030

Chart on North America - Market size and forecast 2025-2030 ($ million)
Data Table on North America - Market size and forecast 2025-2030 ($ million)
Chart on North America - Year-over-year growth 2025-2030 (%)
Data Table on North America - Year-over-year growth 2025-2030 (%)
Chart on Regional Comparison - North America
Data Table on Regional Comparison - North America

12.4.1 US - Market size and forecast 2025-2030

Chart on US - Market size and forecast 2025-2030 ($ million)
Data Table on US - Market size and forecast 2025-2030 ($ million)
Chart on US - Year-over-year growth 2025-2030 (%)
Data Table on US - Year-over-year growth 2025-2030 (%)

12.4.2 Canada - Market size and forecast 2025-2030

Chart on Canada - Market size and forecast 2025-2030 ($ million)
Data Table on Canada - Market size and forecast 2025-2030 ($ million)
Chart on Canada - Year-over-year growth 2025-2030 (%)
Data Table on Canada - Year-over-year growth 2025-2030 (%)

12.4.3 Mexico - Market size and forecast 2025-2030

Chart on Mexico - Market size and forecast 2025-2030 ($ million)
Data Table on Mexico - Market size and forecast 2025-2030 ($ million)
Chart on Mexico - Year-over-year growth 2025-2030 (%)
Data Table on Mexico - Year-over-year growth 2025-2030 (%)

12.5 Europe - Market size and forecast 2025-2030

Chart on Europe - Market size and forecast 2025-2030 ($ million)
Data Table on Europe - Market size and forecast 2025-2030 ($ million)
Chart on Europe - Year-over-year growth 2025-2030 (%)
Data Table on Europe - Year-over-year growth 2025-2030 (%)
Chart on Regional Comparison - Europe
Data Table on Regional Comparison - Europe

12.5.1 Germany - Market size and forecast 2025-2030

Chart on Germany - Market size and forecast 2025-2030 ($ million)
Data Table on Germany - Market size and forecast 2025-2030 ($ million)
Chart on Germany - Year-over-year growth 2025-2030 (%)
Data Table on Germany - Year-over-year growth 2025-2030 (%)

12.5.2 UK - Market size and forecast 2025-2030

Chart on UK - Market size and forecast 2025-2030 ($ million)
Data Table on UK - Market size and forecast 2025-2030 ($ million)
Chart on UK - Year-over-year growth 2025-2030 (%)
Data Table on UK - Year-over-year growth 2025-2030 (%)

12.5.3 France - Market size and forecast 2025-2030

Chart on France - Market size and forecast 2025-2030 ($ million)
Data Table on France - Market size and forecast 2025-2030 ($ million)
Chart on France - Year-over-year growth 2025-2030 (%)
Data Table on France - Year-over-year growth 2025-2030 (%)

12.5.4 Italy - Market size and forecast 2025-2030

Chart on Italy - Market size and forecast 2025-2030 ($ million)
Data Table on Italy - Market size and forecast 2025-2030 ($ million)
Chart on Italy - Year-over-year growth 2025-2030 (%)
Data Table on Italy - Year-over-year growth 2025-2030 (%)

12.5.5 Spain - Market size and forecast 2025-2030

Chart on Spain - Market size and forecast 2025-2030 ($ million)
Data Table on Spain - Market size and forecast 2025-2030 ($ million)
Chart on Spain - Year-over-year growth 2025-2030 (%)
Data Table on Spain - Year-over-year growth 2025-2030 (%)

12.5.6 The Netherlands - Market size and forecast 2025-2030

Chart on The Netherlands - Market size and forecast 2025-2030 ($ million)
Data Table on The Netherlands - Market size and forecast 2025-2030 ($ million)
Chart on The Netherlands - Year-over-year growth 2025-2030 (%)
Data Table on The Netherlands - Year-over-year growth 2025-2030 (%)

12.6 Middle East and Africa - Market size and forecast 2025-2030

Chart on Middle East and Africa - Market size and forecast 2025-2030 ($ million)
Data Table on Middle East and Africa - Market size and forecast 2025-2030 ($ million)
Chart on Middle East and Africa - Year-over-year growth 2025-2030 (%)
Data Table on Middle East and Africa - Year-over-year growth 2025-2030 (%)
Chart on Regional Comparison - Middle East and Africa
Data Table on Regional Comparison - Middle East and Africa

12.6.1 Saudi Arabia - Market size and forecast 2025-2030

Chart on Saudi Arabia - Market size and forecast 2025-2030 ($ million)
Data Table on Saudi Arabia - Market size and forecast 2025-2030 ($ million)
Chart on Saudi Arabia - Year-over-year growth 2025-2030 (%)
Data Table on Saudi Arabia - Year-over-year growth 2025-2030 (%)

12.6.2 UAE - Market size and forecast 2025-2030

Chart on UAE - Market size and forecast 2025-2030 ($ million)
Data Table on UAE - Market size and forecast 2025-2030 ($ million)
Chart on UAE - Year-over-year growth 2025-2030 (%)
Data Table on UAE - Year-over-year growth 2025-2030 (%)

12.6.3 South Africa - Market size and forecast 2025-2030

Chart on South Africa - Market size and forecast 2025-2030 ($ million)
Data Table on South Africa - Market size and forecast 2025-2030 ($ million)
Chart on South Africa - Year-over-year growth 2025-2030 (%)
Data Table on South Africa - Year-over-year growth 2025-2030 (%)

12.6.4 Turkey - Market size and forecast 2025-2030

Chart on Turkey - Market size and forecast 2025-2030 ($ million)
Data Table on Turkey - Market size and forecast 2025-2030 ($ million)
Chart on Turkey - Year-over-year growth 2025-2030 (%)
Data Table on Turkey - Year-over-year growth 2025-2030 (%)

12.6.5 Israel - Market size and forecast 2025-2030

Chart on Israel - Market size and forecast 2025-2030 ($ million)
Data Table on Israel - Market size and forecast 2025-2030 ($ million)
Chart on Israel - Year-over-year growth 2025-2030 (%)
Data Table on Israel - Year-over-year growth 2025-2030 (%)

12.7 South America - Market size and forecast 2025-2030

Chart on South America - Market size and forecast 2025-2030 ($ million)
Data Table on South America - Market size and forecast 2025-2030 ($ million)
Chart on South America - Year-over-year growth 2025-2030 (%)
Data Table on South America - Year-over-year growth 2025-2030 (%)
Chart on Regional Comparison - South America
Data Table on Regional Comparison - South America

12.7.1 Brazil - Market size and forecast 2025-2030

Chart on Brazil - Market size and forecast 2025-2030 ($ million)
Data Table on Brazil - Market size and forecast 2025-2030 ($ million)
Chart on Brazil - Year-over-year growth 2025-2030 (%)
Data Table on Brazil - Year-over-year growth 2025-2030 (%)

12.7.2 Argentina - Market size and forecast 2025-2030

Chart on Argentina - Market size and forecast 2025-2030 ($ million)
Data Table on Argentina - Market size and forecast 2025-2030 ($ million)
Chart on Argentina - Year-over-year growth 2025-2030 (%)
Data Table on Argentina - Year-over-year growth 2025-2030 (%)

12.7.3 Chile - Market size and forecast 2025-2030

Chart on Chile - Market size and forecast 2025-2030 ($ million)
Data Table on Chile - Market size and forecast 2025-2030 ($ million)
Chart on Chile - Year-over-year growth 2025-2030 (%)
Data Table on Chile - Year-over-year growth 2025-2030 (%)

12.8 Market opportunity by geography

Market opportunity by geography ($ million)
Data Tables on Market opportunity by geography ($ million)

13. Drivers, Challenges, and Opportunity

13.1 Market drivers

Rapid urbanization and global infrastructure investment
Advantages over traditional materials and lower lifecycle costs
Growing emphasis on water conservation and agricultural modernization

13.2 Market challenges

Volatility in raw material pricing
Increasing environmental scrutiny and regulatory pressures
Competition from traditional materials and quality perception issues

13.3 Impact of drivers and challenges

Impact of drivers and challenges in 2025 and 2030

13.4 Market opportunities

Increasing focus on sustainability and circular economy principles
Integration of smart technologies and digitalization
Advancement in material science and rise of composite pipes

14. Competitive Landscape

14.1 Overview

14.2

Overview on criticality of inputs and factors of differentiation

14.3 Landscape disruption

Overview on factors of disruption

14.4 Industry risks

Impact of key risks on business

15. Competitive Analysis

15.1 Companies profiled

Companies covered

15.2 Company ranking index

15.3 Market positioning of companies

Matrix on companies position and classification

15.4 Advanced Drainage Systems Inc

Advanced Drainage Systems Inc - Overview
Advanced Drainage Systems Inc - Business segments
Advanced Drainage Systems Inc - Key offerings
Advanced Drainage Systems Inc - Segment focus
SWOT

15.5 Aliaxis Holdings SA

Aliaxis Holdings SA - Overview
Aliaxis Holdings SA - Product / Service
Aliaxis Holdings SA - Key offerings
SWOT

15.6 Aquatherm LP

Aquatherm LP - Overview
Aquatherm LP - Product / Service
Aquatherm LP - Key offerings
SWOT

15.7 Astral Ltd.

Astral Ltd. - Overview
Astral Ltd. - Business segments
Astral Ltd. - Key offerings
Astral Ltd. - Segment focus
SWOT

15.8 China Lesso Group Holdings

China Lesso Group Holdings - Overview
China Lesso Group Holdings - Business segments
China Lesso Group Holdings - Key offerings
China Lesso Group Holdings - Segment focus
SWOT

15.9 Finolex Industries Ltd.

Finolex Industries Ltd. - Overview
Finolex Industries Ltd. - Business segments
Finolex Industries Ltd. - Key offerings
Finolex Industries Ltd. - Segment focus
SWOT

15.10 Genuit Group Plc

Genuit Group Plc - Overview
Genuit Group Plc - Business segments
Genuit Group Plc - Key offerings
Genuit Group Plc - Segment focus
SWOT

15.11 Georg Fischer Ltd.

Georg Fischer Ltd. - Overview
Georg Fischer Ltd. - Business segments
Georg Fischer Ltd. - Key offerings
Georg Fischer Ltd. - Segment focus
SWOT

15.12 Jain Irrigation Systems Ltd.

Jain Irrigation Systems Ltd. - Overview
Jain Irrigation Systems Ltd. - Business segments
Jain Irrigation Systems Ltd. - Key offerings
Jain Irrigation Systems Ltd. - Segment focus
SWOT

15.13 JM Eagle Inc.

JM Eagle Inc. - Overview
JM Eagle Inc. - Product / Service
JM Eagle Inc. - Key offerings
SWOT

15.14 Nan Ya Plastic Corp.

Nan Ya Plastic Corp. - Overview
Nan Ya Plastic Corp. - Business segments
Nan Ya Plastic Corp. - Key offerings
Nan Ya Plastic Corp. - Segment focus
SWOT

15.15 National Pipe and Plastics Inc.

National Pipe and Plastics Inc. - Overview
National Pipe and Plastics Inc. - Product / Service
National Pipe and Plastics Inc. - Key offerings
SWOT

15.16 Orbia

Orbia - Overview
Orbia - Business segments
Orbia - Key offerings
Orbia - Segment focus
SWOT

15.17 Pexgol

Pexgol - Overview
Pexgol - Product / Service
Pexgol - Key offerings
SWOT

15.18 Plasson Industries Ltd.

Plasson Industries Ltd. - Overview
Plasson Industries Ltd. - Business segments
Plasson Industries Ltd. - Key offerings
Plasson Industries Ltd. - Segment focus
SWOT

16. Appendix

16.1 Scope of the report

Market definition
Objectives
Notes and caveats

16.2 Inclusions and exclusions checklist

Inclusions checklist
Exclusions checklist

16.3 Currency conversion rates for US$

16.4 Research methodology

16.5 Data procurement

Information sources

16.6 Data validation

16.7 Validation techniques employed for market sizing

16.8 Data synthesis

16.9 360 degree market analysis

16.10 List of abbreviations

Research Methodology

Technavio presents a detailed picture of the market by way of study, synthesis, and summation of data from multiple sources. The analysts have presented the various facets of the market with a particular focus on identifying the key industry influencers. The data thus presented is comprehensive, reliable, and the result of extensive research, both primary and secondary.

INFORMATION SOURCES

Primary sources

  • Manufacturers and suppliers
  • Channel partners
  • Industry experts
  • Strategic decision makers

Secondary sources

  • Industry journals and periodicals
  • Government data
  • Financial reports of key industry players
  • Historical data
  • Press releases

DATA ANALYSIS

Data Synthesis

  • Collation of data
  • Estimation of key figures
  • Analysis of derived insights

Data Validation

  • Triangulation with data models
  • Reference against proprietary databases
  • Corroboration with industry experts

REPORT WRITING

Qualitative

  • Market drivers
  • Market challenges
  • Market trends
  • Five forces analysis

Quantitative

  • Market size and forecast
  • Market segmentation
  • Geographical insights
  • Competitive landscape

Interested in this report?

Get your sample now to see our research methodology and insights!

Download Now

Frequently Asked Questions

Plastic Pipes market growth will increase by USD 28043.7 million during 2026-2030.

The Plastic Pipes market is expected to grow at a CAGR of 5.8% during 2026-2030.

Plastic Pipes market is segmented by Material (Polyvinyl chloride, Polyethylene, Polypropylene, Others) Application (Water supply and distribution, Sewage and drainage, Gas distribution, Agriculture, Others) Type (Smoothwalls, Corrugated, Structured wall, Multilayer)

Advanced Drainage Systems Inc, Aliaxis Holdings SA, Aquatherm LP, Astral Ltd., China Lesso Group Holdings, Finolex Industries Ltd., Genuit Group Plc, Georg Fischer Ltd., Jain Irrigation Systems Ltd., JM Eagle Inc., Nan Ya Plastic Corp., National Pipe and Plastics Inc., Orbia, Pexgol, Plasson Industries Ltd., Prince Pipes and Fittings Ltd., Radius Systems Ltd., Sekisui Chemical Co. Ltd., The Supreme Industries Ltd., Uponor Corp. are a few of the key vendors in the Plastic Pipes market.

APAC will register the highest growth rate of 60.7% among the other regions. Therefore, the Plastic Pipes market in APAC is expected to garner significant business opportunities for the vendors during the forecast period.

China, India, Japan, Indonesia, South Korea, Australia, US, Canada, Mexico, Germany, UK, France, Italy, Spain, The Netherlands, Saudi Arabia, UAE, South Africa, Turkey, Israel, Brazil, Argentina, Chile

  • Rapid urbanization and global infrastructure investment is the driving factor this market.

The Plastic Pipes market vendors should focus on grabbing business opportunities from the Material segment as it accounted for the largest market share in the base year.
RIA - Research AI Assistant
Ask RIA
