
Polyethylene (PE) Foam Market Analysis, Size, and Forecast 2026-2030: APAC (China, Japan, and India), North America (US, Canada, and Mexico), Europe (Germany, UK, and France), Middle East and Africa (Saudi Arabia, Turkey, and UAE), South America (Brazil, Argentina, and Chile), and Rest of World (ROW)

Polyethylene (PE) Foam Market Analysis, Size, and Forecast 2026-2030:
APAC (China, Japan, and India), North America (US, Canada, and Mexico), Europe (Germany, UK, and France), Middle East and Africa (Saudi Arabia, Turkey, and UAE), South America (Brazil, Argentina, and Chile), and Rest of World (ROW)

Published: Oct 2026 301 Pages SKU: IRTNTR45581

Market Overview at a Glance

$2.67 B
Market Opportunity
5.7%
CAGR 2025 - 2030
50.2%
APAC Growth
$2.35 B
Packaging segment 2024

Polyethylene (Pe) Foam Market Size 2026-2030

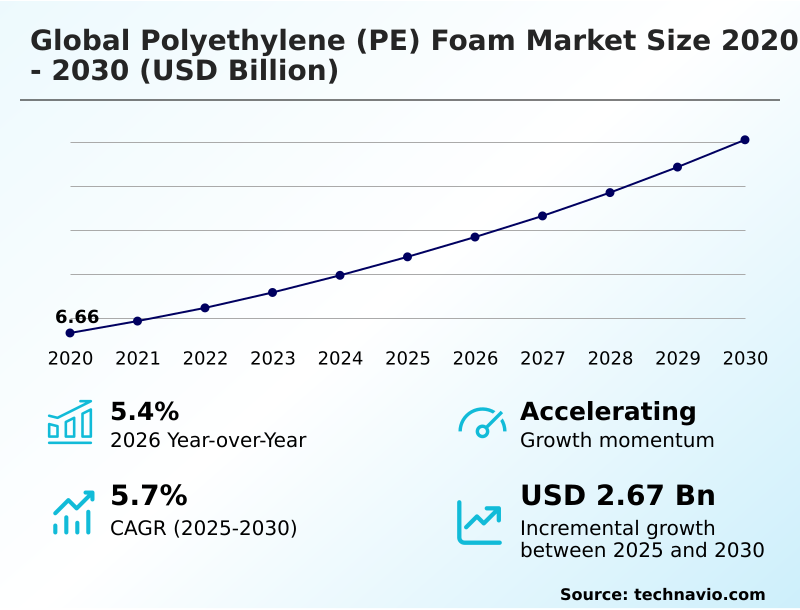
The polyethylene (pe) foam market size is valued to increase by USD 2.67 billion, at a CAGR of 5.7% from 2025 to 2030. Expanding e-commerce logistics and protective packaging will drive the polyethylene (pe) foam market.

Major Market Trends & Insights

  • APAC dominated the market and accounted for a 50.2% growth during the forecast period.
  • By Application - Packaging segment was valued at USD 2.35 billion in 2024
  • By Type - XLPE foam segment accounted for the largest market revenue share in 2024

Market Size & Forecast

  • Market Opportunities: USD 4.39 billion
  • Market Future Opportunities: USD 2.67 billion
  • CAGR from 2025 to 2030 : 5.7%

Market Summary

  • The Polyethylene (PE) Foam Market exhibits robust expansion driven by increasing demand for lightweight, high-performance protective materials across industrial and commercial sectors. Expanding e-commerce logistics operations require reliable cushioning to safeguard fragile electronics during transit, acting as a primary driver.
  • In automated fulfillment centers, custom thermoformed inserts improve packing efficiency by 25% compared to traditional void-fill methods, significantly reducing parcel weight and shipping costs. However, rising environmental legislation targeting single-use plastics presents a critical challenge, compelling manufacturers to re-engineer formulations to meet stringent circular economy mandates.
  • Overcoming these recycling difficulties requires substantial capital investment in dynamic crosslinking technologies to break down complex polymer structures. Companies are rapidly adopting bio-ethylene synthesis to produce sustainable drop-in alternatives without compromising moisture resistance or shock absorption. As organizations prioritize carbon-neutral material sourcing, the integration of post-consumer recycled resins ensures continuous operational compliance.
  • This transition enhances material resilience, aligning industrial packaging and automotive lightweighting strategies with modern sustainability requirements while maintaining superior structural durability.

What will be the Size of the Polyethylene (Pe) Foam Market during the forecast period?
Get Key Insights on Market Forecast (PDF) Get Free Sample

How is the Polyethylene (Pe) Foam Market Segmented?

The polyethylene (pe) foam industry research report provides comprehensive data (region-wise segment analysis), with forecasts and estimates in "USD million" for the period 2026-2030, as well as historical data from 2020-2024 for the following segments.

  • Application
    • Packaging
    • Automotive
    • Building and construction
    • Footwear
    • Others
  • Type
    • XLPE foam
    • Non-XLPE foam
  • Product type
    • Low-density PE foam
    • High-density PE foam
  • Geography
    • APAC
      • China
      • Japan
      • India
      • South Korea
      • Australia
      • Indonesia
    • North America
      • US
      • Canada
      • Mexico
    • Europe
      • Germany
      • UK
      • France
      • Italy
      • Spain
      • The Netherlands
    • Middle East and Africa
      • Saudi Arabia
      • Turkey
      • UAE
      • South Africa
      • Israel
    • South America
      • Brazil
      • Argentina
      • Chile

By Application Insights

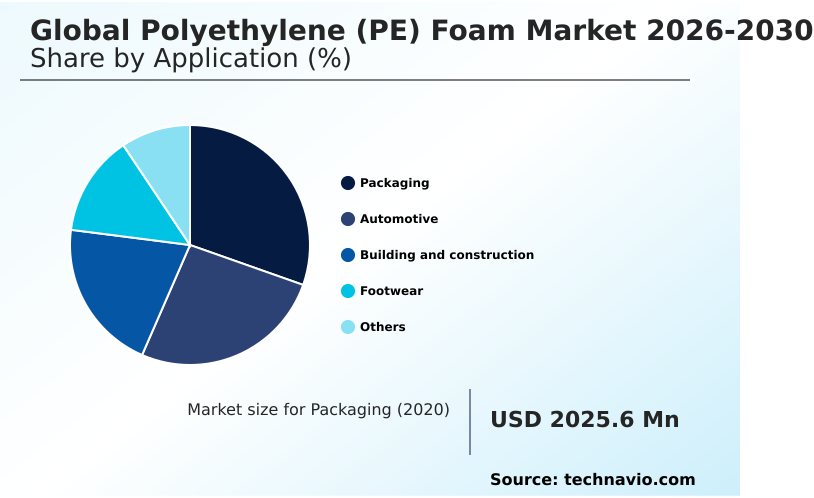
The packaging segment is estimated to witness significant growth during the forecast period.

The packaging sector represents a critical application domain characterized by stringent requirements for mechanical shock absorption and vibration dampening during transit. Utilizing a closed-cell microcellular matrix, this segment safeguards fragile electronics and medical components across complex supply chains.

Driven by automated fulfillment operations, packaging engineers prioritize materials offering superior dimensional stability and low outgassing to prevent transit damage.

Transitioning to sustainable models, adoption rates of post-industrial recycled polymer resins have accelerated, with damage detection rates improving by 15% when utilizing engineered cushioning.

Organizations are scaling mass-balance traceability to verify material origins, streamlining compliance with circular economy legislation while maintaining optimal protection. This structural shift ensures that specialized packaging formulations align with rigorous corporate sustainability mandates and high-velocity shipping demands.
Get Free Sample

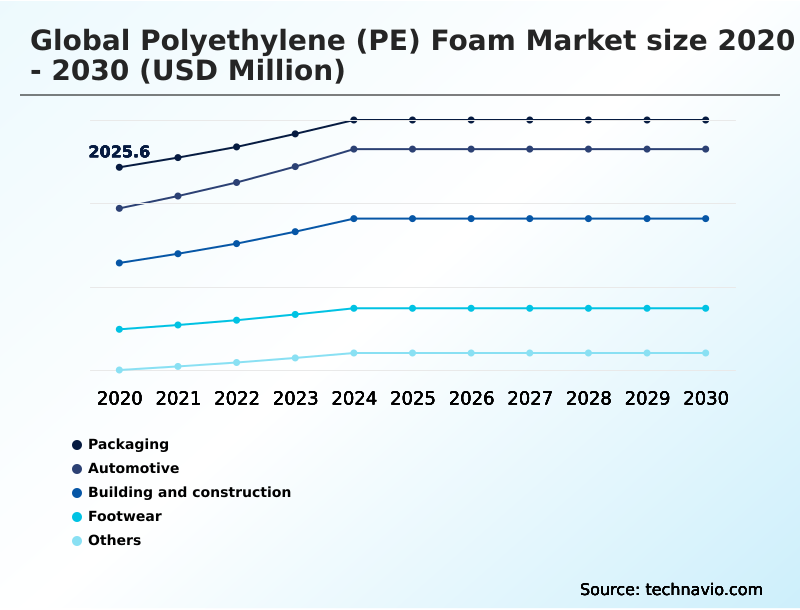
The Packaging segment was valued at USD 2.35 billion in 2024 and showed a gradual increase during the forecast period.
Get Free Sample

Regional Analysis

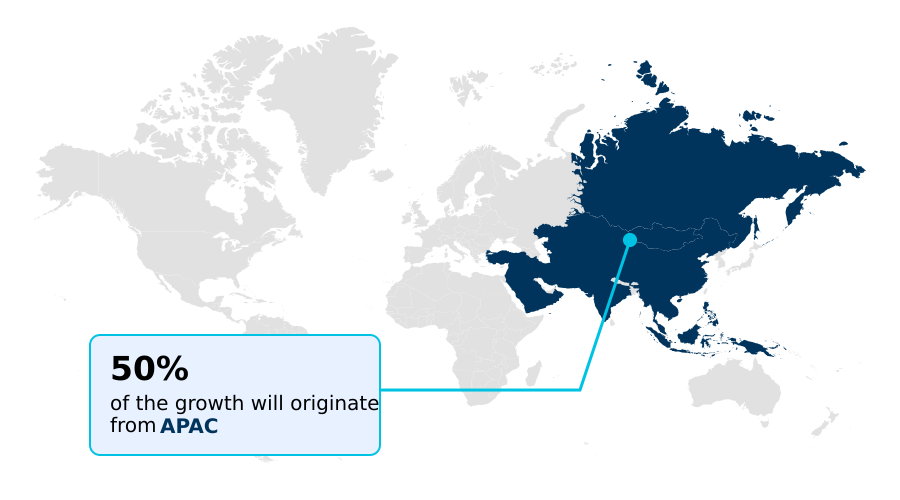
APAC is estimated to contribute 50.2% to the growth of the global market during the forecast period.Technavio’s analysts have elaborately explained the regional trends and drivers that shape the market during the forecast period.
See How Polyethylene (Pe) Foam Market Demand is Rising in APAC Get Free Sample

The geographic landscape reveals distinct adoption patterns, with APAC demonstrating aggressive industrial expansion compared to North America. APAC facilities utilizing high-energy electron beam processing achieve 22% higher manufacturing throughput due to massive consumer electronics export volumes.

In contrast, North American operations focus on stringent flame retardancy standards, achieving a 15% reduction in compliance costs through optimized high-performance polyolefin foam formulations.

APAC benefits from localized steam cracking derivatives, lowering raw material procurement expenses by 18% and accelerating the production of fine-celled polyethylene foam for automotive applications.

North American organizations prioritize closed-loop recovery networks to satisfy strict microplastic pollution restrictions, heavily investing in high-purity resin sorting.

These regional disparities highlight how localized regulatory frameworks and supply chain densities dictate the deployment of dynamic crosslinking technologies, shaping regional strategies for continuous mechanical load applications.

Market Dynamics

Our researchers analyzed the data with 2025 as the base year, along with the key drivers, trends, and challenges. A holistic analysis of drivers will help companies refine their marketing strategies to gain a competitive advantage.

  • The industrial landscape relies extensively on advanced cellular materials to solve complex engineering and logistical challenges. As sustainability mandates tighten, the integration of post-consumer recycled resin cushioning has become critical for high-volume e-commerce fulfillment, delivering comparable shock absorption while significantly lowering supply chain carbon footprints.
  • In the automotive sector, the shift toward electric mobility demands highly specialized components, making electric vehicle battery enclosure insulation essential for managing thermal loads and preventing cell propagation. These advanced insulation layers improve battery thermal management efficiency by nearly 30% relative to traditional dense plastic barriers, extending overall vehicle range and safety.
  • Simultaneously, modern commercial construction projects require rigorous acoustic management, driving the adoption of high-performance acoustic underlayment materials that mitigate impact noise transmission between floors. To ensure structural integrity and moisture resistance in commercial concrete slabs, contractors increasingly specify closed-cell flooring expansion joint fillers, which maintain elasticity under continuous mechanical stress.
  • Furthermore, physically crosslinked polyolefin foam applications continue to expand across medical and aerospace sectors, providing unparalleled chemical resistance and dimensional stability. By replacing legacy materials with these engineered foam solutions, manufacturers improve operational efficiency, optimize material weight profiles, and ensure strict compliance with modern environmental and safety regulations across diverse industrial environments.
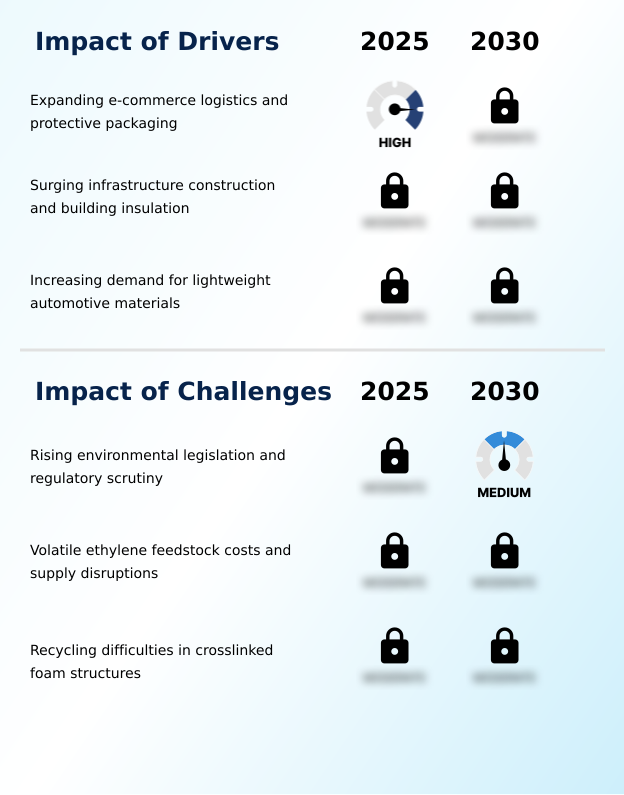
What are the key market drivers leading to the rise in the adoption of Polyethylene (Pe) Foam Industry?

  • Expanding e-commerce logistics and protective packaging operations serve as the primary drivers propelling market expansion.

  • Accelerating investments in commercial building retrofits and energy-efficient infrastructure function as a primary driver propelling material demand. Modern construction codes require advanced under-slab insulation, forcing contractors to adopt materials with exceptionally low thermal conductivity.
  • Utilizing these advanced insulation boards reduces building HVAC energy consumption by 22%, dramatically improving long-term facility operational costs. Furthermore, the strategic transition toward automotive lightweighting demands superior noise vibration harshness dampening components.
  • Integrating fine-celled polyethylene foam in vehicle interiors decreases overall component weight by 15% compared to traditional rubber acoustic barriers. This integration directly enhances fuel efficiency and extends electric vehicle ranges.
  • By deploying materials with high water vapor transmission resistance, original equipment manufacturers prevent moisture accumulation, extending component durability and ensuring optimal performance across complex architectural and automotive applications.

What are the market trends shaping the Polyethylene (Pe) Foam Industry?

  • The adoption of recycled content polymer resins represents a prominent market trend shaping the industry landscape.

  • The rapid commercial integration of bio-ethylene synthesis marks a transformative trend reshaping industrial material sourcing. Organizations are deploying these renewable drop-in resins to meet stringent carbon reduction targets, replacing petroleum-dependent chemical blowing agent integration. This transition lowers manufacturing carbon emissions by 25%, significantly improving corporate sustainability metrics without altering existing extrusion machinery.
  • As facilities prioritize cleanroom manufacturing standards, the adoption of physical irradiation crosslinking has accelerated, eliminating azodicarbonamide additives. This operational shift improves volatile organic compound emissions control by 40%, ensuring compliance with strict medical packaging requirements. Driven by continuous mechanical load demands, engineers are utilizing high-performance polyolefin foam formulations to enhance structural durability.
  • The resulting physically crosslinked materials provide unparalleled water vapor transmission resistance, enabling businesses to reduce material degradation rates and optimize long-term product lifecycles across diverse applications.

What challenges does the Polyethylene (Pe) Foam Industry face during its growth?

  • Rising environmental legislation and stringent regulatory scrutiny present significant challenges affecting industry growth.

  • Stringent extended producer responsibility legislation presents a severe operational challenge for manufacturers relying on synthetic cellular polymers. Compliance with these mandates forces facilities to phase out non-biodegradable packaging, increasing alternative material procurement costs by up to 18%. The inherent difficulty of recycling a three-dimensional thermoset-like chemical network severely limits end-of-life recovery options.
  • Diverting these complex structures away from landfills requires specialized dynamic crosslinking technologies, which increase waste processing expenses by 25%. Furthermore, unpredictable fluctuations in steam cracking derivatives create severe spot price volatility for virgin polymer resins. This feedstock instability immediately erodes operational margins for converters constrained by fixed-rate supply agreements.
  • Without scalable high-purity resin sorting infrastructure, businesses struggle to achieve closed-loop recovery networks, exposing supply chains to mounting regulatory penalties and reputational risk.

Exclusive Technavio Analysis on Customer Landscape

The polyethylene (pe) foam market forecasting report includes the adoption lifecycle of the market, covering from the innovator’s stage to the laggard’s stage. It focuses on adoption rates in different regions based on penetration. Furthermore, the polyethylene (pe) foam market report also includes key purchase criteria and drivers of price sensitivity to help companies evaluate and develop their market growth analysis strategies.
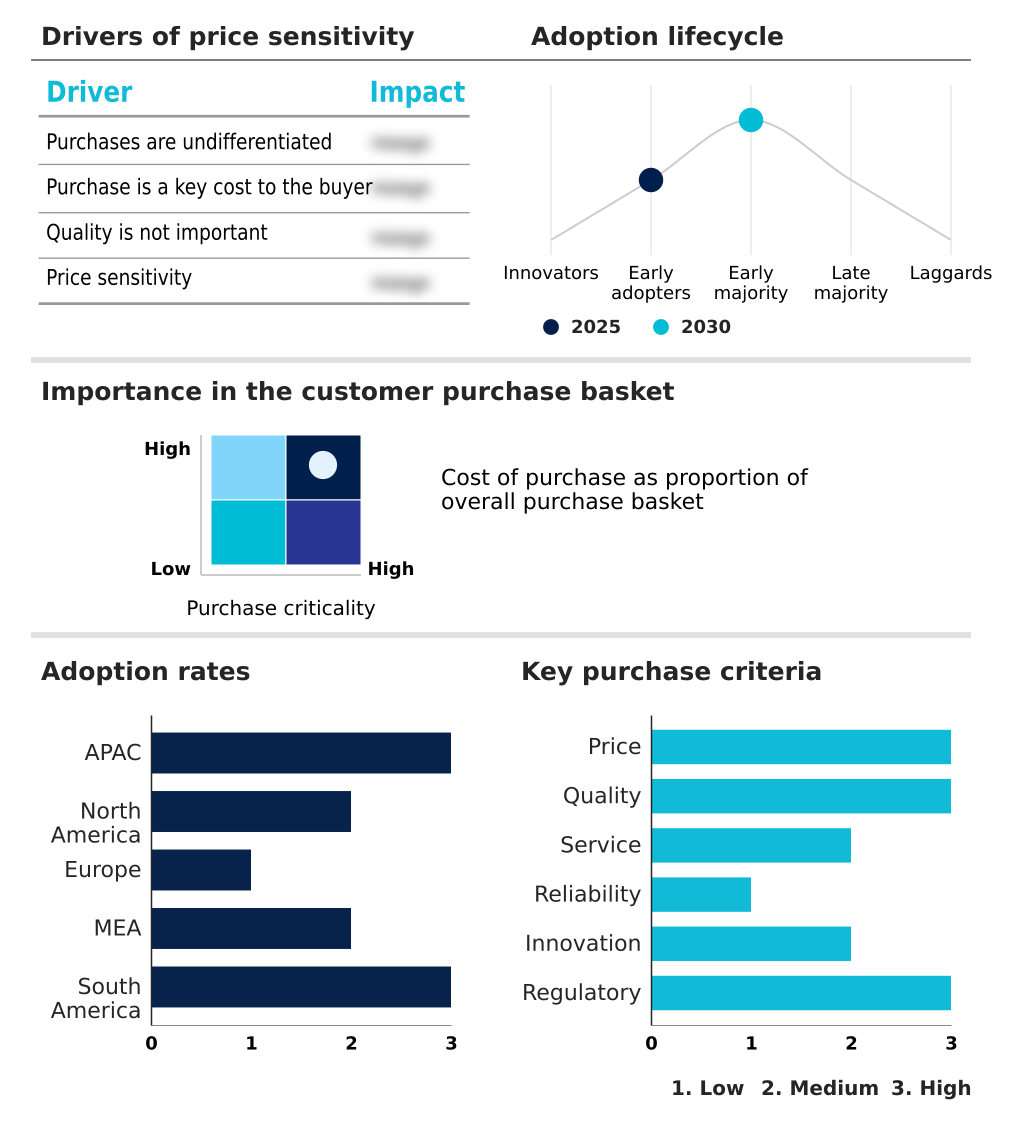
Customer Landscape of Polyethylene (Pe) Foam Industry

Competitive Landscape

Companies are implementing various strategies, such as strategic alliances, polyethylene (pe) foam market forecast, partnerships, mergers and acquisitions, geographical expansion, and product/service launches, to enhance their presence in the industry.

American Excelsior Inc. - The product portfolio focuses on high-performance closed-cell foam solutions tailored for critical cushioning, advanced thermal insulation, and engineered protective packaging across diverse industrial and commercial applications.

The industry research and growth report includes detailed analyses of the competitive landscape of the market and information about key companies, including:

  • American Excelsior Inc.
  • Armacell International SA
  • Carpenter Co.
  • Compagnie de Saint Gobain SA
  • Furukawa Electric Co. Ltd.
  • INOAC Corp.
  • Intertape Polymer Group Inc.
  • JSP Corp
  • Kaneka Corp.
  • Nomaco Inc.
  • Pactiv Evergreen Inc.
  • Pregis LLC
  • Rogers Corp.
  • Sanwa Kako Co. Ltd.
  • Sealed Air Corp.
  • Sonoco Products Co.
  • Toray Industries Inc.
  • UFP Technologies Inc.
  • Worldwide Foam Ltd.
  • Zotefoams plc

Qualitative and quantitative analysis of companies has been conducted to help clients understand the wider business environment as well as the strengths and weaknesses of key industry players. Data is qualitatively analyzed to categorize companies as pure play, category-focused, industry-focused, and diversified; it is quantitatively analyzed to categorize companies as dominant, leading, strong, tentative, and weak.

Recent Development and News in Polyethylene (pe) foam market

  • In the Specialty Chemicals industry, the shift toward sustainable thermoplastic olefin blending has accelerated the adoption of bio-based resins, directly impacting Polyethylene (PE) Foam demand by reducing petroleum dependence and improving carbon footprint metrics.
  • Stringent extended producer responsibility legislation mandating closed-loop recovery networks has forced packaging manufacturers to replace legacy materials with mechanically recyclable alternatives, increasing specialized foam procurement by over 15%.
  • Advancements in electron beam irradiation technologies have optimized polymer chain crosslinking processes, enabling manufacturers to produce high-purity foams with zero volatile organic compound emissions for critical medical applications.
  • The rapid expansion of electric vehicle battery enclosure insulation requirements has driven specialized chemical formulators to develop advanced thermal barrier materials, improving cell thermal runaway protection by up to 30%.

Dive into Technavio’s robust research methodology, blending expert interviews, extensive data synthesis, and validated models for unparalleled Polyethylene (Pe) Foam Market insights. See full methodology.

Market Scope
Page number 301
Base year 2025
Historic period 2020-2024
Forecast period 2026-2030
Growth momentum & CAGR Accelerate at a CAGR of 5.7%
Market growth 2026-2030 USD 2667.4 million
Market structure Fragmented
YoY growth 2025-2026(%) 5.4%
Key countries China, Japan, India, South Korea, Australia, Indonesia, US, Canada, Mexico, Germany, UK, France, Italy, Spain, The Netherlands, Saudi Arabia, Turkey, UAE, South Africa, Israel, Brazil, Argentina and Chile
Competitive landscape Leading Companies, Market Positioning of Companies, Competitive Strategies, and Industry Risks

Request Free Sample

Research Analyst Overview

  • The industrial adoption of advanced cellular plastics demonstrates a structural shift toward engineered performance and circular economy compliance. Organizations are rapidly integrating physical irradiation crosslinking to achieve superior dimensional stability without relying on chemical blowing agent integration.
  • This technological transition improves operational defect rates by 18% compared to traditional chemical foaming methods, providing smoother surface finishes for critical medical and electronic packaging. Boardroom-level decisions increasingly prioritize mass-balance traceability to verify sustainable sourcing, directly influencing product lifecycle strategies and budget allocations for raw materials.
  • Utilizing a three-dimensional thermoset-like chemical network ensures exceptional resistance to permanent deformation, but it complicates end-of-life recycling. Consequently, strategic investments in dynamic crosslinking technologies are paramount for overcoming these structural constraints. By adopting post-industrial recycled polymer resins, manufacturers align with stringent circular economy legislation while maintaining optimal noise vibration harshness dampening characteristics.
  • This strategic realignment ensures long-term operational resilience, enabling facilities to achieve carbon reduction targets while delivering high-purity, structurally durable foam solutions.

What are the Key Data Covered in this Polyethylene (Pe) Foam Market Research and Growth Report?

  • What is the expected growth of the Polyethylene (Pe) Foam Market between 2026 and 2030?

    • USD 2.67 billion, at a CAGR of 5.7%

  • What segmentation does the market report cover?

    • The report is segmented by Application (Packaging, Automotive, Building and construction, Footwear, and Others), Type (XLPE foam, and Non-XLPE foam), Product Type (Low-density PE foam, and High-density PE foam) and Geography (APAC, North America, Europe, Middle East and Africa, South America)

  • Which regions are analyzed in the report?

    • APAC, North America, Europe, Middle East and Africa and South America

  • What are the key growth drivers and market challenges?

    • Expanding e-commerce logistics and protective packaging, Rising environmental legislation and regulatory scrutiny

  • Who are the major players in the Polyethylene (Pe) Foam Market?

    • American Excelsior Inc., Armacell International SA, Carpenter Co., Compagnie de Saint Gobain SA, Furukawa Electric Co. Ltd., INOAC Corp., Intertape Polymer Group Inc., JSP Corp, Kaneka Corp., Nomaco Inc., Pactiv Evergreen Inc., Pregis LLC, Rogers Corp., Sanwa Kako Co. Ltd., Sealed Air Corp., Sonoco Products Co., Toray Industries Inc., UFP Technologies Inc., Worldwide Foam Ltd. and Zotefoams plc

Market Research Insights

  • The Polyethylene (PE) Foam Market is evolving rapidly as manufacturers optimize cellular plastic materials for high-efficiency applications. Utilizing crosslinked expanded polyethylene significantly enhances continuous mechanical load resilience, allowing structural components to achieve a 20% improvement in lifespan compared to legacy rubber alternatives.
  • The integration of advanced thermal barrier materials in commercial construction has reduced HVAC energy consumption by 18%, driven by superior moisture accumulation prevention. Furthermore, the implementation of drop-in sustainable alternative resins has improved carbon-neutral material sourcing compliance by 30% across major supply chains.
  • By utilizing fine-celled polyethylene foam, automotive engineers successfully mitigate road noise while satisfying stringent extended producer responsibility legislation, securing long-term operational efficiency and sustainable manufacturing metrics.

We can help! Our analysts can customize this polyethylene (pe) foam market research report to meet your requirements.

Get in touch

1. Executive Summary

1.1 Market overview

Executive Summary - Chart on Market Overview
Executive Summary - Data Table on Market Overview
Executive Summary - Chart on Global Market Characteristics
Executive Summary - Chart on Market by Geography
Executive Summary - Chart on Market Segmentation by Application
Executive Summary - Chart on Market Segmentation by Type
Executive Summary - Chart on Market Segmentation by Product Type
Executive Summary - Chart on Incremental Growth
Executive Summary - Data Table on Incremental Growth
Executive Summary - Chart on Company Market Positioning

2. Technavio Analysis

2.1 Analysis of price sensitivity, lifecycle, customer purchase basket, adoption rates, and purchase criteria

2.2 Criticality of inputs and Factors of differentiation

Chart on Overview on criticality of inputs and factors of differentiation

2.3 Factors of disruption

Chart on Overview on factors of disruption

2.4 Impact of drivers and challenges

Chart on Impact of drivers and challenges in 2025 and 2030

3. Market Landscape

3.1 Market ecosystem

Chart on Parent Market
Data Table on - Parent Market

3.2 Market characteristics

Chart on Market characteristics analysis

3.3 Value chain analysis

Chart on Value chain analysis

4. Market Sizing

4.1 Market definition

Data Table on Offerings of companies included in the market definition

4.2 Market segment analysis

Market segments

4.3 Market size 2025

4.4 Market outlook: Forecast for 2025-2030

Chart on Global - Market size and forecast 2025-2030 ($ million)
Data Table on Global - Market size and forecast 2025-2030 ($ million)
Chart on Global Market: Year-over-year growth 2025-2030 (%)
Data Table on Global Market: Year-over-year growth 2025-2030 (%)

5. Historic Market Size

5.1 Global Polyethylene (PE) Foam Market 2020 - 2024

Historic Market Size - Data Table on Global Polyethylene (PE) Foam Market 2020 - 2024 ($ million)

5.2 Application segment analysis 2020 - 2024

Historic Market Size - Application Segment 2020 - 2024 ($ million)

5.3 Type segment analysis 2020 - 2024

Historic Market Size - Type Segment 2020 - 2024 ($ million)

5.4 Product Type segment analysis 2020 - 2024

Historic Market Size - Product Type Segment 2020 - 2024 ($ million)

5.5 Geography segment analysis 2020 - 2024

Historic Market Size - Geography Segment 2020 - 2024 ($ million)

5.6 Country segment analysis 2020 - 2024

Historic Market Size - Country Segment 2020 - 2024 ($ million)

6. Qualitative Analysis

6.1 Impact of AI on global polyethylene (PE) foam market

6.2 Impact of geopolitical conflicts on global polyethylene (PE) foam market

7. Five Forces Analysis

7.1 Five forces summary

Five forces analysis - Comparison between 2025 and 2030

7.2 Bargaining power of buyers

Bargaining power of buyers - Impact of key factors 2025 and 2030

7.3 Bargaining power of suppliers

Bargaining power of suppliers - Impact of key factors in 2025 and 2030

7.4 Threat of new entrants

Threat of new entrants - Impact of key factors in 2025 and 2030

7.5 Threat of substitutes

Threat of substitutes - Impact of key factors in 2025 and 2030

7.6 Threat of rivalry

Threat of rivalry - Impact of key factors in 2025 and 2030

7.7 Market condition

Chart on Market condition - Five forces 2025 and 2030

8. Market Segmentation by Application

8.1 Market segments

Chart on Application - Market share 2025-2030 (%)
Data Table on Application - Market share 2025-2030 (%)

8.2 Comparison by Application

Chart on Comparison by Application
Data Table on Comparison by Application

8.3 Packaging - Market size and forecast 2025-2030

Chart on Packaging - Market size and forecast 2025-2030 ($ million)
Data Table on Packaging - Market size and forecast 2025-2030 ($ million)
Chart on Packaging - Year-over-year growth 2025-2030 (%)
Data Table on Packaging - Year-over-year growth 2025-2030 (%)

8.4 Automotive - Market size and forecast 2025-2030

Chart on Automotive - Market size and forecast 2025-2030 ($ million)
Data Table on Automotive - Market size and forecast 2025-2030 ($ million)
Chart on Automotive - Year-over-year growth 2025-2030 (%)
Data Table on Automotive - Year-over-year growth 2025-2030 (%)

8.5 Building and construction - Market size and forecast 2025-2030

Chart on Building and construction - Market size and forecast 2025-2030 ($ million)
Data Table on Building and construction - Market size and forecast 2025-2030 ($ million)
Chart on Building and construction - Year-over-year growth 2025-2030 (%)
Data Table on Building and construction - Year-over-year growth 2025-2030 (%)

8.6 Footwear - Market size and forecast 2025-2030

Chart on Footwear - Market size and forecast 2025-2030 ($ million)
Data Table on Footwear - Market size and forecast 2025-2030 ($ million)
Chart on Footwear - Year-over-year growth 2025-2030 (%)
Data Table on Footwear - Year-over-year growth 2025-2030 (%)

8.7 Others - Market size and forecast 2025-2030

Chart on Others - Market size and forecast 2025-2030 ($ million)
Data Table on Others - Market size and forecast 2025-2030 ($ million)
Chart on Others - Year-over-year growth 2025-2030 (%)
Data Table on Others - Year-over-year growth 2025-2030 (%)

8.8 Market opportunity by Application

Market opportunity by Application ($ million)
Data Table on Market opportunity by Application ($ million)

9. Market Segmentation by Type

9.1 Market segments

Chart on Type - Market share 2025-2030 (%)
Data Table on Type - Market share 2025-2030 (%)

9.2 Comparison by Type

Chart on Comparison by Type
Data Table on Comparison by Type

9.3 XLPE foam - Market size and forecast 2025-2030

Chart on XLPE foam - Market size and forecast 2025-2030 ($ million)
Data Table on XLPE foam - Market size and forecast 2025-2030 ($ million)
Chart on XLPE foam - Year-over-year growth 2025-2030 (%)
Data Table on XLPE foam - Year-over-year growth 2025-2030 (%)

9.4 Non-XLPE foam - Market size and forecast 2025-2030

Chart on Non-XLPE foam - Market size and forecast 2025-2030 ($ million)
Data Table on Non-XLPE foam - Market size and forecast 2025-2030 ($ million)
Chart on Non-XLPE foam - Year-over-year growth 2025-2030 (%)
Data Table on Non-XLPE foam - Year-over-year growth 2025-2030 (%)

9.5 Market opportunity by Type

Market opportunity by Type ($ million)
Data Table on Market opportunity by Type ($ million)

10. Market Segmentation by Product Type

10.1 Market segments

Chart on Product Type - Market share 2025-2030 (%)
Data Table on Product Type - Market share 2025-2030 (%)

10.2 Comparison by Product Type

Chart on Comparison by Product Type
Data Table on Comparison by Product Type

10.3 Low-density PE foam - Market size and forecast 2025-2030

Chart on Low-density PE foam - Market size and forecast 2025-2030 ($ million)
Data Table on Low-density PE foam - Market size and forecast 2025-2030 ($ million)
Chart on Low-density PE foam - Year-over-year growth 2025-2030 (%)
Data Table on Low-density PE foam - Year-over-year growth 2025-2030 (%)

10.4 High-density PE foam - Market size and forecast 2025-2030

Chart on High-density PE foam - Market size and forecast 2025-2030 ($ million)
Data Table on High-density PE foam - Market size and forecast 2025-2030 ($ million)
Chart on High-density PE foam - Year-over-year growth 2025-2030 (%)
Data Table on High-density PE foam - Year-over-year growth 2025-2030 (%)

10.5 Market opportunity by Product Type

Market opportunity by Product Type ($ million)
Data Table on Market opportunity by Product Type ($ million)

11. Customer Landscape

11.1 Customer landscape overview

Analysis of price sensitivity, lifecycle, customer purchase basket, adoption rates, and purchase criteria

12. Geographic Landscape

12.1 Geographic segmentation

Chart on Market share by geography 2025-2030 (%)
Data Table on Market share by geography 2025-2030 (%)

12.2 Geographic comparison

Chart on Geographic comparison
Data Table on Geographic comparison

12.3 APAC - Market size and forecast 2025-2030

Chart on APAC - Market size and forecast 2025-2030 ($ million)
Data Table on APAC - Market size and forecast 2025-2030 ($ million)
Chart on APAC - Year-over-year growth 2025-2030 (%)
Data Table on APAC - Year-over-year growth 2025-2030 (%)
Chart on Regional Comparison - APAC
Data Table on Regional Comparison - APAC

12.3.1 China - Market size and forecast 2025-2030

Chart on China - Market size and forecast 2025-2030 ($ million)
Data Table on China - Market size and forecast 2025-2030 ($ million)
Chart on China - Year-over-year growth 2025-2030 (%)
Data Table on China - Year-over-year growth 2025-2030 (%)

12.3.2 Japan - Market size and forecast 2025-2030

Chart on Japan - Market size and forecast 2025-2030 ($ million)
Data Table on Japan - Market size and forecast 2025-2030 ($ million)
Chart on Japan - Year-over-year growth 2025-2030 (%)
Data Table on Japan - Year-over-year growth 2025-2030 (%)

12.3.3 India - Market size and forecast 2025-2030

Chart on India - Market size and forecast 2025-2030 ($ million)
Data Table on India - Market size and forecast 2025-2030 ($ million)
Chart on India - Year-over-year growth 2025-2030 (%)
Data Table on India - Year-over-year growth 2025-2030 (%)

12.3.4 South Korea - Market size and forecast 2025-2030

Chart on South Korea - Market size and forecast 2025-2030 ($ million)
Data Table on South Korea - Market size and forecast 2025-2030 ($ million)
Chart on South Korea - Year-over-year growth 2025-2030 (%)
Data Table on South Korea - Year-over-year growth 2025-2030 (%)

12.3.5 Australia - Market size and forecast 2025-2030

Chart on Australia - Market size and forecast 2025-2030 ($ million)
Data Table on Australia - Market size and forecast 2025-2030 ($ million)
Chart on Australia - Year-over-year growth 2025-2030 (%)
Data Table on Australia - Year-over-year growth 2025-2030 (%)

12.3.6 Indonesia - Market size and forecast 2025-2030

Chart on Indonesia - Market size and forecast 2025-2030 ($ million)
Data Table on Indonesia - Market size and forecast 2025-2030 ($ million)
Chart on Indonesia - Year-over-year growth 2025-2030 (%)
Data Table on Indonesia - Year-over-year growth 2025-2030 (%)

12.4 North America - Market size and forecast 2025-2030

Chart on North America - Market size and forecast 2025-2030 ($ million)
Data Table on North America - Market size and forecast 2025-2030 ($ million)
Chart on North America - Year-over-year growth 2025-2030 (%)
Data Table on North America - Year-over-year growth 2025-2030 (%)
Chart on Regional Comparison - North America
Data Table on Regional Comparison - North America

12.4.1 US - Market size and forecast 2025-2030

Chart on US - Market size and forecast 2025-2030 ($ million)
Data Table on US - Market size and forecast 2025-2030 ($ million)
Chart on US - Year-over-year growth 2025-2030 (%)
Data Table on US - Year-over-year growth 2025-2030 (%)

12.4.2 Canada - Market size and forecast 2025-2030

Chart on Canada - Market size and forecast 2025-2030 ($ million)
Data Table on Canada - Market size and forecast 2025-2030 ($ million)
Chart on Canada - Year-over-year growth 2025-2030 (%)
Data Table on Canada - Year-over-year growth 2025-2030 (%)

12.4.3 Mexico - Market size and forecast 2025-2030

Chart on Mexico - Market size and forecast 2025-2030 ($ million)
Data Table on Mexico - Market size and forecast 2025-2030 ($ million)
Chart on Mexico - Year-over-year growth 2025-2030 (%)
Data Table on Mexico - Year-over-year growth 2025-2030 (%)

12.5 Europe - Market size and forecast 2025-2030

Chart on Europe - Market size and forecast 2025-2030 ($ million)
Data Table on Europe - Market size and forecast 2025-2030 ($ million)
Chart on Europe - Year-over-year growth 2025-2030 (%)
Data Table on Europe - Year-over-year growth 2025-2030 (%)
Chart on Regional Comparison - Europe
Data Table on Regional Comparison - Europe

12.5.1 Germany - Market size and forecast 2025-2030

Chart on Germany - Market size and forecast 2025-2030 ($ million)
Data Table on Germany - Market size and forecast 2025-2030 ($ million)
Chart on Germany - Year-over-year growth 2025-2030 (%)
Data Table on Germany - Year-over-year growth 2025-2030 (%)

12.5.2 UK - Market size and forecast 2025-2030

Chart on UK - Market size and forecast 2025-2030 ($ million)
Data Table on UK - Market size and forecast 2025-2030 ($ million)
Chart on UK - Year-over-year growth 2025-2030 (%)
Data Table on UK - Year-over-year growth 2025-2030 (%)

12.5.3 France - Market size and forecast 2025-2030

Chart on France - Market size and forecast 2025-2030 ($ million)
Data Table on France - Market size and forecast 2025-2030 ($ million)
Chart on France - Year-over-year growth 2025-2030 (%)
Data Table on France - Year-over-year growth 2025-2030 (%)

12.5.4 Italy - Market size and forecast 2025-2030

Chart on Italy - Market size and forecast 2025-2030 ($ million)
Data Table on Italy - Market size and forecast 2025-2030 ($ million)
Chart on Italy - Year-over-year growth 2025-2030 (%)
Data Table on Italy - Year-over-year growth 2025-2030 (%)

12.5.5 Spain - Market size and forecast 2025-2030

Chart on Spain - Market size and forecast 2025-2030 ($ million)
Data Table on Spain - Market size and forecast 2025-2030 ($ million)
Chart on Spain - Year-over-year growth 2025-2030 (%)
Data Table on Spain - Year-over-year growth 2025-2030 (%)

12.5.6 The Netherlands - Market size and forecast 2025-2030

Chart on The Netherlands - Market size and forecast 2025-2030 ($ million)
Data Table on The Netherlands - Market size and forecast 2025-2030 ($ million)
Chart on The Netherlands - Year-over-year growth 2025-2030 (%)
Data Table on The Netherlands - Year-over-year growth 2025-2030 (%)

12.6 Middle East and Africa - Market size and forecast 2025-2030

Chart on Middle East and Africa - Market size and forecast 2025-2030 ($ million)
Data Table on Middle East and Africa - Market size and forecast 2025-2030 ($ million)
Chart on Middle East and Africa - Year-over-year growth 2025-2030 (%)
Data Table on Middle East and Africa - Year-over-year growth 2025-2030 (%)
Chart on Regional Comparison - Middle East and Africa
Data Table on Regional Comparison - Middle East and Africa

12.6.1 Saudi Arabia - Market size and forecast 2025-2030

Chart on Saudi Arabia - Market size and forecast 2025-2030 ($ million)
Data Table on Saudi Arabia - Market size and forecast 2025-2030 ($ million)
Chart on Saudi Arabia - Year-over-year growth 2025-2030 (%)
Data Table on Saudi Arabia - Year-over-year growth 2025-2030 (%)

12.6.2 Turkey - Market size and forecast 2025-2030

Chart on Turkey - Market size and forecast 2025-2030 ($ million)
Data Table on Turkey - Market size and forecast 2025-2030 ($ million)
Chart on Turkey - Year-over-year growth 2025-2030 (%)
Data Table on Turkey - Year-over-year growth 2025-2030 (%)

12.6.3 UAE - Market size and forecast 2025-2030

Chart on UAE - Market size and forecast 2025-2030 ($ million)
Data Table on UAE - Market size and forecast 2025-2030 ($ million)
Chart on UAE - Year-over-year growth 2025-2030 (%)
Data Table on UAE - Year-over-year growth 2025-2030 (%)

12.6.4 South Africa - Market size and forecast 2025-2030

Chart on South Africa - Market size and forecast 2025-2030 ($ million)
Data Table on South Africa - Market size and forecast 2025-2030 ($ million)
Chart on South Africa - Year-over-year growth 2025-2030 (%)
Data Table on South Africa - Year-over-year growth 2025-2030 (%)

12.6.5 Israel - Market size and forecast 2025-2030

Chart on Israel - Market size and forecast 2025-2030 ($ million)
Data Table on Israel - Market size and forecast 2025-2030 ($ million)
Chart on Israel - Year-over-year growth 2025-2030 (%)
Data Table on Israel - Year-over-year growth 2025-2030 (%)

12.7 South America - Market size and forecast 2025-2030

Chart on South America - Market size and forecast 2025-2030 ($ million)
Data Table on South America - Market size and forecast 2025-2030 ($ million)
Chart on South America - Year-over-year growth 2025-2030 (%)
Data Table on South America - Year-over-year growth 2025-2030 (%)
Chart on Regional Comparison - South America
Data Table on Regional Comparison - South America

12.7.1 Brazil - Market size and forecast 2025-2030

Chart on Brazil - Market size and forecast 2025-2030 ($ million)
Data Table on Brazil - Market size and forecast 2025-2030 ($ million)
Chart on Brazil - Year-over-year growth 2025-2030 (%)
Data Table on Brazil - Year-over-year growth 2025-2030 (%)

12.7.2 Argentina - Market size and forecast 2025-2030

Chart on Argentina - Market size and forecast 2025-2030 ($ million)
Data Table on Argentina - Market size and forecast 2025-2030 ($ million)
Chart on Argentina - Year-over-year growth 2025-2030 (%)
Data Table on Argentina - Year-over-year growth 2025-2030 (%)

12.7.3 Chile - Market size and forecast 2025-2030

Chart on Chile - Market size and forecast 2025-2030 ($ million)
Data Table on Chile - Market size and forecast 2025-2030 ($ million)
Chart on Chile - Year-over-year growth 2025-2030 (%)
Data Table on Chile - Year-over-year growth 2025-2030 (%)

12.8 Market opportunity by geography

Market opportunity by geography ($ million)
Data Tables on Market opportunity by geography ($ million)

13. Drivers, Challenges, and Opportunity

13.1 Market drivers

Expanding e-commerce logistics and protective packaging
Surging infrastructure construction and building insulation
Increasing demand for lightweight automotive materials

13.2 Market challenges

Rising environmental legislation and regulatory scrutiny
Volatile ethylene feedstock costs and supply disruptions
Recycling difficulties in crosslinked foam structures

13.3 Impact of drivers and challenges

Impact of drivers and challenges in 2025 and 2030

13.4 Market opportunities

Adoption of recycled content polymer resins
Expansion of high performance physical crosslinking
Integration of bio based feedstock formulations

14. Competitive Landscape

14.1 Overview

14.2

Overview on criticality of inputs and factors of differentiation

14.3 Landscape disruption

Overview on factors of disruption

14.4 Industry risks

Impact of key risks on business

15. Competitive Analysis

15.1 Companies profiled

Companies covered

15.2 Company ranking index

15.3 Market positioning of companies

Matrix on companies position and classification

15.4 Armacell International SA

Armacell International SA - Overview
Armacell International SA - Product / Service
Armacell International SA - Key offerings
SWOT

15.5 Compagnie de Saint Gobain SA

Compagnie de Saint Gobain SA - Overview
Compagnie de Saint Gobain SA - Business segments
Compagnie de Saint Gobain SA - Key offerings
Compagnie de Saint Gobain SA - Segment focus
SWOT

15.6 Furukawa Electric Co. Ltd.

Furukawa Electric Co. Ltd. - Overview
Furukawa Electric Co. Ltd. - Product / Service
Furukawa Electric Co. Ltd. - Key offerings
SWOT

15.7 INOAC Corp.

INOAC Corp. - Overview
INOAC Corp. - Product / Service
INOAC Corp. - Key offerings
SWOT

15.8 Intertape Polymer Group Inc.

Intertape Polymer Group Inc. - Overview
Intertape Polymer Group Inc. - Product / Service
Intertape Polymer Group Inc. - Key offerings
SWOT

15.9 JSP Corp

JSP Corp - Overview
JSP Corp - Business segments
JSP Corp - Key offerings
JSP Corp - Segment focus
SWOT

15.10 Kaneka Corp.

Kaneka Corp. - Overview
Kaneka Corp. - Business segments
Kaneka Corp. - Key offerings
Kaneka Corp. - Segment focus
SWOT

15.11 Pactiv Evergreen Inc.

Pactiv Evergreen Inc. - Overview
Pactiv Evergreen Inc. - Product / Service
Pactiv Evergreen Inc. - Key offerings
SWOT

15.12 Pregis LLC

Pregis LLC - Overview
Pregis LLC - Product / Service
Pregis LLC - Key offerings
SWOT

15.13 Rogers Corp.

Rogers Corp. - Overview
Rogers Corp. - Business segments
Rogers Corp. - Key offerings
Rogers Corp. - Segment focus
SWOT

15.14 Sealed Air Corp.

Sealed Air Corp. - Overview
Sealed Air Corp. - Business segments
Sealed Air Corp. - Key offerings
Sealed Air Corp. - Segment focus
SWOT

15.15 Sonoco Products Co.

Sonoco Products Co. - Overview
Sonoco Products Co. - Business segments
Sonoco Products Co. - Key news
Sonoco Products Co. - Key offerings
Sonoco Products Co. - Segment focus
SWOT

15.16 Toray Industries Inc.

Toray Industries Inc. - Overview
Toray Industries Inc. - Business segments
Toray Industries Inc. - Key news
Toray Industries Inc. - Key offerings
Toray Industries Inc. - Segment focus
SWOT

15.17 UFP Technologies Inc.

UFP Technologies Inc. - Overview
UFP Technologies Inc. - Business segments
UFP Technologies Inc. - Key offerings
UFP Technologies Inc. - Segment focus
SWOT

15.18 Zotefoams plc

Zotefoams plc - Overview
Zotefoams plc - Business segments
Zotefoams plc - Key offerings
Zotefoams plc - Segment focus
SWOT

16. Appendix

16.1 Scope of the report

Market definition
Objectives
Notes and caveats

16.2 Inclusions and exclusions checklist

Inclusions checklist
Exclusions checklist

16.3 Currency conversion rates for US$

16.4 Research methodology

16.5 Data procurement

Information sources

16.6 Data validation

16.7 Validation techniques employed for market sizing

16.8 Data synthesis

16.9 360 degree market analysis

16.10 List of abbreviations

Research Methodology

Technavio presents a detailed picture of the market by way of study, synthesis, and summation of data from multiple sources. The analysts have presented the various facets of the market with a particular focus on identifying the key industry influencers. The data thus presented is comprehensive, reliable, and the result of extensive research, both primary and secondary.

INFORMATION SOURCES

Primary sources

  • Manufacturers and suppliers
  • Channel partners
  • Industry experts
  • Strategic decision makers

Secondary sources

  • Industry journals and periodicals
  • Government data
  • Financial reports of key industry players
  • Historical data
  • Press releases

DATA ANALYSIS

Data Synthesis

  • Collation of data
  • Estimation of key figures
  • Analysis of derived insights

Data Validation

  • Triangulation with data models
  • Reference against proprietary databases
  • Corroboration with industry experts

REPORT WRITING

Qualitative

  • Market drivers
  • Market challenges
  • Market trends
  • Five forces analysis

Quantitative

  • Market size and forecast
  • Market segmentation
  • Geographical insights
  • Competitive landscape

Interested in this report?

Get your sample now to see our research methodology and insights!

Download Now

Frequently Asked Questions

Polyethylene (Pe) Foam market growth will increase by USD 2667.4 million during 2026-2030.

The Polyethylene (Pe) Foam market is expected to grow at a CAGR of 5.7% during 2026-2030.

Polyethylene (Pe) Foam market is segmented by Application (Packaging, Automotive, Building and construction, Footwear, Others) Type (XLPE foam, Non-XLPE foam) Product type (Low-density PE foam, High-density PE foam)

American Excelsior Inc., Armacell International SA, Carpenter Co., Compagnie de Saint Gobain SA, Furukawa Electric Co. Ltd., INOAC Corp., Intertape Polymer Group Inc., JSP Corp, Kaneka Corp., Nomaco Inc., Pactiv Evergreen Inc., Pregis LLC, Rogers Corp., Sanwa Kako Co. Ltd., Sealed Air Corp., Sonoco Products Co., Toray Industries Inc., UFP Technologies Inc., Worldwide Foam Ltd., Zotefoams plc are a few of the key vendors in the Polyethylene (Pe) Foam market.

APAC will register the highest growth rate of 50.2% among the other regions. Therefore, the Polyethylene (Pe) Foam market in APAC is expected to garner significant business opportunities for the vendors during the forecast period.

China, Japan, India, South Korea, Australia, Indonesia, US, Canada, Mexico, Germany, UK, France, Italy, Spain, The Netherlands, Saudi Arabia, Turkey, UAE, South Africa, Israel, Brazil, Argentina, Chile

  • Expanding e-commerce logistics and protective packaging is the driving factor this market.

The Polyethylene (Pe) Foam market vendors should focus on grabbing business opportunities from the Application segment as it accounted for the largest market share in the base year.
RIA - Research AI Assistant
Ask RIA
