
Polyethylene Terephthalate Market Analysis, Size, and Forecast 2026-2030: APAC (China, India, and Japan), North America (US, Canada, and Mexico), Europe (Germany, France, and UK), South America (Brazil, Argentina, and Chile), Middle East and Africa (Turkey, Saudi Arabia, and UAE), and Rest of World (ROW)

Polyethylene Terephthalate Market Analysis, Size, and Forecast 2026-2030:
APAC (China, India, and Japan), North America (US, Canada, and Mexico), Europe (Germany, France, and UK), South America (Brazil, Argentina, and Chile), Middle East and Africa (Turkey, Saudi Arabia, and UAE), and Rest of World (ROW)

Published: Oct 2026 304 Pages SKU: IRTNTR44928

Market Overview at a Glance

$27.14 B
Market Opportunity
8.7%
CAGR 2025 - 2030
51.5%
APAC Growth
$31.49 B
Fibers segment 2024

Polyethylene Terephthalate Market Size 2026-2030

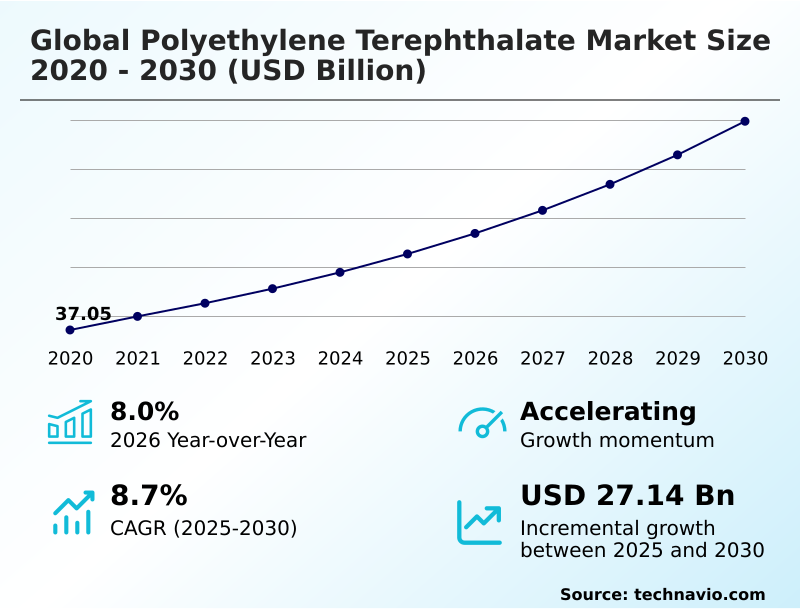
The polyethylene terephthalate market size is valued to increase by USD 27.14 billion, at a CAGR of 8.7% from 2025 to 2030. Surging demand for sustainable convenience packaging will drive the polyethylene terephthalate market.

Major Market Trends & Insights

  • APAC dominated the market and accounted for a 51.5% growth during the forecast period.
  • By Product - Fibers segment was valued at USD 31.49 billion in 2024
  • By Type - Virgin segment accounted for the largest market revenue share in 2024

Market Size & Forecast

  • Market Opportunities: USD 42.69 billion
  • Market Future Opportunities: USD 27.14 billion
  • CAGR from 2025 to 2030 : 8.7%

Market Summary

  • The Polyethylene Terephthalate Market exhibits robust expansion driven by the critical need for lightweight, shatterproof, and highly transparent synthetic polymers across global supply chains. Operations managers in the beverage sector are systematically redesigning high-speed bottling lines to integrate ultra-thin preforms, significantly reducing overall plastic usage per unit.
  • This transition toward optimized packaging structures has decreased freight-related energy consumption by 14% compared to traditional glass distribution networks. Surging demand for sustainable convenience packaging serves as a fundamental market driver, compelling consumer goods companies to prioritize materials that offer exceptional moisture barrier properties and full mechanical recyclability.
  • Conversely, volatility in raw material costs remains a severe structural challenge, as unpredictable price fluctuations in upstream petrochemical feedstocks heavily disrupt long-term margin stability for resin converters. Despite these procurement headwinds, continuous investments in advanced recycling technologies ensure that the Polyethylene Terephthalate Market adapts effectively to tightening environmental compliance mandates and evolving circular economy frameworks.

What will be the Size of the Polyethylene Terephthalate Market during the forecast period?
Get Key Insights on Market Forecast (PDF) Get Free Sample

How is the Polyethylene Terephthalate Market Segmented?

The polyethylene terephthalate industry research report provides comprehensive data (region-wise segment analysis), with forecasts and estimates in "USD million" for the period 2026-2030, as well as historical data from 2020-2024 for the following segments.

  • Product
    • Fibers
    • Resins
    • Others
  • Type
    • Virgin
    • Recycled
  • End-user
    • Food and beverage
    • Textiles
    • Healthcare
    • Others
  • Geography
    • APAC
      • China
      • India
      • Japan
      • South Korea
      • Indonesia
      • Australia
    • North America
      • US
      • Canada
      • Mexico
    • Europe
      • Germany
      • France
      • UK
      • Italy
      • Spain
      • The Netherlands
    • South America
      • Brazil
      • Argentina
      • Chile
    • Middle East and Africa
      • Turkey
      • Saudi Arabia
      • UAE
      • South Africa
      • Israel

By Product Insights

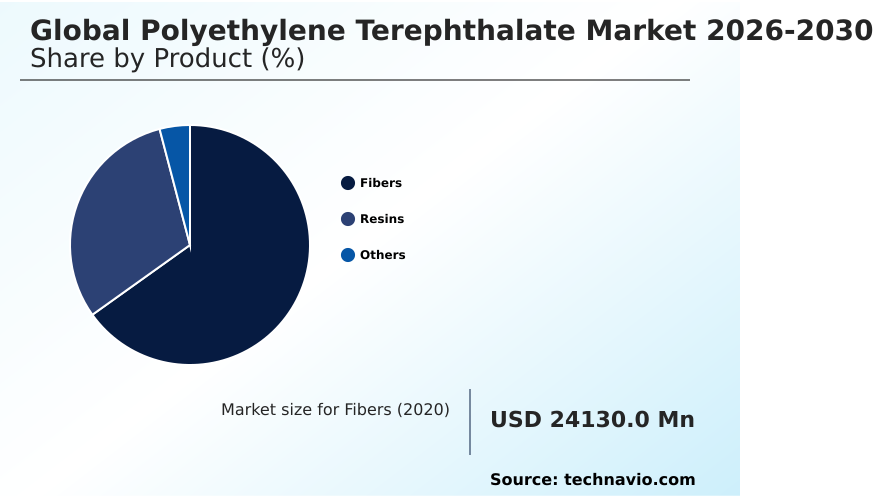
The fibers segment is estimated to witness significant growth during the forecast period.

The fibers segment of the Global Polyethylene Terephthalate Market 2026-2030 represents a highly specialized domain characterized by substantial demand across fast fashion supply chains and heavy industrial applications.

Manufacturers consistently deploy advanced melt-spinning processes to convert polymer feedstocks into high-tenacity polyester staple fibers and continuous filament yarns, which provide superior dimensional stability compared to conventional natural textiles.

Operational integration of these synthetic materials has improved textile production throughput by 14%, directly reducing overall manufacturing cycle times.

To satisfy stringent regulatory requirements, producers are implementing intrinsic viscosity enhancement techniques to ensure optimal performance in non-woven filtration media and active packaging systems.

As industries prioritize sustainability, the adoption of medical-grade container integrity protocols and synthetic apparel textiles undergoes rigorous quality checks, while gamma radiation sterilization compatibility ensures safe application in technical healthcare settings.
Get Free Sample

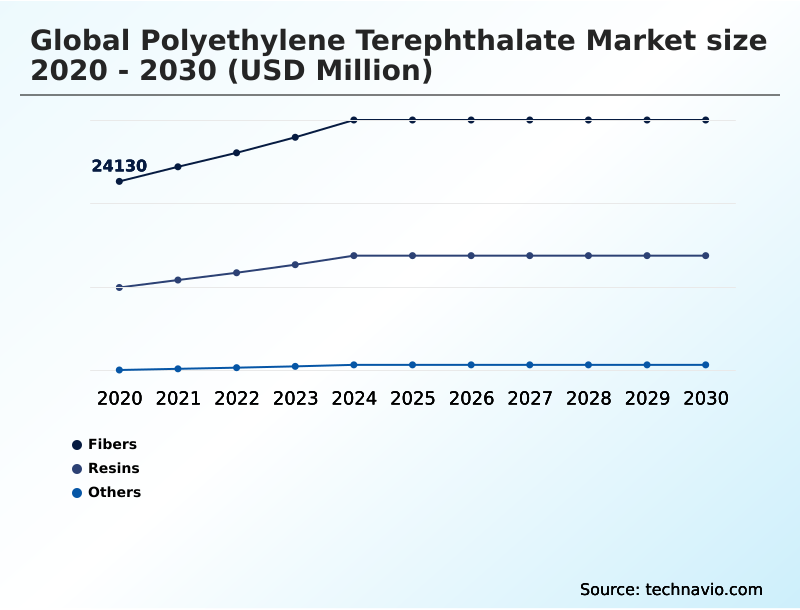
The Fibers segment was valued at USD 31.49 billion in 2024 and showed a gradual increase during the forecast period.
Get Free Sample

Regional Analysis

APAC is estimated to contribute 51.5% to the growth of the global market during the forecast period.Technavio’s analysts have elaborately explained the regional trends and drivers that shape the market during the forecast period.
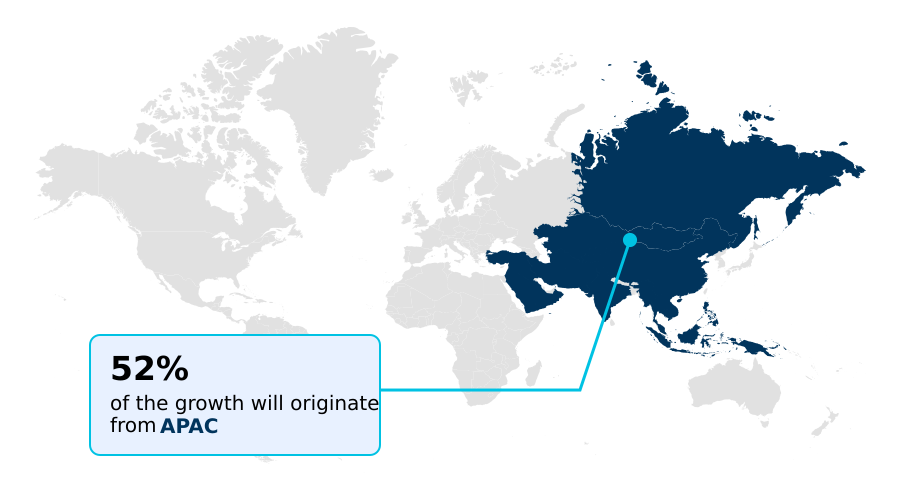
See How Polyethylene Terephthalate Market Demand is Rising in APAC Get Free Sample

The geographic distribution of the Global Polyethylene Terephthalate Market 2026-2030 reveals distinct structural variations in manufacturing capacity and circular economy integration between APAC and Europe.

APAC dominates the production of synthetic polymer resins, maintaining a 42% cost advantage in base manufacturing over European facilities due to highly concentrated industrial geotextile fabrics output and localized feedstock proximity.

Conversely, Europe leads in regulatory-driven sustainability, where stringent environmental mandates force a rapid transition toward closed-loop manufacturing models and localized bottle-to-bottle processing.

To reduce regional greenhouse gas footprints, European converters have increased their post-consumer resin integration rates by 28% across rigid packaging and injection-molded structural housings portfolios.

Meanwhile, advancements in solid-state polycondensation allow both regions to engineer sophisticated aliphatic-aromatic copolyesters for high-performance applications, though APAC remains the primary volume driver for foundational circular economy integration.

Market Dynamics

Our researchers analyzed the data with 2025 as the base year, along with the key drivers, trends, and challenges. A holistic analysis of drivers will help companies refine their marketing strategies to gain a competitive advantage.

  • The Polyethylene Terephthalate Market operates as a foundational pillar within modern packaging and industrial manufacturing sectors, characterized by a continuous drive toward operational efficiency and structural sustainability. Retailers and food distributors increasingly rely on thermoformed fresh produce clamshell containers to protect perishable goods during complex logistics operations, drastically reducing transit spoilage rates.
  • To align with rigorous environmental compliance standards, industry leaders are heavily investing in high-capacity food-grade mechanical bottle recycling systems, enabling the seamless conversion of post-consumer waste into premium reusable resins. This closed-loop approach allows converters to utilize approximately a third less virgin raw material compared to traditional single-use manufacturing models, directly supporting corporate decarbonization targets.
  • Furthermore, material scientists are rapidly advancing bio-based monoethylene glycol synthetic pathways to decouple essential polymer production from volatile petrochemical supply chains. Beyond conventional packaging, the transportation sector is aggressively adopting automotive lightweighting polyester structural components to meet strict fuel efficiency and emission regulations without compromising vehicle safety or interior durability.
  • Concurrently, packaging engineers prioritize precision stretch blow molded container lightweighting techniques to minimize material volume per unit while preserving exceptional gas barrier properties. By integrating these advanced engineering processes and sustainable raw material streams, businesses effectively navigate tightening regulatory frameworks while maintaining resilient and cost-efficient global supply networks.
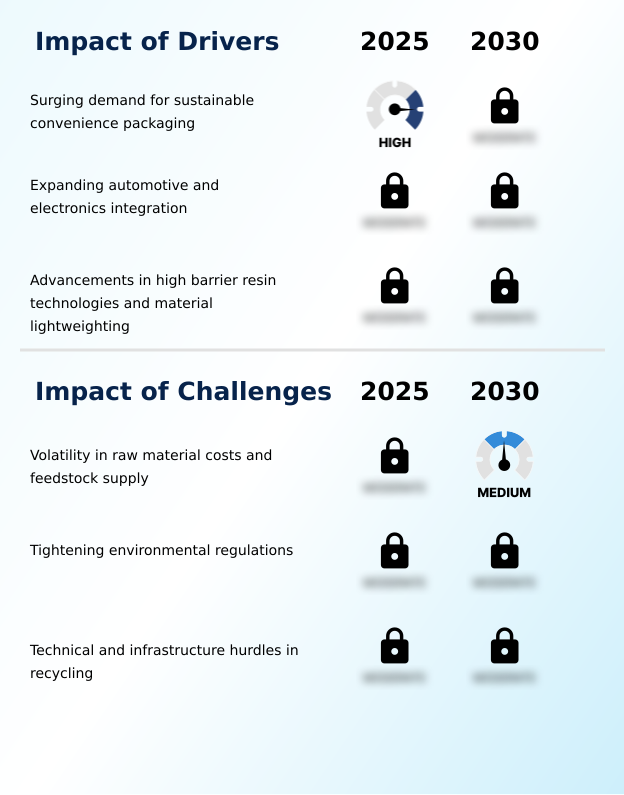
What are the key market drivers leading to the rise in the adoption of Polyethylene Terephthalate Industry?

  • Surging demand for sustainable convenience packaging acts as a primary market driver.

  • The Global Polyethylene Terephthalate Market 2026-2030 is propelled by surging demand for sustainable, shatterproof packaging across rapidly expanding retail and quick-commerce distribution channels.
  • Beverage and food manufacturers are aggressively adopting high-precision stretch blow molding equipment to produce lightweight thermoformed clamshell containers, significantly improving freight logistics.
  • By utilizing oxygen-scavenging additives and passive plasma coatings, consumer goods companies have extended the shelf life of single-serve processed food by 18%, reducing localized spoilage rates compared to legacy glass packaging.
  • This shift directly addresses the need for enhanced moisture barrier performance and structural durability enhancement in complex supply chains.
  • Additionally, automotive manufacturers are leveraging lightweight structural properties and high-performance automotive interior insulation to achieve superior dielectric strength optimization in electric vehicle assembly lines.

What are the market trends shaping the Polyethylene Terephthalate Industry?

  • Acceleration of quick commerce cold-chain packaging solutions represents a prominent market trend. This development drives demand for rigid, automated delivery structures.

  • The Global Polyethylene Terephthalate Market 2026-2030 is experiencing a structural shift as manufacturers integrate bio-based monomer integration to support rapid decarbonization across supply networks. This transition is heavily driven by the commercial scale-up of bio-purified terephthalic acid, allowing brands to reduce fossil fuel dependency without compromising material strength.
  • Consequently, engineering firms are increasingly adopting glass-reinforced engineering compounds and biaxially oriented technical films to support advanced industrial manufacturing, which has improved production energy efficiency by 22% compared to traditional metallic components. Furthermore, the electronics sector is expanding its use of high-barrier optical films and flexible display panels to enable sophisticated micro-encapsulation techniques in consumer devices.
  • Concurrently, the deployment of photovoltaic solar backsheets has enhanced renewable infrastructure longevity, while optimized automated order fulfillment systems lower last-mile freight costs for downstream commercial distributors.

What challenges does the Polyethylene Terephthalate Industry face during its growth?

  • Volatility in raw material costs and feedstock supply remains a critical structural challenge for the industry.

  • The Global Polyethylene Terephthalate Market 2026-2030 faces significant operational constraints stemming from raw material price volatility and highly fragmented collection networks. Unpredictable upstream costs for purified terephthalic acid and monoethylene glycol severely disrupt long-term capacity planning for virgin polymer producers. Downstream, the industry struggles with multi-layer barrier contamination, which degrades the mechanical integrity of post-consumer recycled flakes during reprocessing.
  • To combat these issues, companies are heavily investing in mechanical recycling infrastructure and advanced chemical depolymerization technology, although capital expenditure remains 35% higher than conventional virgin synthesis operations. Expanding extended producer responsibility mandates and inconsistent municipal waste management systems further complicate compliance, while marine freight congestion delays critical feedstock deliveries, challenging the efficacy of localized consumer deposit return schemes.

Exclusive Technavio Analysis on Customer Landscape

The polyethylene terephthalate market forecasting report includes the adoption lifecycle of the market, covering from the innovator’s stage to the laggard’s stage. It focuses on adoption rates in different regions based on penetration. Furthermore, the polyethylene terephthalate market report also includes key purchase criteria and drivers of price sensitivity to help companies evaluate and develop their market growth analysis strategies.
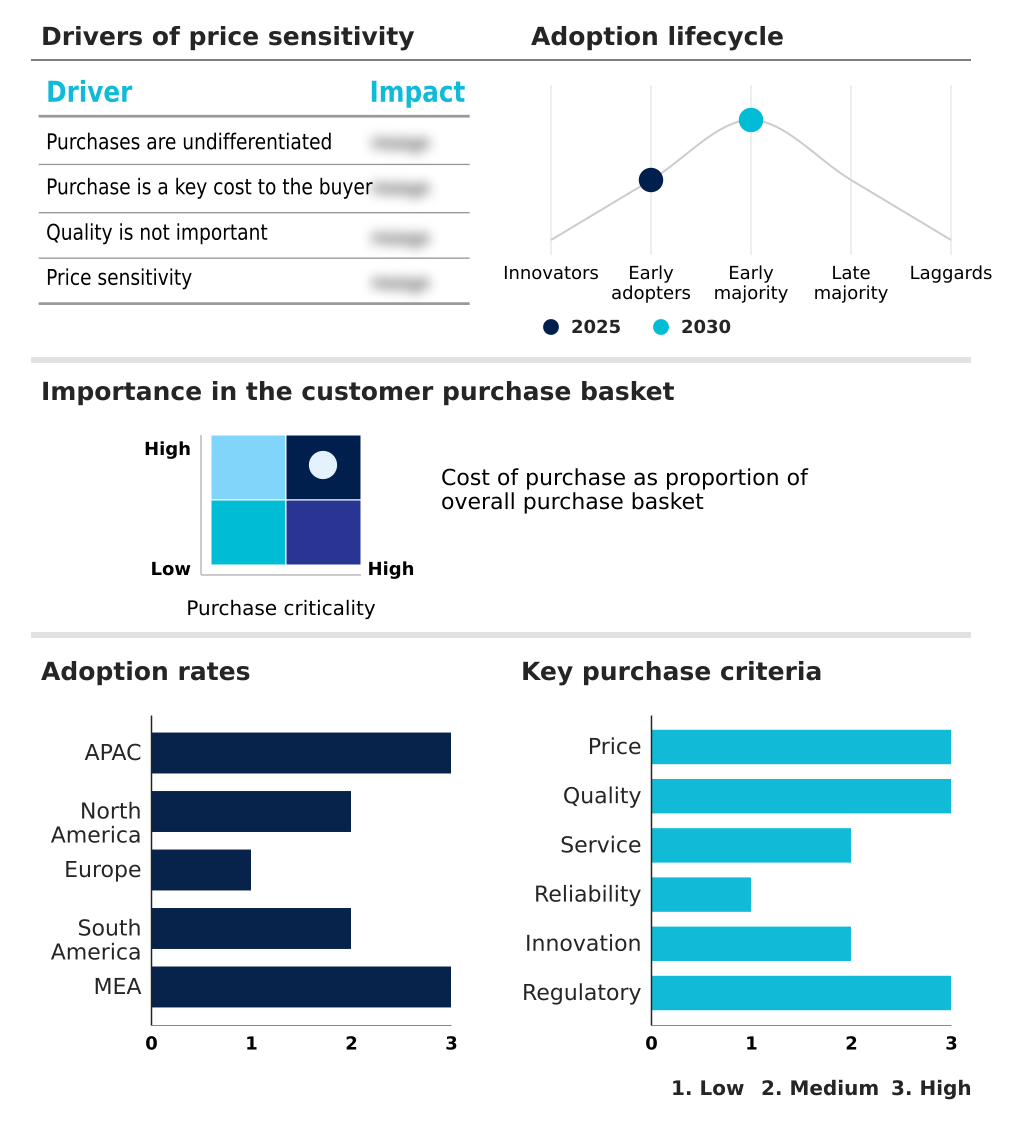
Customer Landscape of Polyethylene Terephthalate Industry

Competitive Landscape

Companies are implementing various strategies, such as strategic alliances, polyethylene terephthalate market forecast, partnerships, mergers and acquisitions, geographical expansion, and product/service launches, to enhance their presence in the industry.

Alpek SAB de CV - Alpek delivers high-quality bottle-grade resins and specialty polymer materials engineered to optimize food packaging durability, beverage container performance, and industrial manufacturing efficiency across diverse end-use applications.

The industry research and growth report includes detailed analyses of the competitive landscape of the market and information about key companies, including:

  • Alpek SAB de CV
  • Eastman Chemical Co.
  • Ester Industries Ltd.
  • Far Eastern New Century Corp.
  • Indorama Ventures Public Co.
  • Kolon Industries Inc.
  • Lotte Chemical Corp.
  • Mitsui Chemicals Inc.
  • Nan Ya Plastic Corp.
  • PetroChina Co. Ltd.
  • Reliance Industries Ltd.
  • Saudi Basic Industries
  • Sinopec Shanghai Co. Ltd.
  • SK Chemicals Co. Ltd.
  • Teijin Ltd.
  • The Mitsubishi Chemical Group
  • Toray Industries Inc.
  • Toyobo Co. Ltd.

Qualitative and quantitative analysis of companies has been conducted to help clients understand the wider business environment as well as the strengths and weaknesses of key industry players. Data is qualitatively analyzed to categorize companies as pure play, category-focused, industry-focused, and diversified; it is quantitatively analyzed to categorize companies as dominant, leading, strong, tentative, and weak.

Recent Development and News in Polyethylene terephthalate market

  • In the Commodity Chemicals industry, the widespread adoption of stringent extended producer responsibility regulations has mandated higher utilization of high-purity recycled resins, directly impacting Polyethylene Terephthalate demand by accelerating investments in advanced chemical depolymerization technology.
  • In the Commodity Chemicals industry, the shift toward sustainable industrial feedstocks prompted major petrochemical producers to scale up bio-based monomer integration, directly impacting Polyethylene Terephthalate supply chains by enabling the commercialization of partially bio-sourced aliphatic-aromatic copolyesters.
  • In the Commodity Chemicals industry, sustained volatility in crude oil refining economics caused significant margin fluctuations for primary petrochemical derivatives, directly impacting Polyethylene Terephthalate pricing due to the unpredictable supply costs of purified terephthalic acid and monoethylene glycol.
  • In the Commodity Chemicals industry, the rapid deployment of automated solid-state polycondensation infrastructure improved overall polymer synthesis efficiency by approximately 15%, directly impacting Polyethylene Terephthalate manufacturing capabilities for specialized medical-grade container integrity applications.

Dive into Technavio’s robust research methodology, blending expert interviews, extensive data synthesis, and validated models for unparalleled Polyethylene Terephthalate Market insights. See full methodology.

Market Scope
Page number 304
Base year 2025
Historic period 2020-2024
Forecast period 2026-2030
Growth momentum & CAGR Accelerate at a CAGR of 8.7%
Market growth 2026-2030 USD 27138.3 million
Market structure Fragmented
YoY growth 2025-2026(%) 8.0%
Key countries China, India, Japan, South Korea, Indonesia, Australia, US, Canada, Mexico, Germany, France, UK, Italy, Spain, The Netherlands, Brazil, Argentina, Chile, Turkey, Saudi Arabia, UAE, South Africa and Israel
Competitive landscape Leading Companies, Market Positioning of Companies, Competitive Strategies, and Industry Risks

Request Free Sample

Research Analyst Overview

  • The Polyethylene Terephthalate Market is undergoing a rapid technological evolution driven by uncompromising corporate sustainability commitments and stringent international packaging regulations. Boardroom executives are fundamentally restructuring their long-term product strategies by pivoting away from virgin synthetic polymer resins toward fully circular material ecosystems.
  • This strategic shift has accelerated massive capital investments into advanced mechanical recycling infrastructure and scalable chemical depolymerization technology, enabling the efficient reprocessing of contaminated waste streams. Consequently, manufacturing facilities utilizing high-purity post-consumer recycled flakes have reduced their reliance on volatile upstream feedstocks by 22% compared to traditional petrochemical sourcing models.
  • The supply chain stability of core precursors, including purified terephthalic acid and monoethylene glycol, remains critical to maintaining profitable production margins amid fluctuating global energy costs. Furthermore, the industrial sector continues to expand its deployment of high-performance biaxially oriented technical films for sensitive electronic and solar applications.
  • These specialized structural materials provide unparalleled dielectric strength and thermal resistance, ensuring robust operational continuity across complex technical manufacturing environments.

What are the Key Data Covered in this Polyethylene Terephthalate Market Research and Growth Report?

  • What is the expected growth of the Polyethylene Terephthalate Market between 2026 and 2030?

    • USD 27.14 billion, at a CAGR of 8.7%

  • What segmentation does the market report cover?

    • The report is segmented by Product (Fibers, Resins, and Others), Type (Virgin, and Recycled), End-user (Food and beverage, Textiles, Healthcare, and Others) and Geography (APAC, North America, Europe, South America, Middle East and Africa)

  • Which regions are analyzed in the report?

    • APAC, North America, Europe, South America and Middle East and Africa

  • What are the key growth drivers and market challenges?

    • Surging demand for sustainable convenience packaging, Volatility in raw material costs and feedstock supply

  • Who are the major players in the Polyethylene Terephthalate Market?

    • Alpek SAB de CV, Eastman Chemical Co., Ester Industries Ltd., Far Eastern New Century Corp., Indorama Ventures Public Co., Kolon Industries Inc., Lotte Chemical Corp., Mitsui Chemicals Inc., Nan Ya Plastic Corp., PetroChina Co. Ltd., Reliance Industries Ltd., Saudi Basic Industries, Sinopec Shanghai Co. Ltd., SK Chemicals Co. Ltd., Teijin Ltd., The Mitsubishi Chemical Group, Toray Industries Inc. and Toyobo Co. Ltd.

Market Research Insights

  • The Polyethylene Terephthalate Market demonstrates strong fundamental stability as industries aggressively optimize their primary material supply chains. By leveraging lightweight structural properties, packaging converters have reduced logistics overhead costs by 16% compared to legacy metal alternatives.
  • The growing reliance on closed-loop manufacturing models allows major consumer brands to boost their integration of recycled content, which subsequently lowers carbon emissions by 24% per production cycle. Furthermore, superior moisture barrier performance remains critical for preserving product integrity in rapidly expanding automated order fulfillment centers.
  • As fast fashion supply chains demand higher-tenacity synthetic yarns, polymer engineering advancements continue to support significant operational efficiencies and structural resilience across diverse commercial applications.

We can help! Our analysts can customize this polyethylene terephthalate market research report to meet your requirements.

Get in touch

1. Executive Summary

1.1 Market overview

Executive Summary - Chart on Market Overview
Executive Summary - Data Table on Market Overview
Executive Summary - Chart on Global Market Characteristics
Executive Summary - Chart on Market by Geography
Executive Summary - Chart on Market Segmentation by Product
Executive Summary - Chart on Market Segmentation by Type
Executive Summary - Chart on Market Segmentation by End-user
Executive Summary - Chart on Incremental Growth
Executive Summary - Data Table on Incremental Growth
Executive Summary - Chart on Company Market Positioning

2. Technavio Analysis

2.1 Analysis of price sensitivity, lifecycle, customer purchase basket, adoption rates, and purchase criteria

2.2 Criticality of inputs and Factors of differentiation

Chart on Overview on criticality of inputs and factors of differentiation

2.3 Factors of disruption

Chart on Overview on factors of disruption

2.4 Impact of drivers and challenges

Chart on Impact of drivers and challenges in 2025 and 2030

3. Market Landscape

3.1 Market ecosystem

Chart on Parent Market
Data Table on - Parent Market

3.2 Market characteristics

Chart on Market characteristics analysis

3.3 Value chain analysis

Chart on Value chain analysis

4. Market Sizing

4.1 Market definition

Data Table on Offerings of companies included in the market definition

4.2 Market segment analysis

Market segments

4.3 Market size 2025

4.4 Market outlook: Forecast for 2025-2030

Chart on Global - Market size and forecast 2025-2030 ($ million)
Data Table on Global - Market size and forecast 2025-2030 ($ million)
Chart on Global Market: Year-over-year growth 2025-2030 (%)
Data Table on Global Market: Year-over-year growth 2025-2030 (%)

5. Historic Market Size

5.1 Global Polyethylene Terephthalate Market 2020 - 2024

Historic Market Size - Data Table on Global Polyethylene Terephthalate Market 2020 - 2024 ($ million)

5.2 Product segment analysis 2020 - 2024

Historic Market Size - Product Segment 2020 - 2024 ($ million)

5.3 Type segment analysis 2020 - 2024

Historic Market Size - Type Segment 2020 - 2024 ($ million)

5.4 End-user segment analysis 2020 - 2024

Historic Market Size - End-user Segment 2020 - 2024 ($ million)

5.5 Geography segment analysis 2020 - 2024

Historic Market Size - Geography Segment 2020 - 2024 ($ million)

5.6 Country segment analysis 2020 - 2024

Historic Market Size - Country Segment 2020 - 2024 ($ million)

6. Qualitative Analysis

6.1 Impact of AI on Global Polyethylene Terephthalate Market

6.2 Impact of Geopolitical Conflicts on Global Polyethylene Terephthalate Market

7. Five Forces Analysis

7.1 Five forces summary

Five forces analysis - Comparison between 2025 and 2030

7.2 Bargaining power of buyers

Bargaining power of buyers - Impact of key factors 2025 and 2030

7.3 Bargaining power of suppliers

Bargaining power of suppliers - Impact of key factors in 2025 and 2030

7.4 Threat of new entrants

Threat of new entrants - Impact of key factors in 2025 and 2030

7.5 Threat of substitutes

Threat of substitutes - Impact of key factors in 2025 and 2030

7.6 Threat of rivalry

Threat of rivalry - Impact of key factors in 2025 and 2030

7.7 Market condition

Chart on Market condition - Five forces 2025 and 2030

8. Market Segmentation by Product

8.1 Market segments

Chart on Product - Market share 2025-2030 (%)
Data Table on Product - Market share 2025-2030 (%)

8.2 Comparison by Product

Chart on Comparison by Product
Data Table on Comparison by Product

8.3 Fibers - Market size and forecast 2025-2030

Chart on Fibers - Market size and forecast 2025-2030 ($ million)
Data Table on Fibers - Market size and forecast 2025-2030 ($ million)
Chart on Fibers - Year-over-year growth 2025-2030 (%)
Data Table on Fibers - Year-over-year growth 2025-2030 (%)

8.4 Resins - Market size and forecast 2025-2030

Chart on Resins - Market size and forecast 2025-2030 ($ million)
Data Table on Resins - Market size and forecast 2025-2030 ($ million)
Chart on Resins - Year-over-year growth 2025-2030 (%)
Data Table on Resins - Year-over-year growth 2025-2030 (%)

8.5 Others - Market size and forecast 2025-2030

Chart on Others - Market size and forecast 2025-2030 ($ million)
Data Table on Others - Market size and forecast 2025-2030 ($ million)
Chart on Others - Year-over-year growth 2025-2030 (%)
Data Table on Others - Year-over-year growth 2025-2030 (%)

8.6 Market opportunity by Product

Market opportunity by Product ($ million)
Data Table on Market opportunity by Product ($ million)

9. Market Segmentation by Type

9.1 Market segments

Chart on Type - Market share 2025-2030 (%)
Data Table on Type - Market share 2025-2030 (%)

9.2 Comparison by Type

Chart on Comparison by Type
Data Table on Comparison by Type

9.3 Virgin - Market size and forecast 2025-2030

Chart on Virgin - Market size and forecast 2025-2030 ($ million)
Data Table on Virgin - Market size and forecast 2025-2030 ($ million)
Chart on Virgin - Year-over-year growth 2025-2030 (%)
Data Table on Virgin - Year-over-year growth 2025-2030 (%)

9.4 Recycled - Market size and forecast 2025-2030

Chart on Recycled - Market size and forecast 2025-2030 ($ million)
Data Table on Recycled - Market size and forecast 2025-2030 ($ million)
Chart on Recycled - Year-over-year growth 2025-2030 (%)
Data Table on Recycled - Year-over-year growth 2025-2030 (%)

9.5 Market opportunity by Type

Market opportunity by Type ($ million)
Data Table on Market opportunity by Type ($ million)

10. Market Segmentation by End-user

10.1 Market segments

Chart on End-user - Market share 2025-2030 (%)
Data Table on End-user - Market share 2025-2030 (%)

10.2 Comparison by End-user

Chart on Comparison by End-user
Data Table on Comparison by End-user

10.3 Food and beverage - Market size and forecast 2025-2030

Chart on Food and beverage - Market size and forecast 2025-2030 ($ million)
Data Table on Food and beverage - Market size and forecast 2025-2030 ($ million)
Chart on Food and beverage - Year-over-year growth 2025-2030 (%)
Data Table on Food and beverage - Year-over-year growth 2025-2030 (%)

10.4 Textiles - Market size and forecast 2025-2030

Chart on Textiles - Market size and forecast 2025-2030 ($ million)
Data Table on Textiles - Market size and forecast 2025-2030 ($ million)
Chart on Textiles - Year-over-year growth 2025-2030 (%)
Data Table on Textiles - Year-over-year growth 2025-2030 (%)

10.5 Healthcare - Market size and forecast 2025-2030

Chart on Healthcare - Market size and forecast 2025-2030 ($ million)
Data Table on Healthcare - Market size and forecast 2025-2030 ($ million)
Chart on Healthcare - Year-over-year growth 2025-2030 (%)
Data Table on Healthcare - Year-over-year growth 2025-2030 (%)

10.6 Others - Market size and forecast 2025-2030

Chart on Others - Market size and forecast 2025-2030 ($ million)
Data Table on Others - Market size and forecast 2025-2030 ($ million)
Chart on Others - Year-over-year growth 2025-2030 (%)
Data Table on Others - Year-over-year growth 2025-2030 (%)

10.7 Market opportunity by End-user

Market opportunity by End-user ($ million)
Data Table on Market opportunity by End-user ($ million)

11. Customer Landscape

11.1 Customer landscape overview

Analysis of price sensitivity, lifecycle, customer purchase basket, adoption rates, and purchase criteria

12. Geographic Landscape

12.1 Geographic segmentation

Chart on Market share by geography 2025-2030 (%)
Data Table on Market share by geography 2025-2030 (%)

12.2 Geographic comparison

Chart on Geographic comparison
Data Table on Geographic comparison

12.3 APAC - Market size and forecast 2025-2030

Chart on APAC - Market size and forecast 2025-2030 ($ million)
Data Table on APAC - Market size and forecast 2025-2030 ($ million)
Chart on APAC - Year-over-year growth 2025-2030 (%)
Data Table on APAC - Year-over-year growth 2025-2030 (%)
Chart on Regional Comparison - APAC
Data Table on Regional Comparison - APAC

12.3.1 China - Market size and forecast 2025-2030

Chart on China - Market size and forecast 2025-2030 ($ million)
Data Table on China - Market size and forecast 2025-2030 ($ million)
Chart on China - Year-over-year growth 2025-2030 (%)
Data Table on China - Year-over-year growth 2025-2030 (%)

12.3.2 India - Market size and forecast 2025-2030

Chart on India - Market size and forecast 2025-2030 ($ million)
Data Table on India - Market size and forecast 2025-2030 ($ million)
Chart on India - Year-over-year growth 2025-2030 (%)
Data Table on India - Year-over-year growth 2025-2030 (%)

12.3.3 Japan - Market size and forecast 2025-2030

Chart on Japan - Market size and forecast 2025-2030 ($ million)
Data Table on Japan - Market size and forecast 2025-2030 ($ million)
Chart on Japan - Year-over-year growth 2025-2030 (%)
Data Table on Japan - Year-over-year growth 2025-2030 (%)

12.3.4 South Korea - Market size and forecast 2025-2030

Chart on South Korea - Market size and forecast 2025-2030 ($ million)
Data Table on South Korea - Market size and forecast 2025-2030 ($ million)
Chart on South Korea - Year-over-year growth 2025-2030 (%)
Data Table on South Korea - Year-over-year growth 2025-2030 (%)

12.3.5 Indonesia - Market size and forecast 2025-2030

Chart on Indonesia - Market size and forecast 2025-2030 ($ million)
Data Table on Indonesia - Market size and forecast 2025-2030 ($ million)
Chart on Indonesia - Year-over-year growth 2025-2030 (%)
Data Table on Indonesia - Year-over-year growth 2025-2030 (%)

12.3.6 Australia - Market size and forecast 2025-2030

Chart on Australia - Market size and forecast 2025-2030 ($ million)
Data Table on Australia - Market size and forecast 2025-2030 ($ million)
Chart on Australia - Year-over-year growth 2025-2030 (%)
Data Table on Australia - Year-over-year growth 2025-2030 (%)

12.4 North America - Market size and forecast 2025-2030

Chart on North America - Market size and forecast 2025-2030 ($ million)
Data Table on North America - Market size and forecast 2025-2030 ($ million)
Chart on North America - Year-over-year growth 2025-2030 (%)
Data Table on North America - Year-over-year growth 2025-2030 (%)
Chart on Regional Comparison - North America
Data Table on Regional Comparison - North America

12.4.1 US - Market size and forecast 2025-2030

Chart on US - Market size and forecast 2025-2030 ($ million)
Data Table on US - Market size and forecast 2025-2030 ($ million)
Chart on US - Year-over-year growth 2025-2030 (%)
Data Table on US - Year-over-year growth 2025-2030 (%)

12.4.2 Canada - Market size and forecast 2025-2030

Chart on Canada - Market size and forecast 2025-2030 ($ million)
Data Table on Canada - Market size and forecast 2025-2030 ($ million)
Chart on Canada - Year-over-year growth 2025-2030 (%)
Data Table on Canada - Year-over-year growth 2025-2030 (%)

12.4.3 Mexico - Market size and forecast 2025-2030

Chart on Mexico - Market size and forecast 2025-2030 ($ million)
Data Table on Mexico - Market size and forecast 2025-2030 ($ million)
Chart on Mexico - Year-over-year growth 2025-2030 (%)
Data Table on Mexico - Year-over-year growth 2025-2030 (%)

12.5 Europe - Market size and forecast 2025-2030

Chart on Europe - Market size and forecast 2025-2030 ($ million)
Data Table on Europe - Market size and forecast 2025-2030 ($ million)
Chart on Europe - Year-over-year growth 2025-2030 (%)
Data Table on Europe - Year-over-year growth 2025-2030 (%)
Chart on Regional Comparison - Europe
Data Table on Regional Comparison - Europe

12.5.1 Germany - Market size and forecast 2025-2030

Chart on Germany - Market size and forecast 2025-2030 ($ million)
Data Table on Germany - Market size and forecast 2025-2030 ($ million)
Chart on Germany - Year-over-year growth 2025-2030 (%)
Data Table on Germany - Year-over-year growth 2025-2030 (%)

12.5.2 France - Market size and forecast 2025-2030

Chart on France - Market size and forecast 2025-2030 ($ million)
Data Table on France - Market size and forecast 2025-2030 ($ million)
Chart on France - Year-over-year growth 2025-2030 (%)
Data Table on France - Year-over-year growth 2025-2030 (%)

12.5.3 UK - Market size and forecast 2025-2030

Chart on UK - Market size and forecast 2025-2030 ($ million)
Data Table on UK - Market size and forecast 2025-2030 ($ million)
Chart on UK - Year-over-year growth 2025-2030 (%)
Data Table on UK - Year-over-year growth 2025-2030 (%)

12.5.4 Italy - Market size and forecast 2025-2030

Chart on Italy - Market size and forecast 2025-2030 ($ million)
Data Table on Italy - Market size and forecast 2025-2030 ($ million)
Chart on Italy - Year-over-year growth 2025-2030 (%)
Data Table on Italy - Year-over-year growth 2025-2030 (%)

12.5.5 Spain - Market size and forecast 2025-2030

Chart on Spain - Market size and forecast 2025-2030 ($ million)
Data Table on Spain - Market size and forecast 2025-2030 ($ million)
Chart on Spain - Year-over-year growth 2025-2030 (%)
Data Table on Spain - Year-over-year growth 2025-2030 (%)

12.5.6 The Netherlands - Market size and forecast 2025-2030

Chart on The Netherlands - Market size and forecast 2025-2030 ($ million)
Data Table on The Netherlands - Market size and forecast 2025-2030 ($ million)
Chart on The Netherlands - Year-over-year growth 2025-2030 (%)
Data Table on The Netherlands - Year-over-year growth 2025-2030 (%)

12.6 South America - Market size and forecast 2025-2030

Chart on South America - Market size and forecast 2025-2030 ($ million)
Data Table on South America - Market size and forecast 2025-2030 ($ million)
Chart on South America - Year-over-year growth 2025-2030 (%)
Data Table on South America - Year-over-year growth 2025-2030 (%)
Chart on Regional Comparison - South America
Data Table on Regional Comparison - South America

12.6.1 Brazil - Market size and forecast 2025-2030

Chart on Brazil - Market size and forecast 2025-2030 ($ million)
Data Table on Brazil - Market size and forecast 2025-2030 ($ million)
Chart on Brazil - Year-over-year growth 2025-2030 (%)
Data Table on Brazil - Year-over-year growth 2025-2030 (%)

12.6.2 Argentina - Market size and forecast 2025-2030

Chart on Argentina - Market size and forecast 2025-2030 ($ million)
Data Table on Argentina - Market size and forecast 2025-2030 ($ million)
Chart on Argentina - Year-over-year growth 2025-2030 (%)
Data Table on Argentina - Year-over-year growth 2025-2030 (%)

12.6.3 Chile - Market size and forecast 2025-2030

Chart on Chile - Market size and forecast 2025-2030 ($ million)
Data Table on Chile - Market size and forecast 2025-2030 ($ million)
Chart on Chile - Year-over-year growth 2025-2030 (%)
Data Table on Chile - Year-over-year growth 2025-2030 (%)

12.7 Middle East and Africa - Market size and forecast 2025-2030

Chart on Middle East and Africa - Market size and forecast 2025-2030 ($ million)
Data Table on Middle East and Africa - Market size and forecast 2025-2030 ($ million)
Chart on Middle East and Africa - Year-over-year growth 2025-2030 (%)
Data Table on Middle East and Africa - Year-over-year growth 2025-2030 (%)
Chart on Regional Comparison - Middle East and Africa
Data Table on Regional Comparison - Middle East and Africa

12.7.1 Turkey - Market size and forecast 2025-2030

Chart on Turkey - Market size and forecast 2025-2030 ($ million)
Data Table on Turkey - Market size and forecast 2025-2030 ($ million)
Chart on Turkey - Year-over-year growth 2025-2030 (%)
Data Table on Turkey - Year-over-year growth 2025-2030 (%)

12.7.2 Saudi Arabia - Market size and forecast 2025-2030

Chart on Saudi Arabia - Market size and forecast 2025-2030 ($ million)
Data Table on Saudi Arabia - Market size and forecast 2025-2030 ($ million)
Chart on Saudi Arabia - Year-over-year growth 2025-2030 (%)
Data Table on Saudi Arabia - Year-over-year growth 2025-2030 (%)

12.7.3 UAE - Market size and forecast 2025-2030

Chart on UAE - Market size and forecast 2025-2030 ($ million)
Data Table on UAE - Market size and forecast 2025-2030 ($ million)
Chart on UAE - Year-over-year growth 2025-2030 (%)
Data Table on UAE - Year-over-year growth 2025-2030 (%)

12.7.4 South Africa - Market size and forecast 2025-2030

Chart on South Africa - Market size and forecast 2025-2030 ($ million)
Data Table on South Africa - Market size and forecast 2025-2030 ($ million)
Chart on South Africa - Year-over-year growth 2025-2030 (%)
Data Table on South Africa - Year-over-year growth 2025-2030 (%)

12.7.5 Israel - Market size and forecast 2025-2030

Chart on Israel - Market size and forecast 2025-2030 ($ million)
Data Table on Israel - Market size and forecast 2025-2030 ($ million)
Chart on Israel - Year-over-year growth 2025-2030 (%)
Data Table on Israel - Year-over-year growth 2025-2030 (%)

12.8 Market opportunity by geography

Market opportunity by geography ($ million)
Data Tables on Market opportunity by geography ($ million)

13. Drivers, Challenges, and Opportunity

13.1 Market drivers

Surging demand for sustainable convenience packaging
Expanding automotive and electronics integration
Advancements in high barrier resin technologies and material lightweighting

13.2 Market challenges

Volatility in raw material costs and feedstock supply
Tightening environmental regulations
Technical and infrastructure hurdles in recycling

13.3 Impact of drivers and challenges

Impact of drivers and challenges in 2025 and 2030

13.4 Market opportunities

Acceleration of quick commerce cold-chain packaging solutions
Expansion into specialty polyesters and engineering compounds
Rapid integration of bio-based monomers

14. Competitive Landscape

14.1 Overview

14.2

Overview on criticality of inputs and factors of differentiation

14.3 Landscape disruption

Overview on factors of disruption

14.4 Industry risks

Impact of key risks on business

15. Competitive Analysis

15.1 Companies profiled

Companies covered

15.2 Company ranking index

15.3 Market positioning of companies

Matrix on companies position and classification

15.4 Alpek SAB de CV

Alpek SAB de CV - Overview
Alpek SAB de CV - Business segments
Alpek SAB de CV - Key offerings
Alpek SAB de CV - Segment focus
SWOT

15.5 Eastman Chemical Co.

Eastman Chemical Co. - Overview
Eastman Chemical Co. - Business segments
Eastman Chemical Co. - Key offerings
Eastman Chemical Co. - Segment focus
SWOT

15.6 Far Eastern New Century Corp.

Far Eastern New Century Corp. - Overview
Far Eastern New Century Corp. - Business segments
Far Eastern New Century Corp. - Key offerings
Far Eastern New Century Corp. - Segment focus
SWOT

15.7 Indorama Ventures Public Co.

Indorama Ventures Public Co. - Overview
Indorama Ventures Public Co. - Business segments
Indorama Ventures Public Co. - Key offerings
Indorama Ventures Public Co. - Segment focus
SWOT

15.8 Kolon Industries Inc.

Kolon Industries Inc. - Overview
Kolon Industries Inc. - Business segments
Kolon Industries Inc. - Key offerings
Kolon Industries Inc. - Segment focus
SWOT

15.9 Lotte Chemical Corp.

Lotte Chemical Corp. - Overview
Lotte Chemical Corp. - Business segments
Lotte Chemical Corp. - Key offerings
Lotte Chemical Corp. - Segment focus
SWOT

15.10 Mitsui Chemicals Inc.

Mitsui Chemicals Inc. - Overview
Mitsui Chemicals Inc. - Business segments
Mitsui Chemicals Inc. - Key offerings
Mitsui Chemicals Inc. - Segment focus
SWOT

15.11 Nan Ya Plastic Corp.

Nan Ya Plastic Corp. - Overview
Nan Ya Plastic Corp. - Business segments
Nan Ya Plastic Corp. - Key offerings
Nan Ya Plastic Corp. - Segment focus
SWOT

15.12 PetroChina Co. Ltd.

PetroChina Co. Ltd. - Overview
PetroChina Co. Ltd. - Business segments
PetroChina Co. Ltd. - Key offerings
PetroChina Co. Ltd. - Segment focus
SWOT

15.13 Reliance Industries Ltd.

Reliance Industries Ltd. - Overview
Reliance Industries Ltd. - Business segments
Reliance Industries Ltd. - Key offerings
Reliance Industries Ltd. - Segment focus
SWOT

15.14 Saudi Basic Industries

Saudi Basic Industries - Overview
Saudi Basic Industries - Business segments
Saudi Basic Industries - Key offerings
Saudi Basic Industries - Segment focus
SWOT

15.15 Sinopec Shanghai Co. Ltd.

Sinopec Shanghai Co. Ltd. - Overview
Sinopec Shanghai Co. Ltd. - Business segments
Sinopec Shanghai Co. Ltd. - Key offerings
Sinopec Shanghai Co. Ltd. - Segment focus
SWOT

15.16 Teijin Ltd.

Teijin Ltd. - Overview
Teijin Ltd. - Business segments
Teijin Ltd. - Key offerings
Teijin Ltd. - Segment focus
SWOT

15.17 The Mitsubishi Chemical Group

The Mitsubishi Chemical Group - Overview
The Mitsubishi Chemical Group - Business segments
The Mitsubishi Chemical Group - Key news
The Mitsubishi Chemical Group - Key offerings
The Mitsubishi Chemical Group - Segment focus
SWOT

15.18 Toray Industries Inc.

Toray Industries Inc. - Overview
Toray Industries Inc. - Business segments
Toray Industries Inc. - Key news
Toray Industries Inc. - Key offerings
Toray Industries Inc. - Segment focus
SWOT

16. Appendix

16.1 Scope of the report

Market definition
Objectives
Notes and caveats

16.2 Inclusions and exclusions checklist

Inclusions checklist
Exclusions checklist

16.3 Currency conversion rates for US$

16.4 Research methodology

16.5 Data procurement

Information sources

16.6 Data validation

16.7 Validation techniques employed for market sizing

16.8 Data synthesis

16.9 360 degree market analysis

16.10 List of abbreviations

Research Methodology

Technavio presents a detailed picture of the market by way of study, synthesis, and summation of data from multiple sources. The analysts have presented the various facets of the market with a particular focus on identifying the key industry influencers. The data thus presented is comprehensive, reliable, and the result of extensive research, both primary and secondary.

INFORMATION SOURCES

Primary sources

  • Manufacturers and suppliers
  • Channel partners
  • Industry experts
  • Strategic decision makers

Secondary sources

  • Industry journals and periodicals
  • Government data
  • Financial reports of key industry players
  • Historical data
  • Press releases

DATA ANALYSIS

Data Synthesis

  • Collation of data
  • Estimation of key figures
  • Analysis of derived insights

Data Validation

  • Triangulation with data models
  • Reference against proprietary databases
  • Corroboration with industry experts

REPORT WRITING

Qualitative

  • Market drivers
  • Market challenges
  • Market trends
  • Five forces analysis

Quantitative

  • Market size and forecast
  • Market segmentation
  • Geographical insights
  • Competitive landscape

Interested in this report?

Get your sample now to see our research methodology and insights!

Download Now

Frequently Asked Questions

Polyethylene Terephthalate market growth will increase by USD 27138.3 million during 2026-2030.

The Polyethylene Terephthalate market is expected to grow at a CAGR of 8.7% during 2026-2030.

Polyethylene Terephthalate market is segmented by Product (Fibers, Resins, Others) Type (Virgin, Recycled) End-user (Food and beverage, Textiles, Healthcare, Others)

Alpek SAB de CV, Eastman Chemical Co., Ester Industries Ltd., Far Eastern New Century Corp., Indorama Ventures Public Co., Kolon Industries Inc., Lotte Chemical Corp., Mitsui Chemicals Inc., Nan Ya Plastic Corp., PetroChina Co. Ltd., Reliance Industries Ltd., Saudi Basic Industries, Sinopec Shanghai Co. Ltd., SK Chemicals Co. Ltd., Teijin Ltd., The Mitsubishi Chemical Group, Toray Industries Inc., Toyobo Co. Ltd. are a few of the key vendors in the Polyethylene Terephthalate market.

APAC will register the highest growth rate of 51.5% among the other regions. Therefore, the Polyethylene Terephthalate market in APAC is expected to garner significant business opportunities for the vendors during the forecast period.

China, India, Japan, South Korea, Indonesia, Australia, US, Canada, Mexico, Germany, France, UK, Italy, Spain, The Netherlands, Brazil, Argentina, Chile, Turkey, Saudi Arabia, UAE, South Africa, Israel

  • Surging demand for sustainable convenience packaging is the driving factor this market.

The Polyethylene Terephthalate market vendors should focus on grabbing business opportunities from the Product segment as it accounted for the largest market share in the base year.
RIA - Research AI Assistant
Ask RIA
