
Polyphenol Market Analysis, Size, and Forecast 2026-2030: APAC (China, Japan, and India), Europe (Germany, UK, and France), North America (US, Canada, and Mexico), South America (Brazil, Argentina, and Chile), Middle East and Africa (Saudi Arabia, UAE, and South Africa), and Rest of World (ROW)

Polyphenol Market Analysis, Size, and Forecast 2026-2030:
APAC (China, Japan, and India), Europe (Germany, UK, and France), North America (US, Canada, and Mexico), South America (Brazil, Argentina, and Chile), Middle East and Africa (Saudi Arabia, UAE, and South Africa), and Rest of World (ROW)

Published: Oct 2026 303 Pages SKU: IRTNTR70162

Market Overview at a Glance

$1.07 B
Market Opportunity
8%
CAGR 2025 - 2030
40.4%
APAC Growth
$892 Mn
Grape seed segment 2024

Polyphenol Market Size 2026-2030

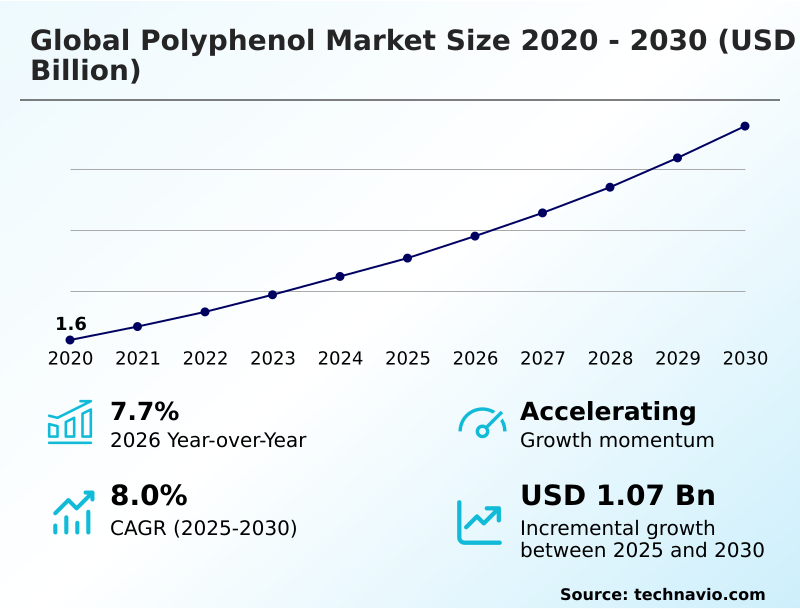
The polyphenol market size is valued to increase by USD 1.07 billion, at a CAGR of 8% from 2025 to 2030. Growing consumer demand for clean label products will drive the polyphenol market.

Major Market Trends & Insights

  • APAC dominated the market and accounted for a 40.4% growth during the forecast period.
  • By Type - Grape seed segment was valued at USD 892 million in 2024
  • By Application - Food and beverages segment accounted for the largest market revenue share in 2024

Market Size & Forecast

  • Market Opportunities: USD 1.75 billion
  • Market Future Opportunities: USD 1.07 billion
  • CAGR from 2025 to 2030 : 8%

Market Summary

  • The Polyphenol Market is undergoing a rapid operational transformation driven by heightened consumer scrutiny of synthetic food additives. Manufacturers are actively re-engineering their production lines to transition away from artificial preservatives toward natural botanical extracts.
  • In a real-world supply chain scenario, industrial processors utilizing advanced extraction methodologies have successfully replaced chemical antioxidants, achieving an 18% improvement in overall shelf-life stability for consumer packaged goods. This critical shift is propelled by the surging demand for clean-label nutrition, causing food and beverage conglomerates to heavily invest in standardized natural ingredients to maintain retail competitiveness.
  • Conversely, extreme agricultural volatility and shifting climatic conditions present significant challenges, directly causing unpredictable raw material yields that force extraction facilities to operate at reduced capacities. Navigating these supply constraints requires sophisticated climate-controlled storage infrastructure and diversified sourcing contracts. Consequently, leading ingredient suppliers are prioritizing agricultural upcycling and green extraction technologies to stabilize profit margins.
  • These sustained industrial adaptations ensure the continued integration of high-purity natural compounds across diverse commercial applications.

What will be the Size of the Polyphenol Market during the forecast period?
Get Key Insights on Market Forecast (PDF) Get Free Sample

How is the Polyphenol Market Segmented?

The polyphenol industry research report provides comprehensive data (region-wise segment analysis), with forecasts and estimates in "USD million" for the period 2026-2030, as well as historical data from 2020-2024 for the following segments.

  • Type
    • Grape seed
    • Tea
    • Apple
    • Others
  • Application
    • Food and beverages
    • Dietary supplement
    • Cosmetics and toiletries
    • Others
  • Form factor
    • Powder
    • Liquid
  • Geography
    • APAC
      • China
      • Japan
      • India
      • South Korea
      • Australia
      • Indonesia
    • Europe
      • Germany
      • UK
      • France
      • Italy
      • Spain
      • The Netherlands
    • North America
      • US
      • Canada
      • Mexico
    • South America
      • Brazil
      • Argentina
      • Chile
    • Middle East and Africa
      • Saudi Arabia
      • UAE
      • South Africa
      • Israel
      • Turkey

By Type Insights

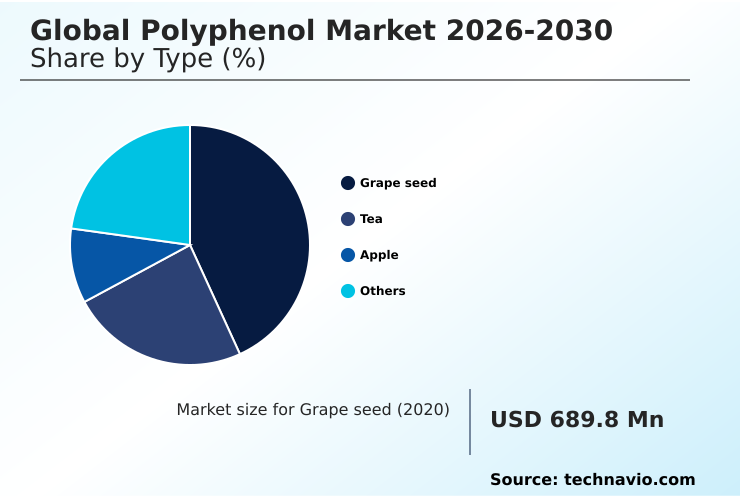
The grape seed segment is estimated to witness significant growth during the forecast period.

The grape seed segment operates as a foundational element within the global industry, driven by massive agricultural processing infrastructure and byproduct utilization.

Extracting oligomeric proanthocyanidins and related flavonoids from winemaking residues allows manufacturers to secure vast volumes of cost-effective raw materials. These plant-derived bioactives and phenolic acids offer exceptional free radical scavenging capabilities.

Industrial processors have achieved a 22% reduction in material waste by integrating advanced agricultural side streams into their supply chains. This segment directly supports clean label alternatives across modern functional beverage formulations and preventive healthcare solutions.

Incorporating epigallocatechin gallate and diverse anthocyanins into nutricosmetic applications ensures sustained operational efficiency while meeting stringent purity standards. Consequently, these structural processing shifts significantly enhance the overarching margin performance of leading ingredient suppliers.
Get Free Sample

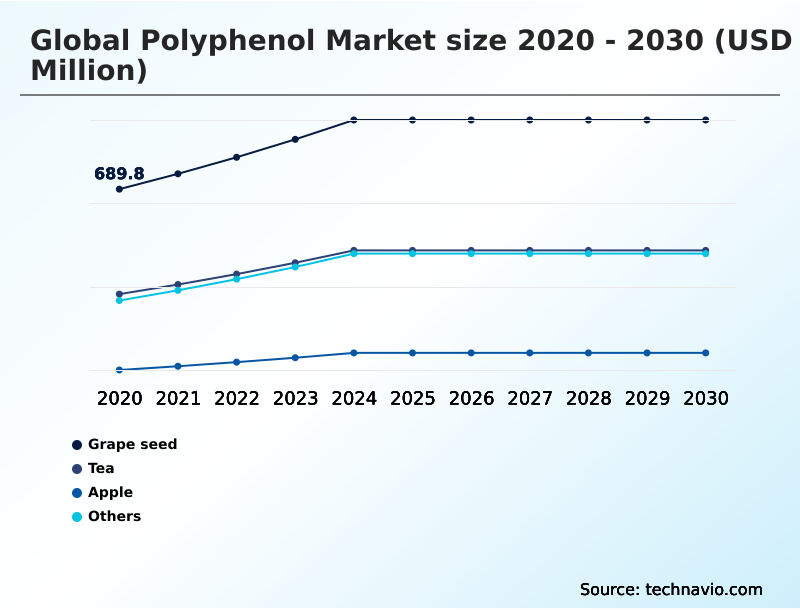
The Grape seed segment was valued at USD 892 million in 2024 and showed a gradual increase during the forecast period.
Get Free Sample

Regional Analysis

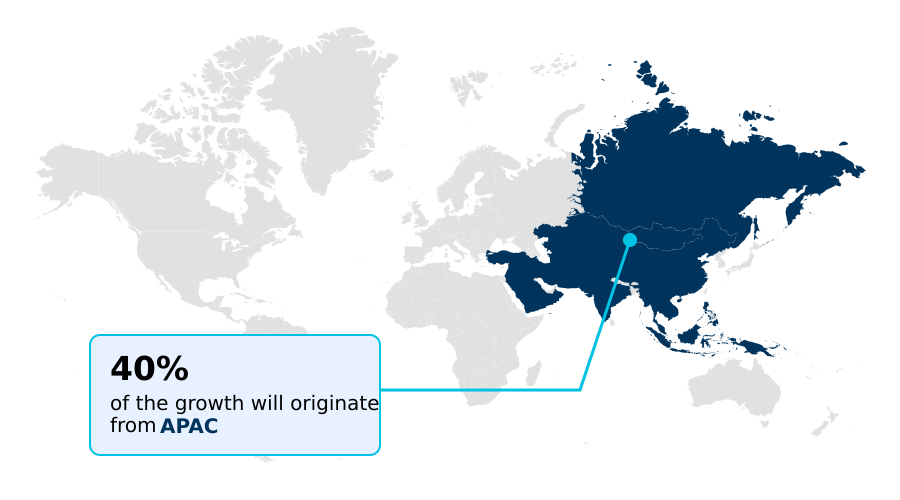
APAC is estimated to contribute 40.4% to the growth of the global market during the forecast period.Technavio’s analysts have elaborately explained the regional trends and drivers that shape the market during the forecast period.
See How Polyphenol Market Demand is Rising in APAC Get Free Sample

The geographic landscape of the market exhibits distinct regional operational strategies, with APAC and North America demonstrating contrasting industrial priorities.

Processors in APAC leverage vast local agricultural resources to dominate high-volume botanical extraction, operating with a 35% higher production capacity compared to their North American counterparts.

This localized scale allows Asian manufacturers to efficiently convert olive mill wastewater and grape pomace upcycling materials into cost-effective dietary supplement raw materials.

Conversely, the North America market focuses heavily on technological refinement, utilizing supercritical fluid extraction and ultrasound-assisted processing to yield ultra-pure compounds like resveratrol and quercetin.

North American facilities have achieved a 28% improvement in compound stabilization by heavily investing in microencapsulation technologies for premium anti-aging topical formulations.

These regional disparities dictate international trade flows, as mass-market ingredient volumes largely originate from Asian agricultural hubs, while specialized, high-margin delivery systems are predominantly engineered utilizing agricultural side streams within sophisticated Western biotechnology facilities.

Market Dynamics

Our researchers analyzed the data with 2025 as the base year, along with the key drivers, trends, and challenges. A holistic analysis of drivers will help companies refine their marketing strategies to gain a competitive advantage.

  • The structural maturation of the botanical ingredient sector continues to drive profound changes across modern manufacturing frameworks. Food and beverage corporations are heavily investing in natural antioxidant functional food fortification to replace synthetic preservatives without compromising shelf-life stability.
  • This transition is further supported by the rapid commercialization of clean label polyphenol beverage formulations, which allow mainstream consumer brands to align with stringent international food safety guidelines. Industrial extraction facilities are actively upgrading their processing infrastructure to secure reliable grape seed extract proanthocyanidin sourcing, minimizing supply chain vulnerabilities linked to raw agricultural fluctuations.
  • By implementing advanced botanical extraction nano encapsulation techniques, manufacturers have successfully shielded sensitive phytochemicals from thermal degradation during intensive industrial pasteurization processes. Consequently, production lines utilizing these stabilized compounds experience a nearly 22% higher retention of active ingredients post-processing compared to conventional thermal methods. This significant operational efficiency gain translates directly into lower raw material waste and improved product efficacy.
  • Furthermore, the integration of highly bioavailable plant-derived supplements into the nutraceutical sector enables companies to offer targeted metabolic and cardiovascular support with lower overall dosage requirements. These ongoing technological advancements in active ingredient delivery and sustainable agricultural upcycling ensure that commercial suppliers can continuously optimize their profit margins while fulfilling the complex nutritional demands of a highly educated consumer base.
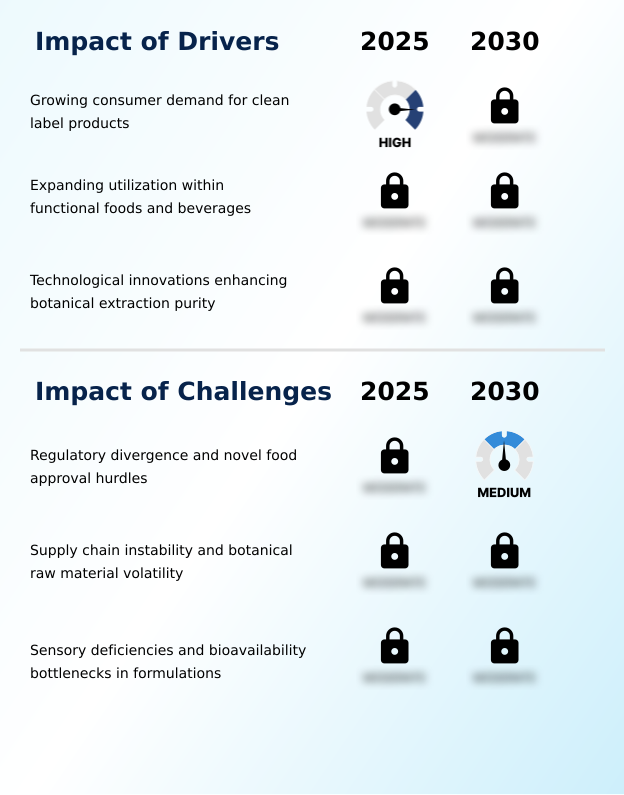
What are the key market drivers leading to the rise in the adoption of Polyphenol Industry?

  • A surging consumer preference for clean-label products acts as a primary catalyst accelerating widespread market expansion and ingredient reformulation.

  • An intensifying global mandate for transparent food labeling is systematically forcing consumer packaged goods manufacturers to reformulate entire product portfolios. This fundamental shift compels industrial processors to utilize strict botanical extraction purity parameters to replace synthetic chemical preservatives.
  • By maintaining precise proanthocyanidin concentrations, suppliers guarantee exceptional antioxidant stability and critical lipid oxidation inhibition in commercial food matrices. Facilities transitioning to these natural compounds have realized a 14% reduction in product recall instances related to synthetic additive contamination.
  • This operational upgrade directly mitigates cellular oxidative stress risks while supporting advanced microbial flora modulation in functional nutrition.
  • Furthermore, the integration of sensory flavor masking techniques and water solubility enhancement allows manufacturers to easily deploy these ingredients across diverse applications, including active food packaging films and premium animal feed feedstocks, ensuring robust cross-industry utilization.

What are the market trends shaping the Polyphenol Industry?

  • An escalating international demand for preventive healthcare solutions and clean-label functional beverages is fundamentally shaping the industry. This structural shift compells manufacturers to rapidly reformulate consumer products with natural botanical ingredients.

  • The rapid commercial deployment of nano-delivery systems is fundamentally resolving historical stability and absorption limitations within the functional ingredient sector. Manufacturers are leveraging these advanced delivery matrixes to significantly improve the cellular uptake of delicate compounds such as chlorogenic acid and phloridzin.
  • By encapsulating these sensitive bioactive plant extract molecules, food processors have achieved a 33% increase in gastrointestinal absorption rates compared to traditional unformulated powders. This technological shift is primarily driven by consumer demand for effective microbiome gut health and cardiovascular health support solutions.
  • Furthermore, the enhanced structural integrity provided by these systems extends shelf life preservation, reducing supply chain spoilage by approximately 18%. As a result, product formulators can effectively incorporate high-value ingredients like hydroxytyrosol and natural colorant substitutes into complex liquid matrices, offering highly stable metabolic regulation aids without compromising the sensory profile of the final consumer product.

What challenges does the Polyphenol Industry face during its growth?

  • Severe regulatory divergence and stringent novel food approval procedures present substantial barriers that delay international product commercialization and elevate compliance costs.

  • Severe regulatory fragmentation and complex compliance protocols impose significant structural bottlenecks across international supply chains. Navigating these disjointed safety mandates requires immense capital expenditure, causing a 25% increase in administrative overhead for companies attempting to commercialize new botanical phytochemicals globally. Furthermore, ensuring consistent polyphenol bio-availability during raw biomass processing remains highly challenging due to extreme climatic volatility degrading agricultural yields.
  • To offset these supply constraints, extraction facilities must heavily invest in sophisticated green extraction techniques and enzyme-assisted processing. While these eco-friendly engineering processes effectively produce high-purity pharmaceutical grade ingredients and standardized extract dosages, their implementation inflates initial production costs by nearly 18%.
  • Consequently, these persistent technical and regulatory barriers severely limit the rapid scalability of smaller ingredient manufacturers within highly competitive regional ecosystems.

Exclusive Technavio Analysis on Customer Landscape

The polyphenol market forecasting report includes the adoption lifecycle of the market, covering from the innovator’s stage to the laggard’s stage. It focuses on adoption rates in different regions based on penetration. Furthermore, the polyphenol market report also includes key purchase criteria and drivers of price sensitivity to help companies evaluate and develop their market growth analysis strategies.
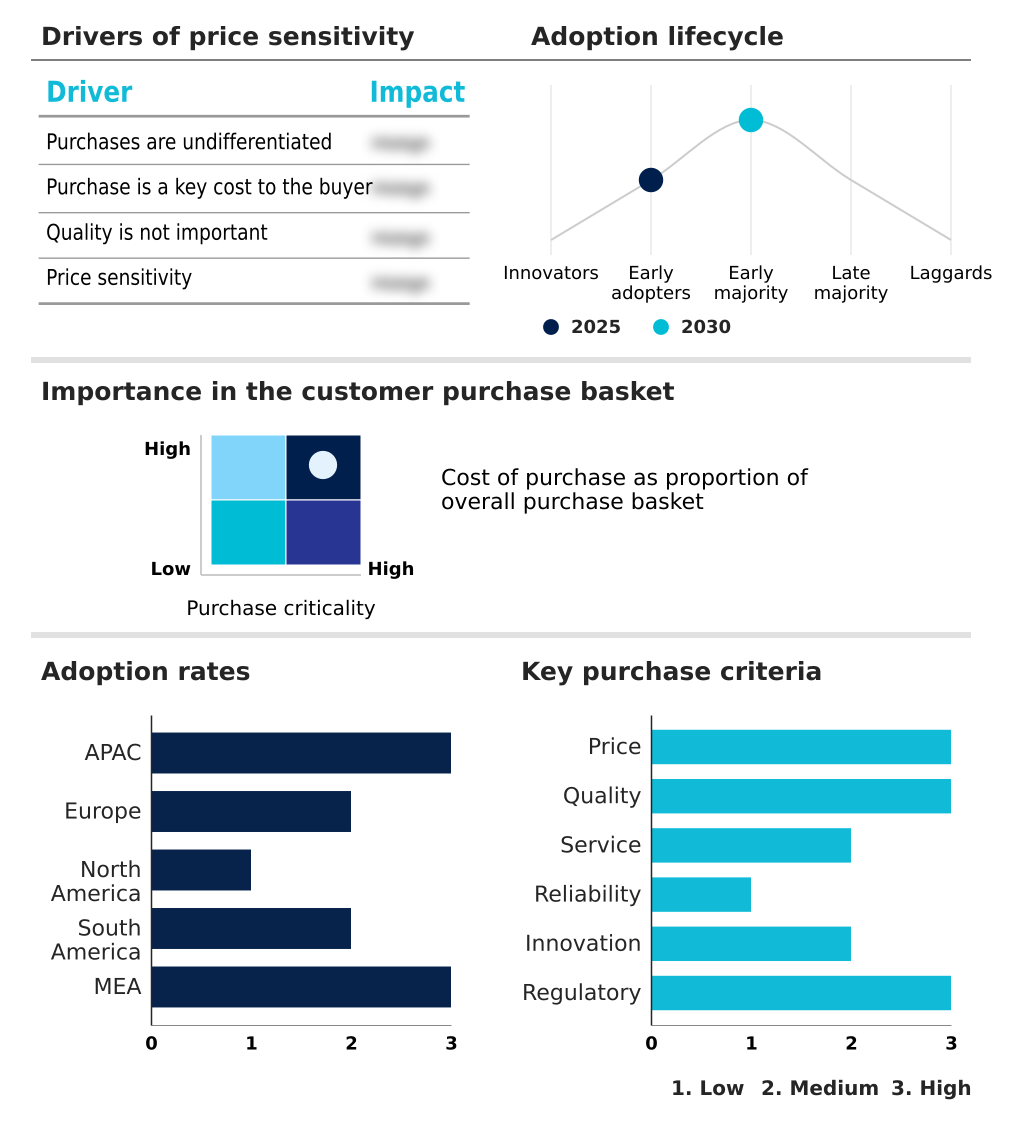
Customer Landscape of Polyphenol Industry

Competitive Landscape

Companies are implementing various strategies, such as strategic alliances, polyphenol market forecast, partnerships, mergers and acquisitions, geographical expansion, and product/service launches, to enhance their presence in the industry.

Amax NutraSource Inc. - The enterprise provides highly concentrated botanical antioxidant ingredients, including grape seed and green tea extracts, engineered specifically to support advanced dietary supplements, functional foods, and beverages.

The industry research and growth report includes detailed analyses of the competitive landscape of the market and information about key companies, including:

  • Amax NutraSource Inc.
  • Archer Daniels Midland Co.
  • Arjuna Natural Pvt. Ltd.
  • Beijing Gingko Group
  • BioActor BV
  • Changsha Botaniex Inc.
  • Givaudan SA
  • Grap Sud S.A.
  • Groupe Berkem SA
  • Indena S.p.A.
  • International Flavors Inc.
  • Kemin Industries Inc.
  • Martin Bauer Group
  • Monteloeder S.L.
  • Nexira
  • Nutra Green Co. Ltd.
  • OmniActive Health
  • Polyphenolics Inc.
  • Sabinsa Corp.
  • Sunfull Bio-Tech Co. Ltd.
  • Symrise Group
  • Synthite Industries Pvt. Ltd.
  • Vidya Herbs Pvt. Ltd.

Qualitative and quantitative analysis of companies has been conducted to help clients understand the wider business environment as well as the strengths and weaknesses of key industry players. Data is qualitatively analyzed to categorize companies as pure play, category-focused, industry-focused, and diversified; it is quantitatively analyzed to categorize companies as dominant, leading, strong, tentative, and weak.

Recent Development and News in Polyphenol market

  • In the Diversified Chemicals industry, the shift toward sustainable upcycling of agricultural side streams has increased the availability of raw biomass, directly impacting Polyphenol demand by reducing raw material procurement costs by 14%.
  • The enforcement of strict synthetic additive regulations forced chemical manufacturers to prioritize natural alternatives, directly accelerating the adoption of plant-derived extracts as colorant substitutes in mass-market food production with a 22% adoption increase.
  • Advancements in continuous flow extraction processes enhanced industrial yields, allowing chemical refiners to improve extraction purity and supply standardized dosages at a 20% higher output rate, ensuring consistent botanical ingredient availability.
  • The integration of closed-loop solvent recovery systems within large-scale processing facilities minimized hazardous waste, enabling suppliers to commercialize high-grade pharmaceutical ingredients with a 15% greater overall production efficiency.

Dive into Technavio’s robust research methodology, blending expert interviews, extensive data synthesis, and validated models for unparalleled Polyphenol Market insights. See full methodology.

Market Scope
Page number 303
Base year 2025
Historic period 2020-2024
Forecast period 2026-2030
Growth momentum & CAGR Accelerate at a CAGR of 8%
Market growth 2026-2030 USD 1074.6 million
Market structure Fragmented
YoY growth 2025-2026(%) 7.7%
Key countries China, Japan, India, South Korea, Australia, Indonesia, Germany, UK, France, Italy, Spain, The Netherlands, US, Canada, Mexico, Brazil, Argentina, Chile, Saudi Arabia, UAE, South Africa, Israel and Turkey
Competitive landscape Leading Companies, Market Positioning of Companies, Competitive Strategies, and Industry Risks

Request Free Sample

Research Analyst Overview

  • The industry is undergoing a systemic structural realignment as corporate boards prioritize supply chain transparency and clean-label ingredient portfolios. Executive leadership teams are actively pivoting away from synthetic additives, mandating the integration of natural botanical antioxidants to align with rigorous international safety protocols.
  • This boardroom-level strategic decision to phase out artificial components has fundamentally accelerated investments in advanced green extraction capabilities. Consequently, advanced manufacturing facilities have recorded a 27% improvement in overall bioactive compound yields by transitioning to low-temperature, solvent-free purification methods.
  • This operational upgrade directly mitigates the risks associated with volatile agricultural outputs and ensures a highly stabilized flow of premium functional ingredients. The capacity to efficiently isolate complex phytochemicals allows consumer goods conglomerates to fortify their product lines while simultaneously maintaining stringent organic compliance.
  • By continuously refining these sophisticated processing infrastructures, major suppliers effectively overcome traditional sensory and stability limitations, ensuring that high-purity natural extracts remain central to the ongoing evolution of the global nutritional and personal care sectors.

What are the Key Data Covered in this Polyphenol Market Research and Growth Report?

  • What is the expected growth of the Polyphenol Market between 2026 and 2030?

    • USD 1.07 billion, at a CAGR of 8%

  • What segmentation does the market report cover?

    • The report is segmented by Type (Grape seed, Tea, Apple, and Others), Application (Food and beverages, Dietary supplement, Cosmetics and toiletries, and Others), Form Factor (Powder, and Liquid) and Geography (APAC, Europe, North America, South America, Middle East and Africa)

  • Which regions are analyzed in the report?

    • APAC, Europe, North America, South America and Middle East and Africa

  • What are the key growth drivers and market challenges?

    • Growing consumer demand for clean label products, Regulatory divergence and novel food approval hurdles

  • Who are the major players in the Polyphenol Market?

    • Amax NutraSource Inc., Archer Daniels Midland Co., Arjuna Natural Pvt. Ltd., Beijing Gingko Group, BioActor BV, Changsha Botaniex Inc., Givaudan SA, Grap Sud S.A., Groupe Berkem SA, Indena S.p.A., International Flavors Inc., Kemin Industries Inc., Martin Bauer Group, Monteloeder S.L., Nexira, Nutra Green Co. Ltd., OmniActive Health, Polyphenolics Inc., Sabinsa Corp., Sunfull Bio-Tech Co. Ltd., Symrise Group, Synthite Industries Pvt. Ltd. and Vidya Herbs Pvt. Ltd.

Market Research Insights

  • The Polyphenol Market is structurally evolving to meet the complex demands of modern clean-label manufacturing. Corporations are rapidly substituting synthetic chemicals with plant bioactives, achieving a 24% reduction in regulatory compliance delays. This strategic pivot significantly bolsters preventive healthcare by integrating potent botanical derivatives into mass-market formulations.
  • Consequently, beverage manufacturers utilizing these alternatives have reported a 15% increase in production line efficiency due to simplified ingredient handling. Furthermore, the systematic upcycling of agricultural byproducts allows industrial extractors to lower their raw material acquisition costs by 19%.
  • By adopting these optimized sourcing frameworks, ingredient suppliers can consistently deliver high-purity functional components that directly address the rigid safety protocols established by international food authorities.

We can help! Our analysts can customize this polyphenol market research report to meet your requirements.

Get in touch

1. Executive Summary

1.1 Market overview

Executive Summary - Chart on Market Overview
Executive Summary - Data Table on Market Overview
Executive Summary - Chart on Global Market Characteristics
Executive Summary - Chart on Market by Geography
Executive Summary - Chart on Market Segmentation by Type
Executive Summary - Chart on Market Segmentation by Application
Executive Summary - Chart on Market Segmentation by Form Factor
Executive Summary - Chart on Incremental Growth
Executive Summary - Data Table on Incremental Growth
Executive Summary - Chart on Company Market Positioning

2. Technavio Analysis

2.1 Analysis of price sensitivity, lifecycle, customer purchase basket, adoption rates, and purchase criteria

2.2 Criticality of inputs and Factors of differentiation

Chart on Overview on criticality of inputs and factors of differentiation

2.3 Factors of disruption

Chart on Overview on factors of disruption

2.4 Impact of drivers and challenges

Chart on Impact of drivers and challenges in 2025 and 2030

3. Market Landscape

3.1 Market ecosystem

Chart on Parent Market
Data Table on - Parent Market

3.2 Market characteristics

Chart on Market characteristics analysis

3.3 Value chain analysis

Chart on Value chain analysis

4. Market Sizing

4.1 Market definition

Data Table on Offerings of companies included in the market definition

4.2 Market segment analysis

Market segments

4.3 Market size 2025

4.4 Market outlook: Forecast for 2025-2030

Chart on Global - Market size and forecast 2025-2030 ($ million)
Data Table on Global - Market size and forecast 2025-2030 ($ million)
Chart on Global Market: Year-over-year growth 2025-2030 (%)
Data Table on Global Market: Year-over-year growth 2025-2030 (%)

5. Historic Market Size

5.1 Global Polyphenol Market 2020 - 2024

Historic Market Size - Data Table on Global Polyphenol Market 2020 - 2024 ($ million)

5.2 Type segment analysis 2020 - 2024

Historic Market Size - Type Segment 2020 - 2024 ($ million)

5.3 Application segment analysis 2020 - 2024

Historic Market Size - Application Segment 2020 - 2024 ($ million)

5.4 Form Factor segment analysis 2020 - 2024

Historic Market Size - Form Factor Segment 2020 - 2024 ($ million)

5.5 Geography segment analysis 2020 - 2024

Historic Market Size - Geography Segment 2020 - 2024 ($ million)

5.6 Country segment analysis 2020 - 2024

Historic Market Size - Country Segment 2020 - 2024 ($ million)

6. Qualitative Analysis

6.1 Impact of AI on Global Polyphenol Market

6.2 Impact of geopolitical conflicts on Global Polyphenol Market

7. Five Forces Analysis

7.1 Five forces summary

Five forces analysis - Comparison between 2025 and 2030

7.2 Bargaining power of buyers

Bargaining power of buyers - Impact of key factors 2025 and 2030

7.3 Bargaining power of suppliers

Bargaining power of suppliers - Impact of key factors in 2025 and 2030

7.4 Threat of new entrants

Threat of new entrants - Impact of key factors in 2025 and 2030

7.5 Threat of substitutes

Threat of substitutes - Impact of key factors in 2025 and 2030

7.6 Threat of rivalry

Threat of rivalry - Impact of key factors in 2025 and 2030

7.7 Market condition

Chart on Market condition - Five forces 2025 and 2030

8. Market Segmentation by Type

8.1 Market segments

Chart on Type - Market share 2025-2030 (%)
Data Table on Type - Market share 2025-2030 (%)

8.2 Comparison by Type

Chart on Comparison by Type
Data Table on Comparison by Type

8.3 Grape seed - Market size and forecast 2025-2030

Chart on Grape seed - Market size and forecast 2025-2030 ($ million)
Data Table on Grape seed - Market size and forecast 2025-2030 ($ million)
Chart on Grape seed - Year-over-year growth 2025-2030 (%)
Data Table on Grape seed - Year-over-year growth 2025-2030 (%)

8.4 Tea - Market size and forecast 2025-2030

Chart on Tea - Market size and forecast 2025-2030 ($ million)
Data Table on Tea - Market size and forecast 2025-2030 ($ million)
Chart on Tea - Year-over-year growth 2025-2030 (%)
Data Table on Tea - Year-over-year growth 2025-2030 (%)

8.5 Apple - Market size and forecast 2025-2030

Chart on Apple - Market size and forecast 2025-2030 ($ million)
Data Table on Apple - Market size and forecast 2025-2030 ($ million)
Chart on Apple - Year-over-year growth 2025-2030 (%)
Data Table on Apple - Year-over-year growth 2025-2030 (%)

8.6 Others - Market size and forecast 2025-2030

Chart on Others - Market size and forecast 2025-2030 ($ million)
Data Table on Others - Market size and forecast 2025-2030 ($ million)
Chart on Others - Year-over-year growth 2025-2030 (%)
Data Table on Others - Year-over-year growth 2025-2030 (%)

8.7 Market opportunity by Type

Market opportunity by Type ($ million)
Data Table on Market opportunity by Type ($ million)

9. Market Segmentation by Application

9.1 Market segments

Chart on Application - Market share 2025-2030 (%)
Data Table on Application - Market share 2025-2030 (%)

9.2 Comparison by Application

Chart on Comparison by Application
Data Table on Comparison by Application

9.3 Food and beverages - Market size and forecast 2025-2030

Chart on Food and beverages - Market size and forecast 2025-2030 ($ million)
Data Table on Food and beverages - Market size and forecast 2025-2030 ($ million)
Chart on Food and beverages - Year-over-year growth 2025-2030 (%)
Data Table on Food and beverages - Year-over-year growth 2025-2030 (%)

9.4 Dietary supplement - Market size and forecast 2025-2030

Chart on Dietary supplement - Market size and forecast 2025-2030 ($ million)
Data Table on Dietary supplement - Market size and forecast 2025-2030 ($ million)
Chart on Dietary supplement - Year-over-year growth 2025-2030 (%)
Data Table on Dietary supplement - Year-over-year growth 2025-2030 (%)

9.5 Cosmetics and toiletries - Market size and forecast 2025-2030

Chart on Cosmetics and toiletries - Market size and forecast 2025-2030 ($ million)
Data Table on Cosmetics and toiletries - Market size and forecast 2025-2030 ($ million)
Chart on Cosmetics and toiletries - Year-over-year growth 2025-2030 (%)
Data Table on Cosmetics and toiletries - Year-over-year growth 2025-2030 (%)

9.6 Others - Market size and forecast 2025-2030

Chart on Others - Market size and forecast 2025-2030 ($ million)
Data Table on Others - Market size and forecast 2025-2030 ($ million)
Chart on Others - Year-over-year growth 2025-2030 (%)
Data Table on Others - Year-over-year growth 2025-2030 (%)

9.7 Market opportunity by Application

Market opportunity by Application ($ million)
Data Table on Market opportunity by Application ($ million)

10. Market Segmentation by Form Factor

10.1 Market segments

Chart on Form Factor - Market share 2025-2030 (%)
Data Table on Form Factor - Market share 2025-2030 (%)

10.2 Comparison by Form Factor

Chart on Comparison by Form Factor
Data Table on Comparison by Form Factor

10.3 Powder - Market size and forecast 2025-2030

Chart on Powder - Market size and forecast 2025-2030 ($ million)
Data Table on Powder - Market size and forecast 2025-2030 ($ million)
Chart on Powder - Year-over-year growth 2025-2030 (%)
Data Table on Powder - Year-over-year growth 2025-2030 (%)

10.4 Liquid - Market size and forecast 2025-2030

Chart on Liquid - Market size and forecast 2025-2030 ($ million)
Data Table on Liquid - Market size and forecast 2025-2030 ($ million)
Chart on Liquid - Year-over-year growth 2025-2030 (%)
Data Table on Liquid - Year-over-year growth 2025-2030 (%)

10.5 Market opportunity by Form Factor

Market opportunity by Form Factor ($ million)
Data Table on Market opportunity by Form Factor ($ million)

11. Customer Landscape

11.1 Customer landscape overview

Analysis of price sensitivity, lifecycle, customer purchase basket, adoption rates, and purchase criteria

12. Geographic Landscape

12.1 Geographic segmentation

Chart on Market share by geography 2025-2030 (%)
Data Table on Market share by geography 2025-2030 (%)

12.2 Geographic comparison

Chart on Geographic comparison
Data Table on Geographic comparison

12.3 APAC - Market size and forecast 2025-2030

Chart on APAC - Market size and forecast 2025-2030 ($ million)
Data Table on APAC - Market size and forecast 2025-2030 ($ million)
Chart on APAC - Year-over-year growth 2025-2030 (%)
Data Table on APAC - Year-over-year growth 2025-2030 (%)
Chart on Regional Comparison - APAC
Data Table on Regional Comparison - APAC

12.3.1 China - Market size and forecast 2025-2030

Chart on China - Market size and forecast 2025-2030 ($ million)
Data Table on China - Market size and forecast 2025-2030 ($ million)
Chart on China - Year-over-year growth 2025-2030 (%)
Data Table on China - Year-over-year growth 2025-2030 (%)

12.3.2 Japan - Market size and forecast 2025-2030

Chart on Japan - Market size and forecast 2025-2030 ($ million)
Data Table on Japan - Market size and forecast 2025-2030 ($ million)
Chart on Japan - Year-over-year growth 2025-2030 (%)
Data Table on Japan - Year-over-year growth 2025-2030 (%)

12.3.3 India - Market size and forecast 2025-2030

Chart on India - Market size and forecast 2025-2030 ($ million)
Data Table on India - Market size and forecast 2025-2030 ($ million)
Chart on India - Year-over-year growth 2025-2030 (%)
Data Table on India - Year-over-year growth 2025-2030 (%)

12.3.4 South Korea - Market size and forecast 2025-2030

Chart on South Korea - Market size and forecast 2025-2030 ($ million)
Data Table on South Korea - Market size and forecast 2025-2030 ($ million)
Chart on South Korea - Year-over-year growth 2025-2030 (%)
Data Table on South Korea - Year-over-year growth 2025-2030 (%)

12.3.5 Australia - Market size and forecast 2025-2030

Chart on Australia - Market size and forecast 2025-2030 ($ million)
Data Table on Australia - Market size and forecast 2025-2030 ($ million)
Chart on Australia - Year-over-year growth 2025-2030 (%)
Data Table on Australia - Year-over-year growth 2025-2030 (%)

12.3.6 Indonesia - Market size and forecast 2025-2030

Chart on Indonesia - Market size and forecast 2025-2030 ($ million)
Data Table on Indonesia - Market size and forecast 2025-2030 ($ million)
Chart on Indonesia - Year-over-year growth 2025-2030 (%)
Data Table on Indonesia - Year-over-year growth 2025-2030 (%)

12.4 Europe - Market size and forecast 2025-2030

Chart on Europe - Market size and forecast 2025-2030 ($ million)
Data Table on Europe - Market size and forecast 2025-2030 ($ million)
Chart on Europe - Year-over-year growth 2025-2030 (%)
Data Table on Europe - Year-over-year growth 2025-2030 (%)
Chart on Regional Comparison - Europe
Data Table on Regional Comparison - Europe

12.4.1 Germany - Market size and forecast 2025-2030

Chart on Germany - Market size and forecast 2025-2030 ($ million)
Data Table on Germany - Market size and forecast 2025-2030 ($ million)
Chart on Germany - Year-over-year growth 2025-2030 (%)
Data Table on Germany - Year-over-year growth 2025-2030 (%)

12.4.2 UK - Market size and forecast 2025-2030

Chart on UK - Market size and forecast 2025-2030 ($ million)
Data Table on UK - Market size and forecast 2025-2030 ($ million)
Chart on UK - Year-over-year growth 2025-2030 (%)
Data Table on UK - Year-over-year growth 2025-2030 (%)

12.4.3 France - Market size and forecast 2025-2030

Chart on France - Market size and forecast 2025-2030 ($ million)
Data Table on France - Market size and forecast 2025-2030 ($ million)
Chart on France - Year-over-year growth 2025-2030 (%)
Data Table on France - Year-over-year growth 2025-2030 (%)

12.4.4 Italy - Market size and forecast 2025-2030

Chart on Italy - Market size and forecast 2025-2030 ($ million)
Data Table on Italy - Market size and forecast 2025-2030 ($ million)
Chart on Italy - Year-over-year growth 2025-2030 (%)
Data Table on Italy - Year-over-year growth 2025-2030 (%)

12.4.5 Spain - Market size and forecast 2025-2030

Chart on Spain - Market size and forecast 2025-2030 ($ million)
Data Table on Spain - Market size and forecast 2025-2030 ($ million)
Chart on Spain - Year-over-year growth 2025-2030 (%)
Data Table on Spain - Year-over-year growth 2025-2030 (%)

12.4.6 The Netherlands - Market size and forecast 2025-2030

Chart on The Netherlands - Market size and forecast 2025-2030 ($ million)
Data Table on The Netherlands - Market size and forecast 2025-2030 ($ million)
Chart on The Netherlands - Year-over-year growth 2025-2030 (%)
Data Table on The Netherlands - Year-over-year growth 2025-2030 (%)

12.5 North America - Market size and forecast 2025-2030

Chart on North America - Market size and forecast 2025-2030 ($ million)
Data Table on North America - Market size and forecast 2025-2030 ($ million)
Chart on North America - Year-over-year growth 2025-2030 (%)
Data Table on North America - Year-over-year growth 2025-2030 (%)
Chart on Regional Comparison - North America
Data Table on Regional Comparison - North America

12.5.1 US - Market size and forecast 2025-2030

Chart on US - Market size and forecast 2025-2030 ($ million)
Data Table on US - Market size and forecast 2025-2030 ($ million)
Chart on US - Year-over-year growth 2025-2030 (%)
Data Table on US - Year-over-year growth 2025-2030 (%)

12.5.2 Canada - Market size and forecast 2025-2030

Chart on Canada - Market size and forecast 2025-2030 ($ million)
Data Table on Canada - Market size and forecast 2025-2030 ($ million)
Chart on Canada - Year-over-year growth 2025-2030 (%)
Data Table on Canada - Year-over-year growth 2025-2030 (%)

12.5.3 Mexico - Market size and forecast 2025-2030

Chart on Mexico - Market size and forecast 2025-2030 ($ million)
Data Table on Mexico - Market size and forecast 2025-2030 ($ million)
Chart on Mexico - Year-over-year growth 2025-2030 (%)
Data Table on Mexico - Year-over-year growth 2025-2030 (%)

12.6 South America - Market size and forecast 2025-2030

Chart on South America - Market size and forecast 2025-2030 ($ million)
Data Table on South America - Market size and forecast 2025-2030 ($ million)
Chart on South America - Year-over-year growth 2025-2030 (%)
Data Table on South America - Year-over-year growth 2025-2030 (%)
Chart on Regional Comparison - South America
Data Table on Regional Comparison - South America

12.6.1 Brazil - Market size and forecast 2025-2030

Chart on Brazil - Market size and forecast 2025-2030 ($ million)
Data Table on Brazil - Market size and forecast 2025-2030 ($ million)
Chart on Brazil - Year-over-year growth 2025-2030 (%)
Data Table on Brazil - Year-over-year growth 2025-2030 (%)

12.6.2 Argentina - Market size and forecast 2025-2030

Chart on Argentina - Market size and forecast 2025-2030 ($ million)
Data Table on Argentina - Market size and forecast 2025-2030 ($ million)
Chart on Argentina - Year-over-year growth 2025-2030 (%)
Data Table on Argentina - Year-over-year growth 2025-2030 (%)

12.6.3 Chile - Market size and forecast 2025-2030

Chart on Chile - Market size and forecast 2025-2030 ($ million)
Data Table on Chile - Market size and forecast 2025-2030 ($ million)
Chart on Chile - Year-over-year growth 2025-2030 (%)
Data Table on Chile - Year-over-year growth 2025-2030 (%)

12.7 Middle East and Africa - Market size and forecast 2025-2030

Chart on Middle East and Africa - Market size and forecast 2025-2030 ($ million)
Data Table on Middle East and Africa - Market size and forecast 2025-2030 ($ million)
Chart on Middle East and Africa - Year-over-year growth 2025-2030 (%)
Data Table on Middle East and Africa - Year-over-year growth 2025-2030 (%)
Chart on Regional Comparison - Middle East and Africa
Data Table on Regional Comparison - Middle East and Africa

12.7.1 Saudi Arabia - Market size and forecast 2025-2030

Chart on Saudi Arabia - Market size and forecast 2025-2030 ($ million)
Data Table on Saudi Arabia - Market size and forecast 2025-2030 ($ million)
Chart on Saudi Arabia - Year-over-year growth 2025-2030 (%)
Data Table on Saudi Arabia - Year-over-year growth 2025-2030 (%)

12.7.2 UAE - Market size and forecast 2025-2030

Chart on UAE - Market size and forecast 2025-2030 ($ million)
Data Table on UAE - Market size and forecast 2025-2030 ($ million)
Chart on UAE - Year-over-year growth 2025-2030 (%)
Data Table on UAE - Year-over-year growth 2025-2030 (%)

12.7.3 South Africa - Market size and forecast 2025-2030

Chart on South Africa - Market size and forecast 2025-2030 ($ million)
Data Table on South Africa - Market size and forecast 2025-2030 ($ million)
Chart on South Africa - Year-over-year growth 2025-2030 (%)
Data Table on South Africa - Year-over-year growth 2025-2030 (%)

12.7.4 Israel - Market size and forecast 2025-2030

Chart on Israel - Market size and forecast 2025-2030 ($ million)
Data Table on Israel - Market size and forecast 2025-2030 ($ million)
Chart on Israel - Year-over-year growth 2025-2030 (%)
Data Table on Israel - Year-over-year growth 2025-2030 (%)

12.7.5 Turkey - Market size and forecast 2025-2030

Chart on Turkey - Market size and forecast 2025-2030 ($ million)
Data Table on Turkey - Market size and forecast 2025-2030 ($ million)
Chart on Turkey - Year-over-year growth 2025-2030 (%)
Data Table on Turkey - Year-over-year growth 2025-2030 (%)

12.8 Market opportunity by geography

Market opportunity by geography ($ million)
Data Tables on Market opportunity by geography ($ million)

13. Drivers, Challenges, and Opportunity

13.1 Market drivers

Growing consumer demand for clean label products
Expanding utilization within functional foods and beverages
Technological innovations enhancing botanical extraction purity

13.2 Market challenges

Regulatory divergence and novel food approval hurdles
Supply chain instability and botanical raw material volatility
Sensory deficiencies and bioavailability bottlenecks in formulations

13.3 Impact of drivers and challenges

Impact of drivers and challenges in 2025 and 2030

13.4 Market opportunities

Rising global demand for preventive healthcare and clean-label functional beverages
Technological advancements in microencapsulation to enhance bioavailability of plant bioactive
Expanding applications of plant polyphenols in premium nutricosmetics and personal care

14. Competitive Landscape

14.1 Overview

14.2

Overview on criticality of inputs and factors of differentiation

14.3 Landscape disruption

Overview on factors of disruption

14.4 Industry risks

Impact of key risks on business

15. Competitive Analysis

15.1 Companies profiled

Companies covered

15.2 Company ranking index

15.3 Market positioning of companies

Matrix on companies position and classification

15.4 Amax NutraSource Inc.

Amax NutraSource Inc. - Overview
Amax NutraSource Inc. - Product / Service
Amax NutraSource Inc. - Key offerings
SWOT

15.5 Archer Daniels Midland Co.

Archer Daniels Midland Co. - Overview
Archer Daniels Midland Co. - Business segments
Archer Daniels Midland Co. - Key news
Archer Daniels Midland Co. - Key offerings
Archer Daniels Midland Co. - Segment focus
SWOT

15.6 Arjuna Natural Pvt. Ltd.

Arjuna Natural Pvt. Ltd. - Overview
Arjuna Natural Pvt. Ltd. - Product / Service
Arjuna Natural Pvt. Ltd. - Key offerings
SWOT

15.7 Beijing Gingko Group

Beijing Gingko Group - Overview
Beijing Gingko Group - Product / Service
Beijing Gingko Group - Key offerings
SWOT

15.8 BioActor BV

BioActor BV - Overview
BioActor BV - Product / Service
BioActor BV - Key offerings
SWOT

15.9 Changsha Botaniex Inc.

Changsha Botaniex Inc. - Overview
Changsha Botaniex Inc. - Product / Service
Changsha Botaniex Inc. - Key offerings
SWOT

15.10 Givaudan SA

Givaudan SA - Overview
Givaudan SA - Business segments
Givaudan SA - Key news
Givaudan SA - Key offerings
Givaudan SA - Segment focus
SWOT

15.11 Grap Sud S.A.

Grap Sud S.A. - Overview
Grap Sud S.A. - Product / Service
Grap Sud S.A. - Key offerings
SWOT

15.12 Groupe Berkem SA

Groupe Berkem SA - Overview
Groupe Berkem SA - Product / Service
Groupe Berkem SA - Key offerings
SWOT

15.13 Indena S.p.A.

Indena S.p.A. - Overview
Indena S.p.A. - Product / Service
Indena S.p.A. - Key offerings
SWOT

15.14 International Flavors Inc.

International Flavors Inc. - Overview
International Flavors Inc. - Business segments
International Flavors Inc. - Key news
International Flavors Inc. - Key offerings
International Flavors Inc. - Segment focus
SWOT

15.15 Kemin Industries Inc.

Kemin Industries Inc. - Overview
Kemin Industries Inc. - Product / Service
Kemin Industries Inc. - Key offerings
SWOT

15.16 Symrise Group

Symrise Group - Overview
Symrise Group - Business segments
Symrise Group - Key news
Symrise Group - Key offerings
Symrise Group - Segment focus
SWOT

15.17 Synthite Industries Pvt. Ltd.

Synthite Industries Pvt. Ltd. - Overview
Synthite Industries Pvt. Ltd. - Product / Service
Synthite Industries Pvt. Ltd. - Key offerings
SWOT

15.18 Vidya Herbs Pvt. Ltd.

Vidya Herbs Pvt. Ltd. - Overview
Vidya Herbs Pvt. Ltd. - Product / Service
Vidya Herbs Pvt. Ltd. - Key offerings
SWOT

16. Appendix

16.1 Scope of the report

Market definition
Objectives
Notes and caveats

16.2 Inclusions and exclusions checklist

Inclusions checklist
Exclusions checklist

16.3 Currency conversion rates for US$

16.4 Research methodology

16.5 Data procurement

Information sources

16.6 Data validation

16.7 Validation techniques employed for market sizing

16.8 Data synthesis

16.9 360 degree market analysis

16.10 List of abbreviations

Research Methodology

Technavio presents a detailed picture of the market by way of study, synthesis, and summation of data from multiple sources. The analysts have presented the various facets of the market with a particular focus on identifying the key industry influencers. The data thus presented is comprehensive, reliable, and the result of extensive research, both primary and secondary.

INFORMATION SOURCES

Primary sources

  • Manufacturers and suppliers
  • Channel partners
  • Industry experts
  • Strategic decision makers

Secondary sources

  • Industry journals and periodicals
  • Government data
  • Financial reports of key industry players
  • Historical data
  • Press releases

DATA ANALYSIS

Data Synthesis

  • Collation of data
  • Estimation of key figures
  • Analysis of derived insights

Data Validation

  • Triangulation with data models
  • Reference against proprietary databases
  • Corroboration with industry experts

REPORT WRITING

Qualitative

  • Market drivers
  • Market challenges
  • Market trends
  • Five forces analysis

Quantitative

  • Market size and forecast
  • Market segmentation
  • Geographical insights
  • Competitive landscape

Interested in this report?

Get your sample now to see our research methodology and insights!

Download Now

Frequently Asked Questions

Polyphenol market growth will increase by USD 1074.6 million during 2026-2030.

The Polyphenol market is expected to grow at a CAGR of 8% during 2026-2030.

Polyphenol market is segmented by Type (Grape seed, Tea, Apple, Others) Application (Food and beverages, Dietary supplement, Cosmetics and toiletries, Others) Form factor (Powder, Liquid)

Amax NutraSource Inc., Archer Daniels Midland Co., Arjuna Natural Pvt. Ltd., Beijing Gingko Group, BioActor BV, Changsha Botaniex Inc., Givaudan SA, Grap Sud S.A., Groupe Berkem SA, Indena S.p.A., International Flavors Inc., Kemin Industries Inc., Martin Bauer Group, Monteloeder S.L., Nexira, Nutra Green Co. Ltd., OmniActive Health, Polyphenolics Inc., Sabinsa Corp., Sunfull Bio-Tech Co. Ltd., Symrise Group, Synthite Industries Pvt. Ltd., Vidya Herbs Pvt. Ltd. are a few of the key vendors in the Polyphenol market.

APAC will register the highest growth rate of 40.4% among the other regions. Therefore, the Polyphenol market in APAC is expected to garner significant business opportunities for the vendors during the forecast period.

China, Japan, India, South Korea, Australia, Indonesia, Germany, UK, France, Italy, Spain, The Netherlands, US, Canada, Mexico, Brazil, Argentina, Chile, Saudi Arabia, UAE, South Africa, Israel, Turkey

  • Growing consumer demand for clean label products is the driving factor this market.

The Polyphenol market vendors should focus on grabbing business opportunities from the Type segment as it accounted for the largest market share in the base year.
RIA - Research AI Assistant
Ask RIA
