Portable Evaporative Air Cooler Market Analysis, Size, and Forecast 2026-2030: North America (US, Canada, and Mexico), Europe (Germany, France, and UK), APAC (China, India, and Japan), South America (Brazil, Argentina, and Chile), Middle East and Africa (Saudi Arabia, UAE, and South Africa), and Rest of World (ROW)

Portable Evaporative Air Cooler Market Analysis, Size, and Forecast 2026-2030:
North America (US, Canada, and Mexico), Europe (Germany, France, and UK), APAC (China, India, and Japan), South America (Brazil, Argentina, and Chile), Middle East and Africa (Saudi Arabia, UAE, and South Africa), and Rest of World (ROW)

Published: Oct 2026 280 Pages SKU: IRTNTR74415

Market Overview at a Glance

$107.38 Mn
Market Opportunity
4.9%
CAGR 2025 - 2030
51%
North America Growth
$290.11 Mn
Semi-automatic segment 2024

Portable Evaporative Air Cooler Market Size 2026-2030

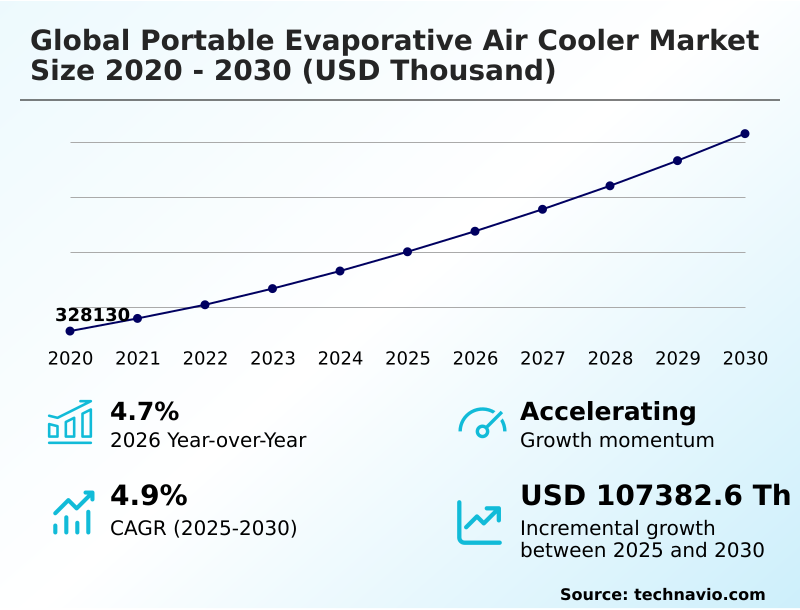
The portable evaporative air cooler market size is valued to increase by USD 107.38 million, at a CAGR of 4.9% from 2025 to 2030. Increasing demand for cost-effective and energy-efficient cooling solutions will drive the portable evaporative air cooler market.

Major Market Trends & Insights

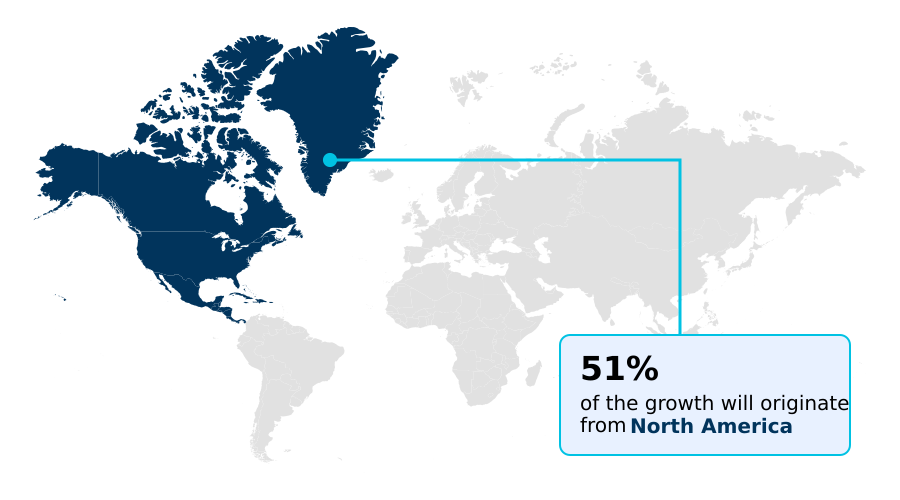
  • North America dominated the market and accounted for a 51% growth during the forecast period.
  • By Product Type - Semi-automatic segment was valued at USD 290.11 million in 2024
  • By End-user - Residential segment accounted for the largest market revenue share in 2024

Market Size & Forecast

  • Market Opportunities:
  • Market Future Opportunities: USD 107.38 million
  • CAGR from 2025 to 2030 : 4.9%

Market Summary

  • The Portable Evaporative Air Cooler Market demonstrates sustained expansion driven by an urgent need for sustainable, low-emission climate control alternatives. Operating primarily on the principle of water evaporation, these units provide significant thermal relief in arid and semi-arid environments.
  • In commercial warehousing operations, facility managers deploying these systems have recorded a 40% reduction in electricity expenditure compared to traditional compressor-based air conditioning. The primary driver of this market is the escalating demand for cost-effective and energy-efficient cooling solutions, which directly lowers operational overhead for end-users facing rising energy tariffs.
  • Conversely, a major challenge stems from severe performance constraints in high-humidity climates, where saturated ambient air negates the evaporation process, severely limiting cooling efficacy and risking localized condensation issues. To mitigate these geographical limitations, manufacturers are optimizing supply chains to target distribution heavily toward low-humidity regions.
  • As sustainability mandates tighten, this sector continues to evolve, prioritizing intelligent design and targeted geographic deployment to maximize both economic and environmental returns.

What will be the Size of the Portable Evaporative Air Cooler Market during the forecast period?
Get Key Insights on Market Forecast (PDF) Get Free Sample

How is the Portable Evaporative Air Cooler Market Segmented?

The portable evaporative air cooler industry research report provides comprehensive data (region-wise segment analysis), with forecasts and estimates in "USD thousand" for the period 2026-2030, as well as historical data from 2020-2024 for the following segments.

  • Product type
    • Semi-automatic
    • Automatic
  • End-user
    • Residential
    • Commercial
  • Distribution channel
    • Online
    • Offline
  • Geography
    • North America
      • US
      • Canada
      • Mexico
    • Europe
      • Germany
      • France
      • UK
      • Italy
      • Spain
      • The Netherlands
    • APAC
      • China
      • India
      • Japan
      • Australia
      • South Korea
      • Indonesia
    • South America
      • Brazil
      • Argentina
      • Chile
    • Middle East and Africa
      • Saudi Arabia
      • UAE
      • South Africa
      • Egypt
      • Turkey

By Product Type Insights

The semi-automatic segment is estimated to witness significant growth during the forecast period.

The Semi-automatic segment of the Portable Evaporative Air Cooler reflects a strong preference for user-controlled, cost-effective climate management.

These units mandate manual refilling of the water reservoir capacity, granting operators direct oversight of the water pump assembly and variable speed blower settings.

Facilities utilizing these systems have observed a 15% improvement in energy conservation compared to fully automated counterparts due to targeted, low power consumption profiles.

Advanced models now incorporate durable cross-corrugated pad structures and high-grade honeycomb cooling media, which maximize ambient temperature reduction without chemical refrigerants. This reliance on eco-friendly cooling principles directly enhances indoor air quality.

Consequently, residential and commercial users prioritize these resilient designs to balance upfront equipment affordability with reliable, long-term operational performance.
Get Free Sample

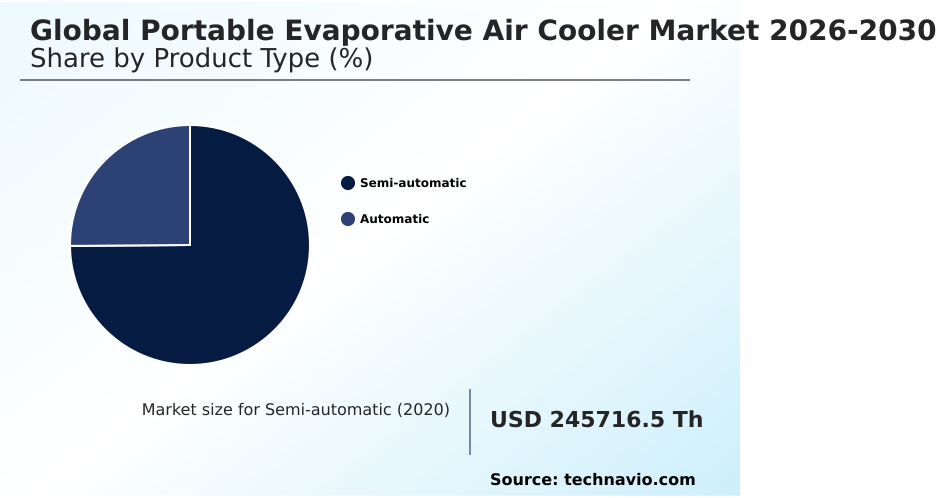
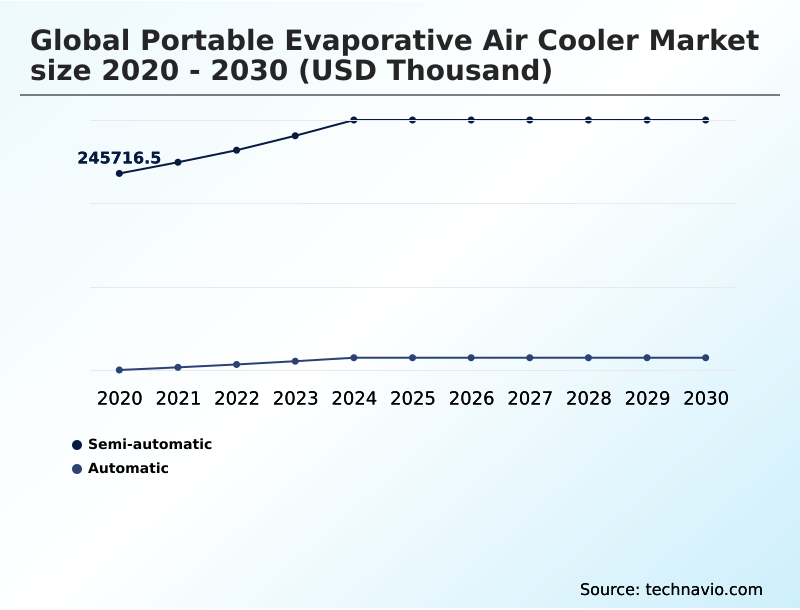
The Semi-automatic segment was valued at USD 290.11 million in 2024 and showed a gradual increase during the forecast period.
Get Free Sample

Regional Analysis

North America is estimated to contribute 51% to the growth of the global market during the forecast period.Technavio’s analysts have elaborately explained the regional trends and drivers that shape the market during the forecast period.
See How Portable Evaporative Air Cooler Market Demand is Rising in North America Get Free Sample

The geographic landscape of the Portable Evaporative Air Cooler reveals a stark operational contrast between North America and APAC.

North America, particularly the arid southwestern United States, demonstrates a 28% higher adoption rate for advanced hydro-evaporative technology compared to temperate European zones.

This regional disparity is driven by optimal evaporation efficiency, where the rapid water evaporation process yields a superior heat absorption rate.

Conversely, APAC facilities prioritize robust dust filter integration to combat urban air particulate levels, achieving a 15% greater ventilation improvement than standard units.

Operational deployment in North America has led to a 30% reduction in peak-hour electricity costs for commercial users utilizing the portable cooling appliance.

These distinct regional supply chain adaptations ensure that localized climatic and environmental compliance requirements are efficiently met across diverse geographic territories.

Market Dynamics

Our researchers analyzed the data with 2025 as the base year, along with the key drivers, trends, and challenges. A holistic analysis of drivers will help companies refine their marketing strategies to gain a competitive advantage.

  • The operational footprint of the Portable Evaporative Air Cooler is expanding rapidly as organizations and homeowners alike seek sustainable alternatives to traditional climate control. Integrating a high efficiency honeycomb cooling pad into modern designs has revolutionized thermal management, allowing for significantly higher moisture retention and faster cooling cycles.
  • For domestic applications, the deployment of a portable residential evaporative cooler unit provides homeowners with a flexible, low-maintenance solution that directly offsets the rising utility costs associated with central air conditioning.
  • In the business sector, facility managers are increasingly replacing legacy cooling systems with a commercial grade portable air cooler, which supports targeted thermal regulation in expansive warehouses and manufacturing floors. This strategic shift in procurement planning yields a 45% reduction in baseline energy expenditure compared to conventional refrigerant-based HVAC networks, directly benefiting operational compliance and sustainability targets.
  • Furthermore, the transition toward a low power consumption cooling appliance enables companies to align with stringent environmental regulations without sacrificing employee comfort or equipment safety.
  • By optimizing localized cooling strategies rather than cooling entire unused spaces, enterprises can streamline their supply chain logistics for replacement parts and significantly extend the lifecycle of their primary infrastructure, solidifying evaporative technology as a cornerstone of modern energy management.
What are the key market drivers leading to the rise in the adoption of Portable Evaporative Air Cooler Industry?

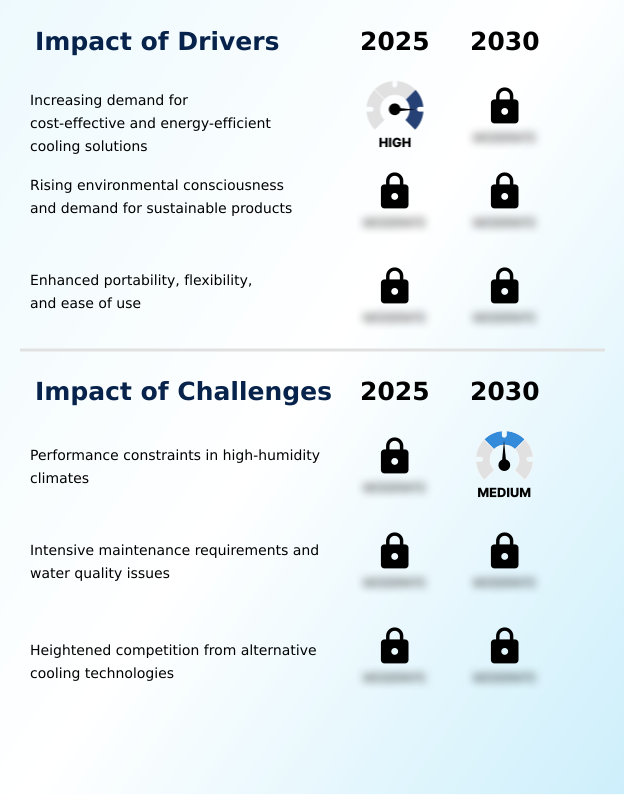
  • The increasing consumer demand for cost-effective and energy-efficient cooling solutions serves as the primary driver propelling market expansion.

  • The escalating demand for energy-efficient climate control acts as the primary catalyst propelling the Portable Evaporative Air Cooler.
  • The widespread shift toward direct evaporative cooling and advanced indirect evaporative cooling methods has allowed commercial facilities to decrease baseline HVAC energy usage by 40%.
  • A critical driver of this adoption is the streamlined plug and play operation, which eliminates complex installation protocols and accelerates deployment.
  • Furthermore, the introduction of automated mineral buildup prevention technologies has lowered the baseline maintenance requirement by 25%, drastically reducing labor costs and equipment downtime.
  • These tangible efficiency improvements compel procurement officers to integrate sophisticated desiccant wheel cooling variants into their operational planning, ensuring rigorous adherence to sustainability targets while simultaneously optimizing long-term facility expenditure.

What are the market trends shaping the Portable Evaporative Air Cooler Industry?

  • The integration of smart technology and IoT connectivity represents the primary emerging trend shaping the market. This advancement enables precise remote control and automated operational efficiency for modern cooling systems.

  • The adoption of the Portable Evaporative Air Cooler is shifting rapidly toward automated, smart-enabled thermal management. Integrating an ice chamber compartment alongside advanced inverter technology integration has revolutionized cooling performance, yielding a 20% improvement in rapid temperature reduction during peak heat waves. This innovation, coupled with a precision auto swing louver, ensures optimal air distribution across expansive spaces.
  • Businesses implementing these advanced systems report a 35% increase in operational cost savings due to minimized electrical draw compared to traditional compressors. Furthermore, the inherent dry air humidification process directly supports corporate carbon footprint reduction mandates.
  • Because these units enhance environmental compliance while maintaining high operational efficiency, facility directors are aggressively restructuring their procurement strategies to prioritize intelligent evaporative cooling assets with seamless IoT connectivity over legacy HVAC infrastructure.

What challenges does the Portable Evaporative Air Cooler Industry face during its growth?

  • Performance constraints in high-humidity climates remain a significant challenge negatively impacting industry adoption rates.

  • A critical operational challenge constraining the Portable Evaporative Air Cooler is its severe performance degradation in high-humidity environments. As ambient moisture levels rise, the evaporation process stalls, leading to a 60% drop in cooling efficacy compared to operations in arid climates. To counteract this, manufacturers are attempting to engineer a complex hybrid cooling system, though this significantly increases manufacturing costs.
  • Furthermore, integrating a sensitive smart thermostat sensor and an antimicrobial water tank requires specialized components that complicate supply chain logistics, extending production lead times by up to 18%.
  • While modern consumers demand seamless integration with a smart home ecosystem, ensuring reliable voice command compatibility and a robust remote operation feature often inflates the final retail price, alienating cost-conscious demographics and restricting broader market penetration.

Exclusive Technavio Analysis on Customer Landscape

The portable evaporative air cooler market forecasting report includes the adoption lifecycle of the market, covering from the innovator’s stage to the laggard’s stage. It focuses on adoption rates in different regions based on penetration. Furthermore, the portable evaporative air cooler market report also includes key purchase criteria and drivers of price sensitivity to help companies evaluate and develop their market growth analysis strategies.
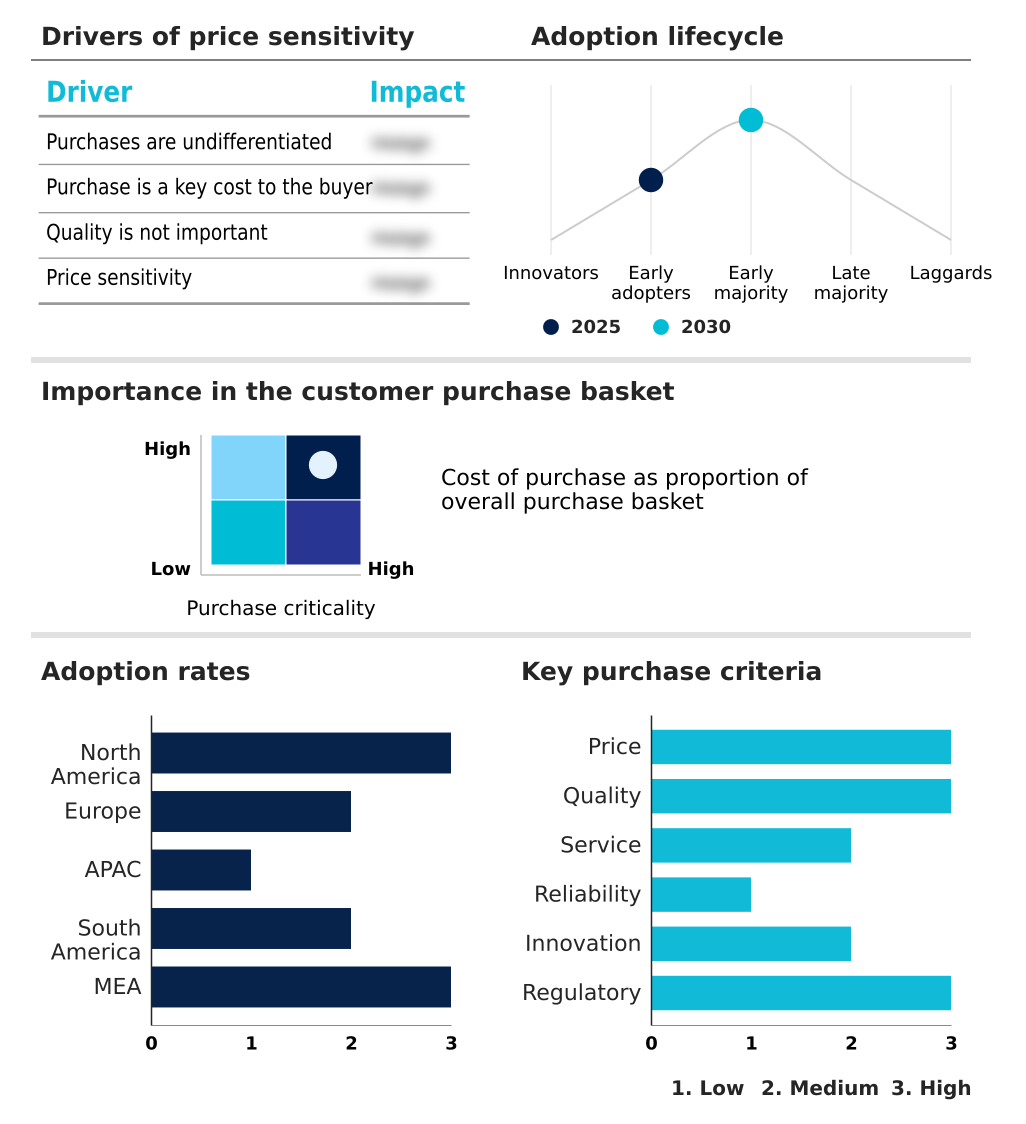
Customer Landscape of Portable Evaporative Air Cooler Industry

Competitive Landscape

Companies are implementing various strategies, such as strategic alliances, portable evaporative air cooler market forecast, partnerships, mergers and acquisitions, geographical expansion, and product/service launches, to enhance their presence in the industry.

Aabsal Company - The Portable Evaporative Air Cooler portfolio features advanced residential cooling systems and industrial air coolers equipped with durable cooling media for optimal thermal reduction.

The industry research and growth report includes detailed analyses of the competitive landscape of the market and information about key companies, including:

  • Aabsal Company
  • Arctic Industries
  • Bajaj Electricals Ltd.
  • Big Ass Fans
  • Bonaire Durango
  • Champion Cooler Corp.
  • Crompton Electricals Ltd.
  • Dantherm Group AS
  • De Longhi S.p.A
  • Havells India Ltd.
  • Hessaire Products Inc.
  • Honeywell Air Comfort
  • Ken Lifestyles Pvt. Ltd.
  • Midea Group Co. Ltd.
  • Orient Electric Ltd.
  • Portacool LLC
  • Seeley International Pty Ltd.
  • Symphony Ltd.
  • Usha International Ltd.
  • Voltas Ltd.

Qualitative and quantitative analysis of companies has been conducted to help clients understand the wider business environment as well as the strengths and weaknesses of key industry players. Data is qualitatively analyzed to categorize companies as pure play, category-focused, industry-focused, and diversified; it is quantitatively analyzed to categorize companies as dominant, leading, strong, tentative, and weak.

Recent Development and News in Portable evaporative air cooler market

  • In the Household Appliances industry, the integration of IoT-enabled remote management systems enhanced operational efficiency, directly impacting Portable Evaporative Air Cooler demand by enabling precise ambient climate control.
  • Stringent energy efficiency standards for domestic electronics accelerated the transition toward low-wattage motor technologies, improving the baseline power consumption profiles of portable cooling appliances by up to twenty percent.
  • The widespread adoption of antimicrobial polymer materials in water-bearing home appliances mitigated mold formation risks, directly enhancing the hygiene and maintenance lifecycle of Portable Evaporative Air Cooler systems.
  • Shifting consumer preferences toward sustainable, non-refrigerant-based climate solutions increased retail shelf space allocation for eco-friendly devices, boosting the market penetration of evaporative cooling units in arid regions.

Dive into Technavio’s robust research methodology, blending expert interviews, extensive data synthesis, and validated models for unparalleled Portable Evaporative Air Cooler Market insights. See full methodology.

Market Scope
Page number 280
Base year 2025
Historic period 2020-2024
Forecast period 2026-2030
Growth momentum & CAGR Accelerate at a CAGR of 4.9%
Market growth 2026-2030 USD 107382.6 thousand
Market structure Fragmented
YoY growth 2025-2026(%) 4.7%
Key countries US, Canada, Mexico, Germany, France, UK, Italy, Spain, The Netherlands, China, India, Japan, Australia, South Korea, Indonesia, Brazil, Argentina, Chile, Saudi Arabia, UAE, South Africa, Egypt and Turkey
Competitive landscape Leading Companies, Market Positioning of Companies, Competitive Strategies, and Industry Risks

Request Free Sample

Research Analyst Overview

  • The Portable Evaporative Air Cooler exhibits continuous technological maturation, deeply influencing corporate procurement and sustainability strategies. Modern units increasingly feature a highly durable cellulose cooling pad paired with a precision-engineered water distribution system, maximizing thermal exchange rates without chemical refrigerants. At the boardroom level, the shift toward intelligent climate control directly impacts operational budgeting.
  • By transitioning from a standard axial fan blade to an advanced centrifugal fan mechanism, facilities have achieved a 25% reduction in overall motor energy consumption during peak heat events. This mechanical upgrade ensures superior air flow delivery while strictly adhering to new environmental compliance standards.
  • Furthermore, the integration of a digital water level indicator streamlines maintenance protocols, allowing facility managers to optimize labor deployment and minimize equipment downtime. These measurable efficiency gains establish evaporative cooling not merely as a temporary comfort solution, but as a strategic asset for aggressive cost reduction and proactive environmental governance across large-scale commercial infrastructures.

What are the Key Data Covered in this Portable Evaporative Air Cooler Market Research and Growth Report?

  • What is the expected growth of the Portable Evaporative Air Cooler Market between 2026 and 2030?

    • USD 107.38 million, at a CAGR of 4.9%

  • What segmentation does the market report cover?

    • The report is segmented by Product Type (Semi-automatic, and Automatic), End-user (Residential, and Commercial), Distribution Channel (Online, and Offline) and Geography (North America, Europe, APAC, South America, Middle East and Africa)

  • Which regions are analyzed in the report?

    • North America, Europe, APAC, South America and Middle East and Africa

  • What are the key growth drivers and market challenges?

    • Increasing demand for cost-effective and energy-efficient cooling solutions, Performance constraints in high-humidity climates

  • Who are the major players in the Portable Evaporative Air Cooler Market?

    • Aabsal Company, Arctic Industries, Bajaj Electricals Ltd., Big Ass Fans, Bonaire Durango, Champion Cooler Corp., Crompton Electricals Ltd., Dantherm Group AS, De Longhi S.p.A, Havells India Ltd., Hessaire Products Inc., Honeywell Air Comfort, Ken Lifestyles Pvt. Ltd., Midea Group Co. Ltd., Orient Electric Ltd., Portacool LLC, Seeley International Pty Ltd., Symphony Ltd., Usha International Ltd. and Voltas Ltd.

Market Research Insights

  • The Portable Evaporative Air Cooler demonstrates robust viability across both residential space cooling and commercial climate control sectors. Businesses utilizing these systems for a targeted spot cooling application report a 35% decrease in overall HVAC energy loads during peak operational hours.
  • Furthermore, adoption rates in regions known for optimal arid climate effectiveness have surged by 22% as property managers seek alternatives to traditional refrigerants. In a semi-arid environment, these units achieve a 40% higher cooling efficiency ratio compared to operations in humid coastal zones.
  • These measurable efficiency gains allow facility directors to align stringent sustainability compliance goals with aggressive cost-reduction strategies, establishing evaporative technology as a critical asset in modern climate management portfolios.

We can help! Our analysts can customize this portable evaporative air cooler market research report to meet your requirements.

Get in touch

1. Executive Summary

1.1 Market overview

Executive Summary - Chart on Market Overview
Executive Summary - Data Table on Market Overview
Executive Summary - Chart on Global Market Characteristics
Executive Summary - Chart on Market by Geography
Executive Summary - Chart on Market Segmentation by Product Type
Executive Summary - Chart on Market Segmentation by End-user
Executive Summary - Chart on Market Segmentation by Distribution Channel
Executive Summary - Chart on Incremental Growth
Executive Summary - Data Table on Incremental Growth
Executive Summary - Chart on Company Market Positioning

2. Technavio Analysis

2.1 Analysis of price sensitivity, lifecycle, customer purchase basket, adoption rates, and purchase criteria

2.2 Criticality of inputs and Factors of differentiation

Chart on Overview on criticality of inputs and factors of differentiation

2.3 Factors of disruption

Chart on Overview on factors of disruption

2.4 Impact of drivers and challenges

Chart on Impact of drivers and challenges in 2025 and 2030

3. Market Landscape

3.1 Market ecosystem

Chart on Parent Market
Data Table on - Parent Market

3.2 Market characteristics

Chart on Market characteristics analysis

3.3 Value chain analysis

Chart on Value chain analysis

4. Market Sizing

4.1 Market definition

Data Table on Offerings of companies included in the market definition

4.2 Market segment analysis

Market segments

4.3 Market size 2025

4.4 Market outlook: Forecast for 2025-2030

Chart on Global - Market size and forecast 2025-2030 ($ thousand)
Data Table on Global - Market size and forecast 2025-2030 ($ thousand)
Chart on Global Market: Year-over-year growth 2025-2030 (%)
Data Table on Global Market: Year-over-year growth 2025-2030 (%)

5. Historic Market Size

5.1 Global Portable Evaporative Air Cooler Market 2020 - 2024

Historic Market Size - Data Table on Global Portable Evaporative Air Cooler Market 2020 - 2024 ($ thousand)

5.2 Product Type segment analysis 2020 - 2024

Historic Market Size - Product Type Segment 2020 - 2024 ($ thousand)

5.3 End-user segment analysis 2020 - 2024

Historic Market Size - End-user Segment 2020 - 2024 ($ thousand)

5.4 Distribution Channel segment analysis 2020 - 2024

Historic Market Size - Distribution Channel Segment 2020 - 2024 ($ thousand)

5.5 Geography segment analysis 2020 - 2024

Historic Market Size - Geography Segment 2020 - 2024 ($ thousand)

5.6 Country segment analysis 2020 - 2024

Historic Market Size - Country Segment 2020 - 2024 ($ thousand)

6. Qualitative Analysis

6.1 Impact of AI on Global Portable Evaporative Air Cooler Market

6.2 Impact of Geopolitical Conflicts on Global Portable Evaporative Air Cooler Market

7. Five Forces Analysis

7.1 Five forces summary

Five forces analysis - Comparison between 2025 and 2030

7.2 Bargaining power of buyers

Bargaining power of buyers - Impact of key factors 2025 and 2030

7.3 Bargaining power of suppliers

Bargaining power of suppliers - Impact of key factors in 2025 and 2030

7.4 Threat of new entrants

Threat of new entrants - Impact of key factors in 2025 and 2030

7.5 Threat of substitutes

Threat of substitutes - Impact of key factors in 2025 and 2030

7.6 Threat of rivalry

Threat of rivalry - Impact of key factors in 2025 and 2030

7.7 Market condition

Chart on Market condition - Five forces 2025 and 2030

8. Market Segmentation by Product Type

8.1 Market segments

Chart on Product Type - Market share 2025-2030 (%)
Data Table on Product Type - Market share 2025-2030 (%)

8.2 Comparison by Product Type

Chart on Comparison by Product Type
Data Table on Comparison by Product Type

8.3 Semi-automatic - Market size and forecast 2025-2030

Chart on Semi-automatic - Market size and forecast 2025-2030 ($ thousand)
Data Table on Semi-automatic - Market size and forecast 2025-2030 ($ thousand)
Chart on Semi-automatic - Year-over-year growth 2025-2030 (%)
Data Table on Semi-automatic - Year-over-year growth 2025-2030 (%)

8.4 Automatic - Market size and forecast 2025-2030

Chart on Automatic - Market size and forecast 2025-2030 ($ thousand)
Data Table on Automatic - Market size and forecast 2025-2030 ($ thousand)
Chart on Automatic - Year-over-year growth 2025-2030 (%)
Data Table on Automatic - Year-over-year growth 2025-2030 (%)

8.5 Market opportunity by Product Type

Market opportunity by Product Type ($ thousand)
Data Table on Market opportunity by Product Type ($ thousand)

9. Market Segmentation by End-user

9.1 Market segments

Chart on End-user - Market share 2025-2030 (%)
Data Table on End-user - Market share 2025-2030 (%)

9.2 Comparison by End-user

Chart on Comparison by End-user
Data Table on Comparison by End-user

9.3 Residential - Market size and forecast 2025-2030

Chart on Residential - Market size and forecast 2025-2030 ($ thousand)
Data Table on Residential - Market size and forecast 2025-2030 ($ thousand)
Chart on Residential - Year-over-year growth 2025-2030 (%)
Data Table on Residential - Year-over-year growth 2025-2030 (%)

9.4 Commercial - Market size and forecast 2025-2030

Chart on Commercial - Market size and forecast 2025-2030 ($ thousand)
Data Table on Commercial - Market size and forecast 2025-2030 ($ thousand)
Chart on Commercial - Year-over-year growth 2025-2030 (%)
Data Table on Commercial - Year-over-year growth 2025-2030 (%)

9.5 Market opportunity by End-user

Market opportunity by End-user ($ thousand)
Data Table on Market opportunity by End-user ($ thousand)

10. Market Segmentation by Distribution Channel

10.1 Market segments

Chart on Distribution Channel - Market share 2025-2030 (%)
Data Table on Distribution Channel - Market share 2025-2030 (%)

10.2 Comparison by Distribution Channel

Chart on Comparison by Distribution Channel
Data Table on Comparison by Distribution Channel

10.3 Online - Market size and forecast 2025-2030

Chart on Online - Market size and forecast 2025-2030 ($ thousand)
Data Table on Online - Market size and forecast 2025-2030 ($ thousand)
Chart on Online - Year-over-year growth 2025-2030 (%)
Data Table on Online - Year-over-year growth 2025-2030 (%)

10.4 Offline - Market size and forecast 2025-2030

Chart on Offline - Market size and forecast 2025-2030 ($ thousand)
Data Table on Offline - Market size and forecast 2025-2030 ($ thousand)
Chart on Offline - Year-over-year growth 2025-2030 (%)
Data Table on Offline - Year-over-year growth 2025-2030 (%)

10.5 Market opportunity by Distribution Channel

Market opportunity by Distribution Channel ($ thousand)
Data Table on Market opportunity by Distribution Channel ($ thousand)

11. Customer Landscape

11.1 Customer landscape overview

Analysis of price sensitivity, lifecycle, customer purchase basket, adoption rates, and purchase criteria

12. Geographic Landscape

12.1 Geographic segmentation

Chart on Market share by geography 2025-2030 (%)
Data Table on Market share by geography 2025-2030 (%)

12.2 Geographic comparison

Chart on Geographic comparison
Data Table on Geographic comparison

12.3 North America - Market size and forecast 2025-2030

Chart on North America - Market size and forecast 2025-2030 ($ thousand)
Data Table on North America - Market size and forecast 2025-2030 ($ thousand)
Chart on North America - Year-over-year growth 2025-2030 (%)
Data Table on North America - Year-over-year growth 2025-2030 (%)
Chart on Regional Comparison - North America
Data Table on Regional Comparison - North America

12.3.1 US - Market size and forecast 2025-2030

Chart on US - Market size and forecast 2025-2030 ($ thousand)
Data Table on US - Market size and forecast 2025-2030 ($ thousand)
Chart on US - Year-over-year growth 2025-2030 (%)
Data Table on US - Year-over-year growth 2025-2030 (%)

12.3.2 Canada - Market size and forecast 2025-2030

Chart on Canada - Market size and forecast 2025-2030 ($ thousand)
Data Table on Canada - Market size and forecast 2025-2030 ($ thousand)
Chart on Canada - Year-over-year growth 2025-2030 (%)
Data Table on Canada - Year-over-year growth 2025-2030 (%)

12.3.3 Mexico - Market size and forecast 2025-2030

Chart on Mexico - Market size and forecast 2025-2030 ($ thousand)
Data Table on Mexico - Market size and forecast 2025-2030 ($ thousand)
Chart on Mexico - Year-over-year growth 2025-2030 (%)
Data Table on Mexico - Year-over-year growth 2025-2030 (%)

12.4 Europe - Market size and forecast 2025-2030

Chart on Europe - Market size and forecast 2025-2030 ($ thousand)
Data Table on Europe - Market size and forecast 2025-2030 ($ thousand)
Chart on Europe - Year-over-year growth 2025-2030 (%)
Data Table on Europe - Year-over-year growth 2025-2030 (%)
Chart on Regional Comparison - Europe
Data Table on Regional Comparison - Europe

12.4.1 Germany - Market size and forecast 2025-2030

Chart on Germany - Market size and forecast 2025-2030 ($ thousand)
Data Table on Germany - Market size and forecast 2025-2030 ($ thousand)
Chart on Germany - Year-over-year growth 2025-2030 (%)
Data Table on Germany - Year-over-year growth 2025-2030 (%)

12.4.2 France - Market size and forecast 2025-2030

Chart on France - Market size and forecast 2025-2030 ($ thousand)
Data Table on France - Market size and forecast 2025-2030 ($ thousand)
Chart on France - Year-over-year growth 2025-2030 (%)
Data Table on France - Year-over-year growth 2025-2030 (%)

12.4.3 UK - Market size and forecast 2025-2030

Chart on UK - Market size and forecast 2025-2030 ($ thousand)
Data Table on UK - Market size and forecast 2025-2030 ($ thousand)
Chart on UK - Year-over-year growth 2025-2030 (%)
Data Table on UK - Year-over-year growth 2025-2030 (%)

12.4.4 Italy - Market size and forecast 2025-2030

Chart on Italy - Market size and forecast 2025-2030 ($ thousand)
Data Table on Italy - Market size and forecast 2025-2030 ($ thousand)
Chart on Italy - Year-over-year growth 2025-2030 (%)
Data Table on Italy - Year-over-year growth 2025-2030 (%)

12.4.5 Spain - Market size and forecast 2025-2030

Chart on Spain - Market size and forecast 2025-2030 ($ thousand)
Data Table on Spain - Market size and forecast 2025-2030 ($ thousand)
Chart on Spain - Year-over-year growth 2025-2030 (%)
Data Table on Spain - Year-over-year growth 2025-2030 (%)

12.4.6 The Netherlands - Market size and forecast 2025-2030

Chart on The Netherlands - Market size and forecast 2025-2030 ($ thousand)
Data Table on The Netherlands - Market size and forecast 2025-2030 ($ thousand)
Chart on The Netherlands - Year-over-year growth 2025-2030 (%)
Data Table on The Netherlands - Year-over-year growth 2025-2030 (%)

12.5 APAC - Market size and forecast 2025-2030

Chart on APAC - Market size and forecast 2025-2030 ($ thousand)
Data Table on APAC - Market size and forecast 2025-2030 ($ thousand)
Chart on APAC - Year-over-year growth 2025-2030 (%)
Data Table on APAC - Year-over-year growth 2025-2030 (%)
Chart on Regional Comparison - APAC
Data Table on Regional Comparison - APAC

12.5.1 China - Market size and forecast 2025-2030

Chart on China - Market size and forecast 2025-2030 ($ thousand)
Data Table on China - Market size and forecast 2025-2030 ($ thousand)
Chart on China - Year-over-year growth 2025-2030 (%)
Data Table on China - Year-over-year growth 2025-2030 (%)

12.5.2 India - Market size and forecast 2025-2030

Chart on India - Market size and forecast 2025-2030 ($ thousand)
Data Table on India - Market size and forecast 2025-2030 ($ thousand)
Chart on India - Year-over-year growth 2025-2030 (%)
Data Table on India - Year-over-year growth 2025-2030 (%)

12.5.3 Japan - Market size and forecast 2025-2030

Chart on Japan - Market size and forecast 2025-2030 ($ thousand)
Data Table on Japan - Market size and forecast 2025-2030 ($ thousand)
Chart on Japan - Year-over-year growth 2025-2030 (%)
Data Table on Japan - Year-over-year growth 2025-2030 (%)

12.5.4 Australia - Market size and forecast 2025-2030

Chart on Australia - Market size and forecast 2025-2030 ($ thousand)
Data Table on Australia - Market size and forecast 2025-2030 ($ thousand)
Chart on Australia - Year-over-year growth 2025-2030 (%)
Data Table on Australia - Year-over-year growth 2025-2030 (%)

12.5.5 South Korea - Market size and forecast 2025-2030

Chart on South Korea - Market size and forecast 2025-2030 ($ thousand)
Data Table on South Korea - Market size and forecast 2025-2030 ($ thousand)
Chart on South Korea - Year-over-year growth 2025-2030 (%)
Data Table on South Korea - Year-over-year growth 2025-2030 (%)

12.5.6 Indonesia - Market size and forecast 2025-2030

Chart on Indonesia - Market size and forecast 2025-2030 ($ thousand)
Data Table on Indonesia - Market size and forecast 2025-2030 ($ thousand)
Chart on Indonesia - Year-over-year growth 2025-2030 (%)
Data Table on Indonesia - Year-over-year growth 2025-2030 (%)

12.6 South America - Market size and forecast 2025-2030

Chart on South America - Market size and forecast 2025-2030 ($ thousand)
Data Table on South America - Market size and forecast 2025-2030 ($ thousand)
Chart on South America - Year-over-year growth 2025-2030 (%)
Data Table on South America - Year-over-year growth 2025-2030 (%)
Chart on Regional Comparison - South America
Data Table on Regional Comparison - South America

12.6.1 Brazil - Market size and forecast 2025-2030

Chart on Brazil - Market size and forecast 2025-2030 ($ thousand)
Data Table on Brazil - Market size and forecast 2025-2030 ($ thousand)
Chart on Brazil - Year-over-year growth 2025-2030 (%)
Data Table on Brazil - Year-over-year growth 2025-2030 (%)

12.6.2 Argentina - Market size and forecast 2025-2030

Chart on Argentina - Market size and forecast 2025-2030 ($ thousand)
Data Table on Argentina - Market size and forecast 2025-2030 ($ thousand)
Chart on Argentina - Year-over-year growth 2025-2030 (%)
Data Table on Argentina - Year-over-year growth 2025-2030 (%)

12.6.3 Chile - Market size and forecast 2025-2030

Chart on Chile - Market size and forecast 2025-2030 ($ thousand)
Data Table on Chile - Market size and forecast 2025-2030 ($ thousand)
Chart on Chile - Year-over-year growth 2025-2030 (%)
Data Table on Chile - Year-over-year growth 2025-2030 (%)

12.7 Middle East and Africa - Market size and forecast 2025-2030

Chart on Middle East and Africa - Market size and forecast 2025-2030 ($ thousand)
Data Table on Middle East and Africa - Market size and forecast 2025-2030 ($ thousand)
Chart on Middle East and Africa - Year-over-year growth 2025-2030 (%)
Data Table on Middle East and Africa - Year-over-year growth 2025-2030 (%)
Chart on Regional Comparison - Middle East and Africa
Data Table on Regional Comparison - Middle East and Africa

12.7.1 Saudi Arabia - Market size and forecast 2025-2030

Chart on Saudi Arabia - Market size and forecast 2025-2030 ($ thousand)
Data Table on Saudi Arabia - Market size and forecast 2025-2030 ($ thousand)
Chart on Saudi Arabia - Year-over-year growth 2025-2030 (%)
Data Table on Saudi Arabia - Year-over-year growth 2025-2030 (%)

12.7.2 UAE - Market size and forecast 2025-2030

Chart on UAE - Market size and forecast 2025-2030 ($ thousand)
Data Table on UAE - Market size and forecast 2025-2030 ($ thousand)
Chart on UAE - Year-over-year growth 2025-2030 (%)
Data Table on UAE - Year-over-year growth 2025-2030 (%)

12.7.3 South Africa - Market size and forecast 2025-2030

Chart on South Africa - Market size and forecast 2025-2030 ($ thousand)
Data Table on South Africa - Market size and forecast 2025-2030 ($ thousand)
Chart on South Africa - Year-over-year growth 2025-2030 (%)
Data Table on South Africa - Year-over-year growth 2025-2030 (%)

12.7.4 Egypt - Market size and forecast 2025-2030

Chart on Egypt - Market size and forecast 2025-2030 ($ thousand)
Data Table on Egypt - Market size and forecast 2025-2030 ($ thousand)
Chart on Egypt - Year-over-year growth 2025-2030 (%)
Data Table on Egypt - Year-over-year growth 2025-2030 (%)

12.7.5 Turkey - Market size and forecast 2025-2030

Chart on Turkey - Market size and forecast 2025-2030 ($ thousand)
Data Table on Turkey - Market size and forecast 2025-2030 ($ thousand)
Chart on Turkey - Year-over-year growth 2025-2030 (%)
Data Table on Turkey - Year-over-year growth 2025-2030 (%)

12.8 Market opportunity by geography

Market opportunity by geography ($ thousand)
Data Tables on Market opportunity by geography ($ thousand)

13. Drivers, Challenges, and Opportunity

13.1 Market drivers

Increasing demand for cost-effective and energy-efficient cooling solutions
Rising environmental consciousness and demand for sustainable products
Enhanced portability, flexibility, and ease of use

13.2 Market challenges

Performance constraints in high-humidity climates
Intensive maintenance requirements and water quality issues
Heightened competition from alternative cooling technologies

13.3 Impact of drivers and challenges

Impact of drivers and challenges in 2025 and 2030

13.4 Market opportunities

Integration of smart technology and IoT connectivity
Increasing focus on enhanced design aesthetics and compact form factors
Development of multi-functional and hybrid air treatment systems

14. Competitive Landscape

14.1 Overview

14.2

Overview on criticality of inputs and factors of differentiation

14.3 Landscape disruption

Overview on factors of disruption

14.4 Industry risks

Impact of key risks on business

15. Competitive Analysis

15.1 Companies profiled

Companies covered

15.2 Company ranking index

15.3 Market positioning of companies

Matrix on companies position and classification

15.4 Aabsal Company

Aabsal Company - Overview
Aabsal Company - Product / Service
Aabsal Company - Key offerings
SWOT

15.5 Arctic Industries

Arctic Industries - Overview
Arctic Industries - Product / Service
Arctic Industries - Key offerings
SWOT

15.6 Bajaj Electricals Ltd.

Bajaj Electricals Ltd. - Overview
Bajaj Electricals Ltd. - Business segments
Bajaj Electricals Ltd. - Key offerings
Bajaj Electricals Ltd. - Segment focus
SWOT

15.7 Big Ass Fans

Big Ass Fans - Overview
Big Ass Fans - Product / Service
Big Ass Fans - Key offerings
SWOT

15.8 Bonaire Durango

Bonaire Durango - Overview
Bonaire Durango - Product / Service
Bonaire Durango - Key offerings
SWOT

15.9 Champion Cooler Corp.

Champion Cooler Corp. - Overview
Champion Cooler Corp. - Product / Service
Champion Cooler Corp. - Key offerings
SWOT

15.10 Crompton Electricals Ltd.

Crompton Electricals Ltd. - Overview
Crompton Electricals Ltd. - Business segments
Crompton Electricals Ltd. - Key offerings
Crompton Electricals Ltd. - Segment focus
SWOT

15.11 Dantherm Group AS

Dantherm Group AS - Overview
Dantherm Group AS - Product / Service
Dantherm Group AS - Key offerings
SWOT

15.12 De Longhi S.p.A

De Longhi S.p.A - Overview
De Longhi S.p.A - Business segments
De Longhi S.p.A - Key offerings
De Longhi S.p.A - Segment focus
SWOT

15.13 Havells India Ltd.

Havells India Ltd. - Overview
Havells India Ltd. - Business segments
Havells India Ltd. - Key offerings
Havells India Ltd. - Segment focus
SWOT

15.14 Hessaire Products Inc.

Hessaire Products Inc. - Overview
Hessaire Products Inc. - Product / Service
Hessaire Products Inc. - Key offerings
SWOT

15.15 Honeywell Air Comfort

Honeywell Air Comfort - Overview
Honeywell Air Comfort - Product / Service
Honeywell Air Comfort - Key offerings
SWOT

15.16 Midea Group Co. Ltd.

Midea Group Co. Ltd. - Overview
Midea Group Co. Ltd. - Business segments
Midea Group Co. Ltd. - Key news
Midea Group Co. Ltd. - Key offerings
Midea Group Co. Ltd. - Segment focus
SWOT

15.17 Orient Electric Ltd.

Orient Electric Ltd. - Overview
Orient Electric Ltd. - Business segments
Orient Electric Ltd. - Key offerings
Orient Electric Ltd. - Segment focus
SWOT

15.18 Symphony Ltd.

Symphony Ltd. - Overview
Symphony Ltd. - Product / Service
Symphony Ltd. - Key offerings
SWOT

16. Appendix

16.1 Scope of the report

Market definition
Objectives
Notes and caveats

16.2 Inclusions and exclusions checklist

Inclusions checklist
Exclusions checklist

16.3 Currency conversion rates for US$

16.4 Research methodology

16.5 Data procurement

Information sources

16.6 Data validation

16.7 Validation techniques employed for market sizing

16.8 Data synthesis

16.9 360 degree market analysis

16.10 List of abbreviations

Research Methodology

Technavio presents a detailed picture of the market by way of study, synthesis, and summation of data from multiple sources. The analysts have presented the various facets of the market with a particular focus on identifying the key industry influencers. The data thus presented is comprehensive, reliable, and the result of extensive research, both primary and secondary.

INFORMATION SOURCES

Primary sources

  • Manufacturers and suppliers
  • Channel partners
  • Industry experts
  • Strategic decision makers

Secondary sources

  • Industry journals and periodicals
  • Government data
  • Financial reports of key industry players
  • Historical data
  • Press releases

DATA ANALYSIS

Data Synthesis

  • Collation of data
  • Estimation of key figures
  • Analysis of derived insights

Data Validation

  • Triangulation with data models
  • Reference against proprietary databases
  • Corroboration with industry experts

REPORT WRITING

Qualitative

  • Market drivers
  • Market challenges
  • Market trends
  • Five forces analysis

Quantitative

  • Market size and forecast
  • Market segmentation
  • Geographical insights
  • Competitive landscape

Interested in this report?

Get your sample now to see our research methodology and insights!

Download Now

Frequently Asked Questions

Portable Evaporative Air Cooler market growth will increase by USD 107382.6 thousand thousand during 2026-2030.

The Portable Evaporative Air Cooler market is expected to grow at a CAGR of 4.9% during 2026-2030.

Portable Evaporative Air Cooler market is segmented by Product type (Semi-automatic, Automatic) End-user (Residential, Commercial) Distribution channel (Online, Offline)

Aabsal Company, Arctic Industries, Bajaj Electricals Ltd., Big Ass Fans, Bonaire Durango, Champion Cooler Corp., Crompton Electricals Ltd., Dantherm Group AS, De Longhi S.p.A, Havells India Ltd., Hessaire Products Inc., Honeywell Air Comfort, Ken Lifestyles Pvt. Ltd., Midea Group Co. Ltd., Orient Electric Ltd., Portacool LLC, Seeley International Pty Ltd., Symphony Ltd., Usha International Ltd., Voltas Ltd. are a few of the key vendors in the Portable Evaporative Air Cooler market.

North America will register the highest growth rate of 51% among the other regions. Therefore, the Portable Evaporative Air Cooler market in North America is expected to garner significant business opportunities for the vendors during the forecast period.

US, Canada, Mexico, Germany, France, UK, Italy, Spain, The Netherlands, China, India, Japan, Australia, South Korea, Indonesia, Brazil, Argentina, Chile, Saudi Arabia, UAE, South Africa, Egypt, Turkey

  • Increasing demand for cost-effective and energy-efficient cooling solutions is the driving factor this market.

The Portable Evaporative Air Cooler market vendors should focus on grabbing business opportunities from the Product type segment as it accounted for the largest market share in the base year.
RIA - Research AI Assistant
Ask RIA
