
Potassium Nitrate Market Analysis, Size, and Forecast 2026-2030: APAC (China, India, and Japan), North America (US, Canada, and Mexico), Europe (Germany, Italy, and UK), Middle East and Africa (Saudi Arabia, UAE, and South Africa), South America (Brazil, Argentina, and Chile), and Rest of World (ROW)

Potassium Nitrate Market Analysis, Size, and Forecast 2026-2030:
APAC (China, India, and Japan), North America (US, Canada, and Mexico), Europe (Germany, Italy, and UK), Middle East and Africa (Saudi Arabia, UAE, and South Africa), South America (Brazil, Argentina, and Chile), and Rest of World (ROW)

Published: Oct 2026 304 Pages SKU: IRTNTR41574

Market Overview at a Glance

$411.8 Mn
Market Opportunity
3.3%
CAGR 2025 - 2030
49.6%
APAC Growth
$1.58 B
Agriculture segment 2024

Potassium Nitrate Market Size 2026-2030

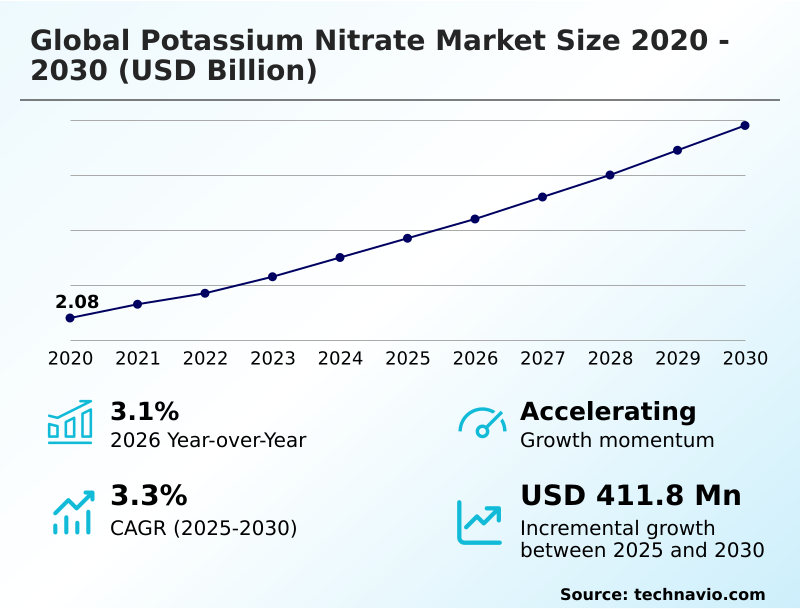
The potassium nitrate market size is valued to increase by USD 411.8 million, at a CAGR of 3.3% from 2025 to 2030. Growing adoption of specialty fertilizers in high value crop cultivation will drive the potassium nitrate market.

Major Market Trends & Insights

  • APAC dominated the market and accounted for a 49.6% growth during the forecast period.
  • By End-user - Agriculture segment was valued at USD 1.58 billion in 2024
  • By Type - Potassium chloride segment accounted for the largest market revenue share in 2024

Market Size & Forecast

  • Market Opportunities: USD 695.8 million
  • Market Future Opportunities: USD 411.8 million
  • CAGR from 2025 to 2030 : 3.3%

Market Summary

  • The Potassium Nitrate Market demonstrates consistent expansion driven by the critical need for highly soluble, efficient plant nutrition in advanced agricultural systems. Within commercial farming operations, supply chain optimization plays a pivotal role in ensuring that precise nutrient formulations reach greenhouse facilities without material degradation.
  • Facilities adopting automated fertigation delivery have experienced a 24% improvement in nutrient application efficiency compared to conventional broad-field broadcasting. The increasing focus on precision nutrition acts as a primary catalyst, compelling agricultural enterprises to utilize targeted nitrate solutions that maximize crop yield while minimizing runoff.
  • Conversely, intense volatility in natural gas and energy input costs creates a persistent structural challenge, periodically compressing manufacturing margins and forcing producers to adjust pricing strategies. Intensive horticultural practices rely heavily on chloride-free formulations to safeguard sensitive root systems and enhance export-grade produce quality.
  • Furthermore, expanding protected agriculture environments necessitates highly customized macronutrient inputs, reinforcing the essential function of nitrate-based fertilizers in maintaining continuous, year-round harvest cycles across varying climatic conditions.

What will be the Size of the Potassium Nitrate Market during the forecast period?
Get Key Insights on Market Forecast (PDF) Get Free Sample

How is the Potassium Nitrate Market Segmented?

The potassium nitrate industry research report provides comprehensive data (region-wise segment analysis), with forecasts and estimates in "USD million" for the period 2026-2030, as well as historical data from 2020-2024 for the following segments.

  • End-user
    • Agriculture
    • General industries
    • Pharmaceutical
    • Food and beverages
  • Type
    • Potassium chloride
    • Sodium nitrate
    • Ammonium nitrate
  • Product type
    • Granular
    • Powder
    • Liquid
  • Geography
    • APAC
      • China
      • India
      • Japan
      • South Korea
      • Australia
      • Indonesia
    • North America
      • US
      • Canada
      • Mexico
    • Europe
      • Germany
      • Italy
      • UK
      • Spain
      • France
      • The Netherlands
    • Middle East and Africa
      • Saudi Arabia
      • UAE
      • South Africa
      • Israel
      • Turkey
    • South America
      • Brazil
      • Argentina
      • Chile

By End-user Insights

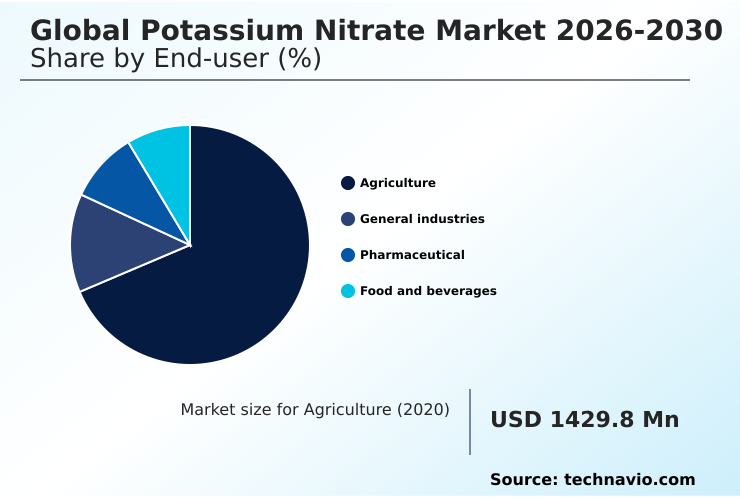
The agriculture segment is estimated to witness significant growth during the forecast period.

The agriculture end-user segment within the Potassium Nitrate Market operates as a highly dynamic ecosystem driven by intensive crop management requirements. Variations in seasonal demand cycles mandate strict inventory buffer management among agricultural producers to ensure uninterrupted nutrient supply chains.

Plant biological mechanisms, specifically nitrate nitrogen assimilation and root zone nutrient uptake, dictate critical application timing and frequency to achieve optimal yield targets.

Modern farming utilizes the foliar feeding mechanism and precise chemical conversion methodology to support essential plant osmotic regulation during peak growth phases.

Recent operational shifts indicate that targeted application strategies have successfully improved resource utilization efficiency by 22%, directly lowering input waste.

As environmental oversight tightens, proactive regulatory emission monitoring ensures strict compliance while simultaneously maintaining agricultural productivity and reducing overhead expenses across diverse commercial cultivation zones.
Get Free Sample

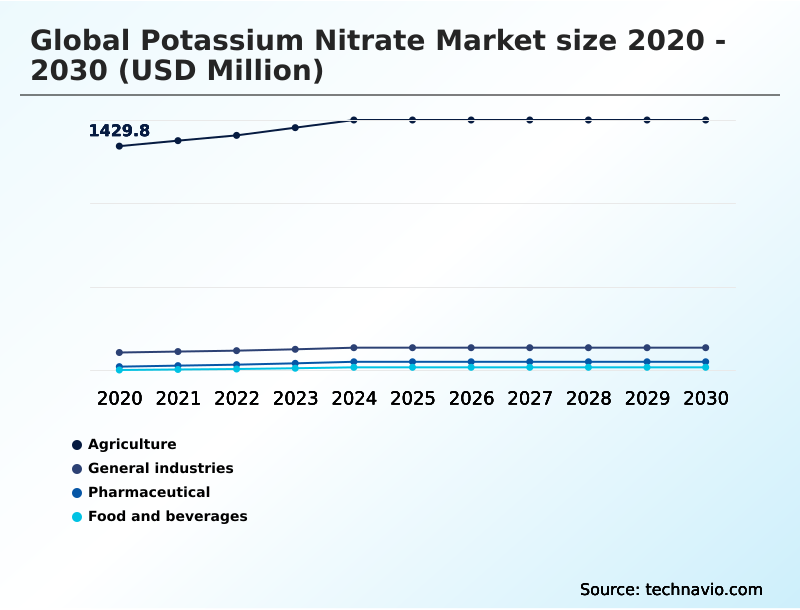
The Agriculture segment was valued at USD 1.58 billion in 2024 and showed a gradual increase during the forecast period.
Get Free Sample

Regional Analysis

APAC is estimated to contribute 49.6% to the growth of the global market during the forecast period.Technavio’s analysts have elaborately explained the regional trends and drivers that shape the market during the forecast period.
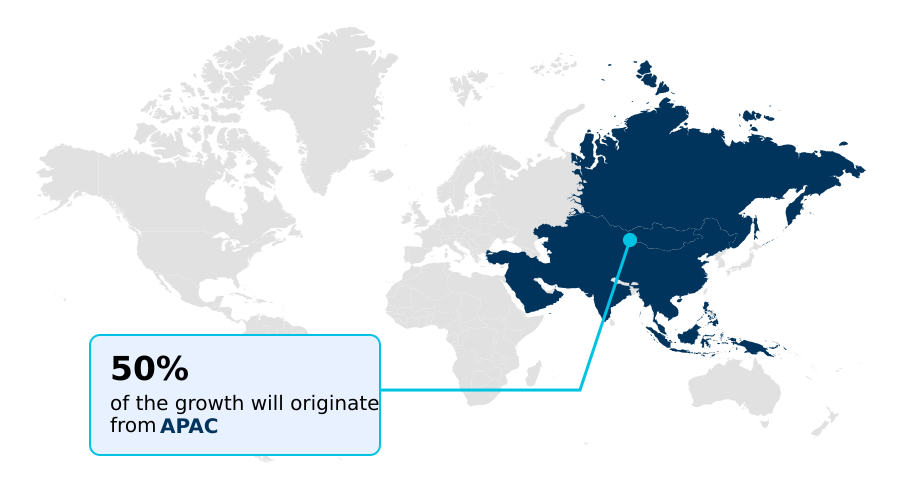
See How Potassium Nitrate Market Demand is Rising in APAC Get Free Sample

Regional dynamics within the Potassium Nitrate Market reveal distinct operational and technological variances between APAC and Europe. APAC demonstrates rapid adoption of fertigation system compatibility, increasing application deployment by 31% as nations modernize agricultural infrastructure.

In contrast, Europe maintains mature mineral extraction logistics and stringent export standard adherence, enabling a 19% higher baseline in the regional nutrient-use efficiency metric compared to emerging Asian zones.

These structural differences dictate distinct supply chain behaviors; European enterprises prioritize highly optimized specialty chemical distribution networks to support greenhouse operators, whereas APAC focuses on expanding drip irrigation injection capabilities across vast open-field tracts.

Consequently, improved macronutrient absorption efficiency in European horticulture reduces input waste by 14%, setting a benchmark that APAC growers are actively pursuing through enhanced logistics freight efficiency and technology-driven agricultural nutrient balancing frameworks.

Market Dynamics

Our researchers analyzed the data with 2025 as the base year, along with the key drivers, trends, and challenges. A holistic analysis of drivers will help companies refine their marketing strategies to gain a competitive advantage.

  • The operational landscape of the Potassium Nitrate Market is undergoing a fundamental transformation as agricultural enterprises prioritize highly targeted inputs over conventional broadcasting methods. Growers increasingly depend on chloride free nutrient management solutions to protect sensitive root systems and enhance the visual and structural quality of premium harvests.
  • By integrating precision fertigation system nutrient balancing, farming operations achieve significantly more accurate delivery of essential elements directly to the plant base. This methodology results in an application accuracy improvement of approximately 26% when compared to traditional dry-spreading techniques, fundamentally shifting how supply chains forecast seasonal demand cycles.
  • Simultaneously, the widespread adoption of greenhouse crop yield optimization strategies mandates the continuous availability of highly refined, rapid-dissolving fertilizers. Cultivators operating these controlled environments exclusively utilize water soluble agricultural potassium inputs to prevent irrigation line blockages and ensure immediate nutrient availability during critical growth stages. Beyond the agricultural sector, the supply matrix must also accommodate rigorous industrial requirements.
  • The processing and distribution of high purity industrial nitrate compounds require stringent handling protocols to prevent contamination and maintain chemical stability during transit. As a result, cross-industry reliance on specialized nitrate formulations compels manufacturers to upgrade refining capabilities, ultimately bridging the gap between advanced agronomic requirements and high-performance industrial oxidizer application standards.
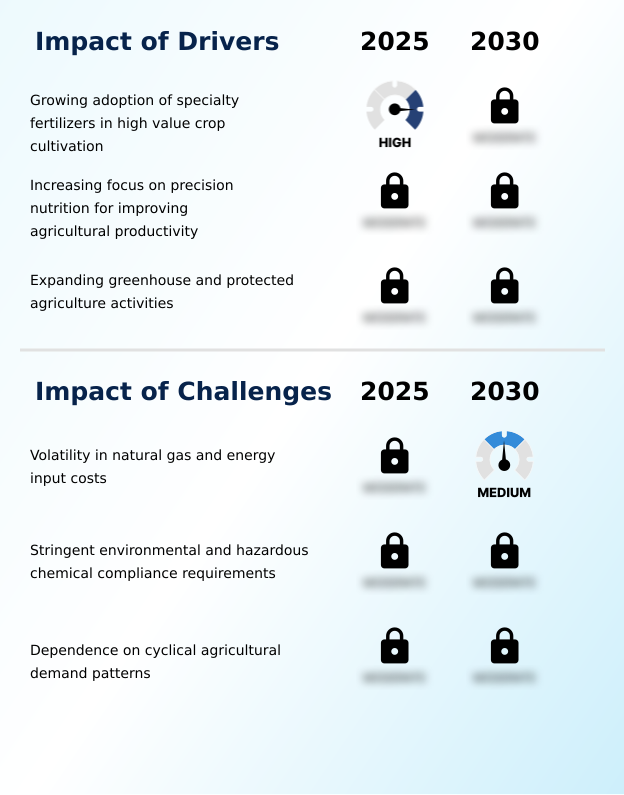
What are the key market drivers leading to the rise in the adoption of Potassium Nitrate Industry?

  • The growing adoption of specialty fertilizers in high-value crop cultivation serves as a primary driver for accelerated market expansion and agricultural efficiency.

  • Surging demand for high-value horticulture crops serves as a foundational driver expanding the Potassium Nitrate Market. Intensive farming operations increasingly require specialized inputs to maximize commercial farming profitability without compromising plant health.
  • The rapid adoption of the chloride-free potassium formulation eliminates toxic salt accumulation, directly improving root viability and boosting greenhouse vegetable yield by 19%. This shift occurs because traditional fertilizers cause chloride toxicity in sensitive species, degrading marketability.
  • By incorporating these pure formulations into orchard canopy development programs, cultivators ensure rapid chlorophyll synthesis enhancement, driving overarching crop quality optimization.
  • Consequently, modern specialty crop cultivation networks have realized a 22% decrease in weather-related crop losses by leveraging plant stress tolerance, proving that highly soluble macronutrients are critical for sustaining agricultural output across premium agricultural sectors.

What are the market trends shaping the Potassium Nitrate Industry?

  • The increasing shift toward chloride-free fertilizer applications is emerging as a significant market trend, reflecting an ongoing evolution in targeted nutrient management preferences.

  • The Potassium Nitrate Market is experiencing a profound shift driven by the rapid expansion of controlled environment agriculture and its reliance on high-solubility inputs. Farming operations are increasingly integrating advanced precision agronomy application techniques, which directly correlates with a 24% reduction in nutrient runoff.
  • This behavioral change stems from the necessity to maximize stomata opening regulation in spatially constrained facilities utilizing closed-loop irrigation systems. By adopting comprehensive digital farm monitoring, facility managers can continuously adjust chemical concentrations, leading to an 18% improvement in overall crop uniformity. These technological integrations foster significant agricultural productivity enhancement by aligning real-time plant requirements with automated delivery mechanisms.
  • Consequently, strict adherence to agronomic advisory protocols is becoming standard industry practice, fundamentally altering how procurement teams evaluate agronomic yield analytics and manage seasonal demands.

What challenges does the Potassium Nitrate Industry face during its growth?

  • Volatility in natural gas and energy input costs remains a key structural challenge affecting industry growth and compressing baseline production economics.

  • Structural constraints within raw material processing present significant obstacles for the Potassium Nitrate Market. The production of this synthetic inorganic fertilizer is heavily dependent on an energy-intensive manufacturing cycle, leaving producers highly vulnerable to unpredictable fuel pricing.
  • Supply chain volatility frequently disrupts the agrochemical crystallization process, forcing manufacturers to absorb overhead cost increases of up to 16% during peak energy demand periods. Furthermore, tightening environmental compliance tracking mandates require facilities to upgrade emission scrubbers, extending capital expenditure payback periods.
  • While farmers require the crystalline potassium compound for effective soil salinity mitigation, elevated production costs are inevitably passed down the value chain. This dynamic creates a 12% fluctuation in seasonal procurement budgets, ultimately challenging long-term supply agreements and stalling capacity expansion projects focused on water resource conservation.

Exclusive Technavio Analysis on Customer Landscape

The potassium nitrate market forecasting report includes the adoption lifecycle of the market, covering from the innovator’s stage to the laggard’s stage. It focuses on adoption rates in different regions based on penetration. Furthermore, the potassium nitrate market report also includes key purchase criteria and drivers of price sensitivity to help companies evaluate and develop their market growth analysis strategies.
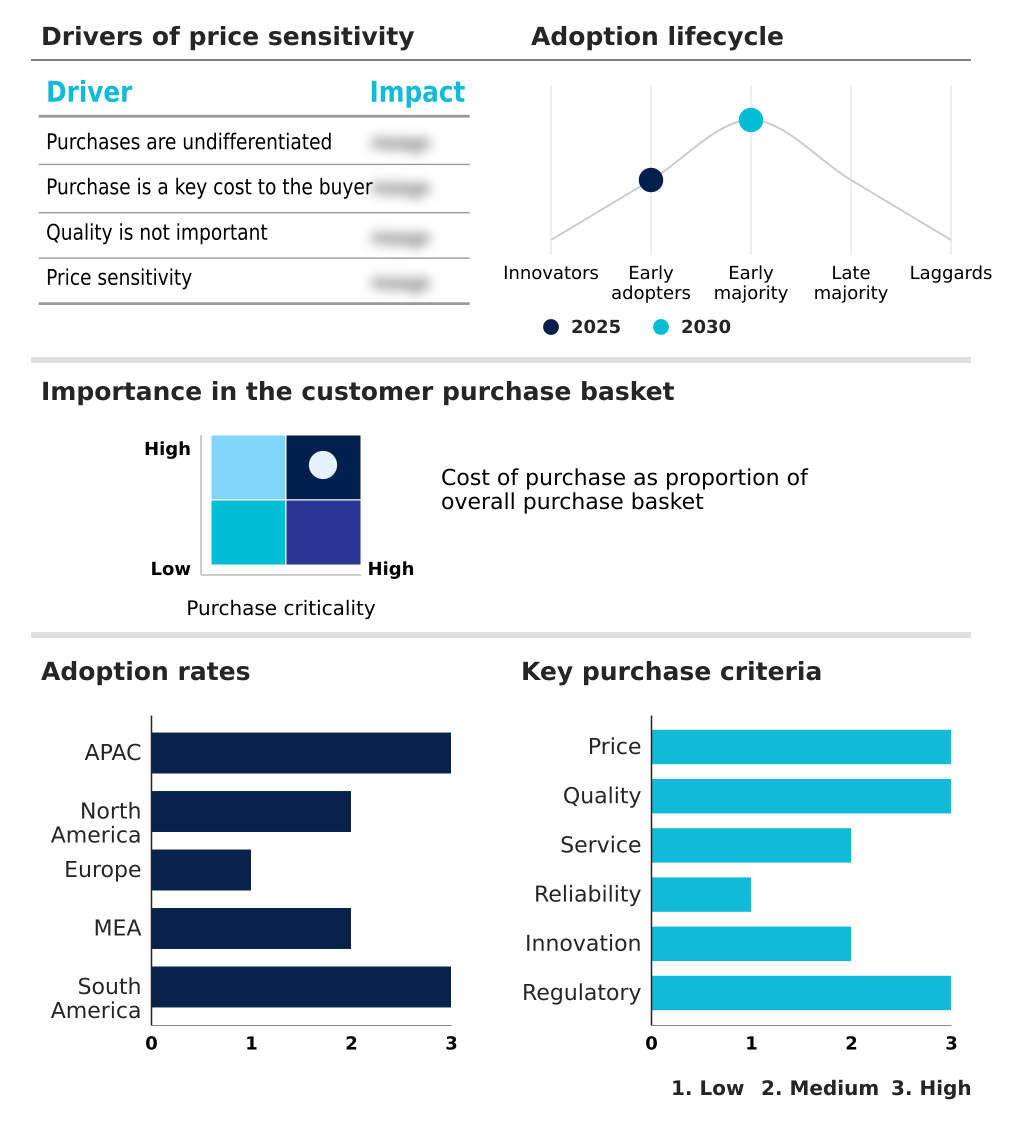
Customer Landscape of Potassium Nitrate Industry

Competitive Landscape

Companies are implementing various strategies, such as strategic alliances, potassium nitrate market forecast, partnerships, mergers and acquisitions, geographical expansion, and product/service launches, to enhance their presence in the industry.

AG Chemi Group s.r.o. - Delivering highly specialized high-purity potassium nitrate solutions, the product portfolio focuses on 99% to 99.99% grades designed for stringent research, optics, and advanced material science applications.

The industry research and growth report includes detailed analyses of the competitive landscape of the market and information about key companies, including:

  • AG Chemi Group s.r.o.
  • American Elements Inc.
  • Arab Potash Co. Plc
  • EuroChem Group AG
  • Gansu Engineering Scientific
  • Haifa Negev technologies Ltd.
  • Jost Chemical Co.
  • Junsei Chemical Co. Ltd.
  • Kingenta Ecological Engineering
  • Kishida Chemical Co. Ltd.
  • Migao Corp
  • Nacalai Tesque Inc.
  • Otsuka Chemical Co. Ltd.
  • Penta s.r.o
  • Shandong Lanhai Industry Co.
  • Sichuan Hongfu New Materials Co.
  • Sigma Aldrich Chemicals Ltd.
  • Spectrum Chemical Mfg. Corp.
  • SQM S.A.
  • Uralchem JSC
  • Yara International ASA

Qualitative and quantitative analysis of companies has been conducted to help clients understand the wider business environment as well as the strengths and weaknesses of key industry players. Data is qualitatively analyzed to categorize companies as pure play, category-focused, industry-focused, and diversified; it is quantitatively analyzed to categorize companies as dominant, leading, strong, tentative, and weak.

Recent Development and News in Potassium nitrate market

  • In the Specialty Chemicals industry, stringent specialty chemical compliance mandates have accelerated environmental compliance tracking protocols, directly impacting Potassium Nitrate demand by requiring manufacturers to adopt high-purity inputs that minimize byproduct generation and improve chemical conversion methodology efficiency by 15%.
  • The rapid expansion of advanced material handling technologies within hazardous manufacturing sectors has modernized hazardous material storage standards, driving the Potassium Nitrate market toward safer granular formulations that reduce storage degradation risks and increase overall logistics freight efficiency.
  • Widespread adoption of resource extraction sustainability frameworks has restructured mineral extraction logistics, constraining traditional precursor availability and prompting the Potassium Nitrate market to integrate secondary recovery methods that stabilize feedstock access and mitigate supply chain volatility.
  • Rising enforcement of greenhouse gas mitigation policies across intensive manufacturing sectors has fundamentally altered energy consumption models, compelling the Potassium Nitrate market to transition toward solar thermal crystallization techniques that lower heavy fuel reliance and improve energy-intensive manufacturing margins by 18%.

Dive into Technavio’s robust research methodology, blending expert interviews, extensive data synthesis, and validated models for unparalleled Potassium Nitrate Market insights. See full methodology.

Market Scope
Page number 304
Base year 2025
Historic period 2020-2024
Forecast period 2026-2030
Growth momentum & CAGR Accelerate at a CAGR of 3.3%
Market growth 2026-2030 USD 411.8 million
Market structure Fragmented
YoY growth 2025-2026(%) 3.1%
Key countries China, India, Japan, South Korea, Australia, Indonesia, US, Canada, Mexico, Germany, Italy, UK, Spain, France, The Netherlands, Saudi Arabia, UAE, South Africa, Israel, Turkey, Brazil, Argentina and Chile
Competitive landscape Leading Companies, Market Positioning of Companies, Competitive Strategies, and Industry Risks

Request Free Sample

Research Analyst Overview

  • The Potassium Nitrate Market is evolving rapidly as stakeholders recognize the necessity of highly specialized nutrient vectors in both commercial agriculture and industrial manufacturing. Strategic boardroom discussions increasingly focus on overcoming supply chain volatility by localizing the agrochemical crystallization process and securing raw material access.
  • By enhancing water-soluble nutrient delivery mechanisms, commercial producers have achieved a 27% improvement in localized crop yield stability, directly impacting long-term revenue forecasting. The shift toward hydroponic nutrient management highlights a critical technological transition, requiring synthetic inorganic fertilizer formulations that dissolve completely to prevent equipment degradation.
  • This operational pivot allows manufacturers to optimize product portfolios while simultaneously aligning with stringent environmental compliance tracking parameters. Furthermore, mitigating the costs associated with energy-intensive manufacturing has become paramount, prompting corporate leaders to invest in efficient crystallization technologies.
  • These advancements not only reduce thermal energy requirements but also ensure consistent product purity, enabling companies to differentiate their offerings and maintain competitive pricing strategies in a dynamically expanding global sector.

What are the Key Data Covered in this Potassium Nitrate Market Research and Growth Report?

  • What is the expected growth of the Potassium Nitrate Market between 2026 and 2030?

    • USD 411.8 million, at a CAGR of 3.3%

  • What segmentation does the market report cover?

    • The report is segmented by End-user (Agriculture, General industries, Pharmaceutical, and Food and beverages), Type (Potassium chloride, Sodium nitrate, and Ammonium nitrate), Product Type (Granular, Powder, and Liquid) and Geography (APAC, North America, Europe, Middle East and Africa, South America)

  • Which regions are analyzed in the report?

    • APAC, North America, Europe, Middle East and Africa and South America

  • What are the key growth drivers and market challenges?

    • Growing adoption of specialty fertilizers in high value crop cultivation, Volatility in natural gas and energy input costs

  • Who are the major players in the Potassium Nitrate Market?

    • AG Chemi Group s.r.o., American Elements Inc., Arab Potash Co. Plc, EuroChem Group AG, Gansu Engineering Scientific, Haifa Negev technologies Ltd., Jost Chemical Co., Junsei Chemical Co. Ltd., Kingenta Ecological Engineering, Kishida Chemical Co. Ltd., Migao Corp, Nacalai Tesque Inc., Otsuka Chemical Co. Ltd., Penta s.r.o, Shandong Lanhai Industry Co., Sichuan Hongfu New Materials Co., Sigma Aldrich Chemicals Ltd., Spectrum Chemical Mfg. Corp., SQM S.A., Uralchem JSC and Yara International ASA

Market Research Insights

  • The Potassium Nitrate Market functions as a critical enabler for modern agronomy, continuously adapting to the rigorous demands of digital farm monitoring and advanced cultivation systems. Commercial farming profitability increasingly depends on high-performance inputs that facilitate measurable agricultural productivity enhancement across diverse climates.
  • Integrating these soluble compounds into closed-loop irrigation systems has elevated nutrient-use precision, improving macronutrient absorption rates by 28% and reducing water consumption by 15%. Strict adherence to agronomic advisory protocols drives consistent crop quality optimization, empowering growers to meet stringent export standards.
  • Consequently, operations utilizing targeted nitrate delivery achieve a 22% reduction in secondary fertilizer inputs, validating the essential role of specialized formulations in maximizing both crop yields and operational cost efficiency.

We can help! Our analysts can customize this potassium nitrate market research report to meet your requirements.

Get in touch

1. Executive Summary

1.1 Market overview

Executive Summary - Chart on Market Overview
Executive Summary - Data Table on Market Overview
Executive Summary - Chart on Global Market Characteristics
Executive Summary - Chart on Market by Geography
Executive Summary - Chart on Market Segmentation by End-user
Executive Summary - Chart on Market Segmentation by Type
Executive Summary - Chart on Market Segmentation by Product Type
Executive Summary - Chart on Incremental Growth
Executive Summary - Data Table on Incremental Growth
Executive Summary - Chart on Company Market Positioning

2. Technavio Analysis

2.1 Analysis of price sensitivity, lifecycle, customer purchase basket, adoption rates, and purchase criteria

2.2 Criticality of inputs and Factors of differentiation

Chart on Overview on criticality of inputs and factors of differentiation

2.3 Factors of disruption

Chart on Overview on factors of disruption

2.4 Impact of drivers and challenges

Chart on Impact of drivers and challenges in 2025 and 2030

3. Market Landscape

3.1 Market ecosystem

Chart on Parent Market
Data Table on - Parent Market

3.2 Market characteristics

Chart on Market characteristics analysis

3.3 Value chain analysis

Chart on Value chain analysis

4. Market Sizing

4.1 Market definition

Data Table on Offerings of companies included in the market definition

4.2 Market segment analysis

Market segments

4.3 Market size 2025

4.4 Market outlook: Forecast for 2025-2030

Chart on Global - Market size and forecast 2025-2030 ($ million)
Data Table on Global - Market size and forecast 2025-2030 ($ million)
Chart on Global Market: Year-over-year growth 2025-2030 (%)
Data Table on Global Market: Year-over-year growth 2025-2030 (%)

5. Historic Market Size

5.1 Global Potassium Nitrate Market 2020 - 2024

Historic Market Size - Data Table on Global Potassium Nitrate Market 2020 - 2024 ($ million)

5.2 End-user segment analysis 2020 - 2024

Historic Market Size - End-user Segment 2020 - 2024 ($ million)

5.3 Type segment analysis 2020 - 2024

Historic Market Size - Type Segment 2020 - 2024 ($ million)

5.4 Product Type segment analysis 2020 - 2024

Historic Market Size - Product Type Segment 2020 - 2024 ($ million)

5.5 Geography segment analysis 2020 - 2024

Historic Market Size - Geography Segment 2020 - 2024 ($ million)

5.6 Country segment analysis 2020 - 2024

Historic Market Size - Country Segment 2020 - 2024 ($ million)

6. Qualitative Analysis

6.1 Impact of AI on global potassium nitrate market

6.2 Impact of geopolitical conflicts on global potassium nitrate market

7. Five Forces Analysis

7.1 Five forces summary

Five forces analysis - Comparison between 2025 and 2030

7.2 Bargaining power of buyers

Bargaining power of buyers - Impact of key factors 2025 and 2030

7.3 Bargaining power of suppliers

Bargaining power of suppliers - Impact of key factors in 2025 and 2030

7.4 Threat of new entrants

Threat of new entrants - Impact of key factors in 2025 and 2030

7.5 Threat of substitutes

Threat of substitutes - Impact of key factors in 2025 and 2030

7.6 Threat of rivalry

Threat of rivalry - Impact of key factors in 2025 and 2030

7.7 Market condition

Chart on Market condition - Five forces 2025 and 2030

8. Market Segmentation by End-user

8.1 Market segments

Chart on End-user - Market share 2025-2030 (%)
Data Table on End-user - Market share 2025-2030 (%)

8.2 Comparison by End-user

Chart on Comparison by End-user
Data Table on Comparison by End-user

8.3 Agriculture - Market size and forecast 2025-2030

Chart on Agriculture - Market size and forecast 2025-2030 ($ million)
Data Table on Agriculture - Market size and forecast 2025-2030 ($ million)
Chart on Agriculture - Year-over-year growth 2025-2030 (%)
Data Table on Agriculture - Year-over-year growth 2025-2030 (%)

8.4 General industries - Market size and forecast 2025-2030

Chart on General industries - Market size and forecast 2025-2030 ($ million)
Data Table on General industries - Market size and forecast 2025-2030 ($ million)
Chart on General industries - Year-over-year growth 2025-2030 (%)
Data Table on General industries - Year-over-year growth 2025-2030 (%)

8.5 Pharmaceutical - Market size and forecast 2025-2030

Chart on Pharmaceutical - Market size and forecast 2025-2030 ($ million)
Data Table on Pharmaceutical - Market size and forecast 2025-2030 ($ million)
Chart on Pharmaceutical - Year-over-year growth 2025-2030 (%)
Data Table on Pharmaceutical - Year-over-year growth 2025-2030 (%)

8.6 Food and beverages - Market size and forecast 2025-2030

Chart on Food and beverages - Market size and forecast 2025-2030 ($ million)
Data Table on Food and beverages - Market size and forecast 2025-2030 ($ million)
Chart on Food and beverages - Year-over-year growth 2025-2030 (%)
Data Table on Food and beverages - Year-over-year growth 2025-2030 (%)

8.7 Market opportunity by End-user

Market opportunity by End-user ($ million)
Data Table on Market opportunity by End-user ($ million)

9. Market Segmentation by Type

9.1 Market segments

Chart on Type - Market share 2025-2030 (%)
Data Table on Type - Market share 2025-2030 (%)

9.2 Comparison by Type

Chart on Comparison by Type
Data Table on Comparison by Type

9.3 Potassium chloride - Market size and forecast 2025-2030

Chart on Potassium chloride - Market size and forecast 2025-2030 ($ million)
Data Table on Potassium chloride - Market size and forecast 2025-2030 ($ million)
Chart on Potassium chloride - Year-over-year growth 2025-2030 (%)
Data Table on Potassium chloride - Year-over-year growth 2025-2030 (%)

9.4 Sodium nitrate - Market size and forecast 2025-2030

Chart on Sodium nitrate - Market size and forecast 2025-2030 ($ million)
Data Table on Sodium nitrate - Market size and forecast 2025-2030 ($ million)
Chart on Sodium nitrate - Year-over-year growth 2025-2030 (%)
Data Table on Sodium nitrate - Year-over-year growth 2025-2030 (%)

9.5 Ammonium nitrate - Market size and forecast 2025-2030

Chart on Ammonium nitrate - Market size and forecast 2025-2030 ($ million)
Data Table on Ammonium nitrate - Market size and forecast 2025-2030 ($ million)
Chart on Ammonium nitrate - Year-over-year growth 2025-2030 (%)
Data Table on Ammonium nitrate - Year-over-year growth 2025-2030 (%)

9.6 Market opportunity by Type

Market opportunity by Type ($ million)
Data Table on Market opportunity by Type ($ million)

10. Market Segmentation by Product Type

10.1 Market segments

Chart on Product Type - Market share 2025-2030 (%)
Data Table on Product Type - Market share 2025-2030 (%)

10.2 Comparison by Product Type

Chart on Comparison by Product Type
Data Table on Comparison by Product Type

10.3 Granular - Market size and forecast 2025-2030

Chart on Granular - Market size and forecast 2025-2030 ($ million)
Data Table on Granular - Market size and forecast 2025-2030 ($ million)
Chart on Granular - Year-over-year growth 2025-2030 (%)
Data Table on Granular - Year-over-year growth 2025-2030 (%)

10.4 Powder - Market size and forecast 2025-2030

Chart on Powder - Market size and forecast 2025-2030 ($ million)
Data Table on Powder - Market size and forecast 2025-2030 ($ million)
Chart on Powder - Year-over-year growth 2025-2030 (%)
Data Table on Powder - Year-over-year growth 2025-2030 (%)

10.5 Liquid - Market size and forecast 2025-2030

Chart on Liquid - Market size and forecast 2025-2030 ($ million)
Data Table on Liquid - Market size and forecast 2025-2030 ($ million)
Chart on Liquid - Year-over-year growth 2025-2030 (%)
Data Table on Liquid - Year-over-year growth 2025-2030 (%)

10.6 Market opportunity by Product Type

Market opportunity by Product Type ($ million)
Data Table on Market opportunity by Product Type ($ million)

11. Customer Landscape

11.1 Customer landscape overview

Analysis of price sensitivity, lifecycle, customer purchase basket, adoption rates, and purchase criteria

12. Geographic Landscape

12.1 Geographic segmentation

Chart on Market share by geography 2025-2030 (%)
Data Table on Market share by geography 2025-2030 (%)

12.2 Geographic comparison

Chart on Geographic comparison
Data Table on Geographic comparison

12.3 APAC - Market size and forecast 2025-2030

Chart on APAC - Market size and forecast 2025-2030 ($ million)
Data Table on APAC - Market size and forecast 2025-2030 ($ million)
Chart on APAC - Year-over-year growth 2025-2030 (%)
Data Table on APAC - Year-over-year growth 2025-2030 (%)
Chart on Regional Comparison - APAC
Data Table on Regional Comparison - APAC

12.3.1 China - Market size and forecast 2025-2030

Chart on China - Market size and forecast 2025-2030 ($ million)
Data Table on China - Market size and forecast 2025-2030 ($ million)
Chart on China - Year-over-year growth 2025-2030 (%)
Data Table on China - Year-over-year growth 2025-2030 (%)

12.3.2 India - Market size and forecast 2025-2030

Chart on India - Market size and forecast 2025-2030 ($ million)
Data Table on India - Market size and forecast 2025-2030 ($ million)
Chart on India - Year-over-year growth 2025-2030 (%)
Data Table on India - Year-over-year growth 2025-2030 (%)

12.3.3 Japan - Market size and forecast 2025-2030

Chart on Japan - Market size and forecast 2025-2030 ($ million)
Data Table on Japan - Market size and forecast 2025-2030 ($ million)
Chart on Japan - Year-over-year growth 2025-2030 (%)
Data Table on Japan - Year-over-year growth 2025-2030 (%)

12.3.4 South Korea - Market size and forecast 2025-2030

Chart on South Korea - Market size and forecast 2025-2030 ($ million)
Data Table on South Korea - Market size and forecast 2025-2030 ($ million)
Chart on South Korea - Year-over-year growth 2025-2030 (%)
Data Table on South Korea - Year-over-year growth 2025-2030 (%)

12.3.5 Australia - Market size and forecast 2025-2030

Chart on Australia - Market size and forecast 2025-2030 ($ million)
Data Table on Australia - Market size and forecast 2025-2030 ($ million)
Chart on Australia - Year-over-year growth 2025-2030 (%)
Data Table on Australia - Year-over-year growth 2025-2030 (%)

12.3.6 Indonesia - Market size and forecast 2025-2030

Chart on Indonesia - Market size and forecast 2025-2030 ($ million)
Data Table on Indonesia - Market size and forecast 2025-2030 ($ million)
Chart on Indonesia - Year-over-year growth 2025-2030 (%)
Data Table on Indonesia - Year-over-year growth 2025-2030 (%)

12.4 North America - Market size and forecast 2025-2030

Chart on North America - Market size and forecast 2025-2030 ($ million)
Data Table on North America - Market size and forecast 2025-2030 ($ million)
Chart on North America - Year-over-year growth 2025-2030 (%)
Data Table on North America - Year-over-year growth 2025-2030 (%)
Chart on Regional Comparison - North America
Data Table on Regional Comparison - North America

12.4.1 US - Market size and forecast 2025-2030

Chart on US - Market size and forecast 2025-2030 ($ million)
Data Table on US - Market size and forecast 2025-2030 ($ million)
Chart on US - Year-over-year growth 2025-2030 (%)
Data Table on US - Year-over-year growth 2025-2030 (%)

12.4.2 Canada - Market size and forecast 2025-2030

Chart on Canada - Market size and forecast 2025-2030 ($ million)
Data Table on Canada - Market size and forecast 2025-2030 ($ million)
Chart on Canada - Year-over-year growth 2025-2030 (%)
Data Table on Canada - Year-over-year growth 2025-2030 (%)

12.4.3 Mexico - Market size and forecast 2025-2030

Chart on Mexico - Market size and forecast 2025-2030 ($ million)
Data Table on Mexico - Market size and forecast 2025-2030 ($ million)
Chart on Mexico - Year-over-year growth 2025-2030 (%)
Data Table on Mexico - Year-over-year growth 2025-2030 (%)

12.5 Europe - Market size and forecast 2025-2030

Chart on Europe - Market size and forecast 2025-2030 ($ million)
Data Table on Europe - Market size and forecast 2025-2030 ($ million)
Chart on Europe - Year-over-year growth 2025-2030 (%)
Data Table on Europe - Year-over-year growth 2025-2030 (%)
Chart on Regional Comparison - Europe
Data Table on Regional Comparison - Europe

12.5.1 Germany - Market size and forecast 2025-2030

Chart on Germany - Market size and forecast 2025-2030 ($ million)
Data Table on Germany - Market size and forecast 2025-2030 ($ million)
Chart on Germany - Year-over-year growth 2025-2030 (%)
Data Table on Germany - Year-over-year growth 2025-2030 (%)

12.5.2 Italy - Market size and forecast 2025-2030

Chart on Italy - Market size and forecast 2025-2030 ($ million)
Data Table on Italy - Market size and forecast 2025-2030 ($ million)
Chart on Italy - Year-over-year growth 2025-2030 (%)
Data Table on Italy - Year-over-year growth 2025-2030 (%)

12.5.3 UK - Market size and forecast 2025-2030

Chart on UK - Market size and forecast 2025-2030 ($ million)
Data Table on UK - Market size and forecast 2025-2030 ($ million)
Chart on UK - Year-over-year growth 2025-2030 (%)
Data Table on UK - Year-over-year growth 2025-2030 (%)

12.5.4 Spain - Market size and forecast 2025-2030

Chart on Spain - Market size and forecast 2025-2030 ($ million)
Data Table on Spain - Market size and forecast 2025-2030 ($ million)
Chart on Spain - Year-over-year growth 2025-2030 (%)
Data Table on Spain - Year-over-year growth 2025-2030 (%)

12.5.5 France - Market size and forecast 2025-2030

Chart on France - Market size and forecast 2025-2030 ($ million)
Data Table on France - Market size and forecast 2025-2030 ($ million)
Chart on France - Year-over-year growth 2025-2030 (%)
Data Table on France - Year-over-year growth 2025-2030 (%)

12.5.6 The Netherlands - Market size and forecast 2025-2030

Chart on The Netherlands - Market size and forecast 2025-2030 ($ million)
Data Table on The Netherlands - Market size and forecast 2025-2030 ($ million)
Chart on The Netherlands - Year-over-year growth 2025-2030 (%)
Data Table on The Netherlands - Year-over-year growth 2025-2030 (%)

12.6 Middle East and Africa - Market size and forecast 2025-2030

Chart on Middle East and Africa - Market size and forecast 2025-2030 ($ million)
Data Table on Middle East and Africa - Market size and forecast 2025-2030 ($ million)
Chart on Middle East and Africa - Year-over-year growth 2025-2030 (%)
Data Table on Middle East and Africa - Year-over-year growth 2025-2030 (%)
Chart on Regional Comparison - Middle East and Africa
Data Table on Regional Comparison - Middle East and Africa

12.6.1 Saudi Arabia - Market size and forecast 2025-2030

Chart on Saudi Arabia - Market size and forecast 2025-2030 ($ million)
Data Table on Saudi Arabia - Market size and forecast 2025-2030 ($ million)
Chart on Saudi Arabia - Year-over-year growth 2025-2030 (%)
Data Table on Saudi Arabia - Year-over-year growth 2025-2030 (%)

12.6.2 UAE - Market size and forecast 2025-2030

Chart on UAE - Market size and forecast 2025-2030 ($ million)
Data Table on UAE - Market size and forecast 2025-2030 ($ million)
Chart on UAE - Year-over-year growth 2025-2030 (%)
Data Table on UAE - Year-over-year growth 2025-2030 (%)

12.6.3 South Africa - Market size and forecast 2025-2030

Chart on South Africa - Market size and forecast 2025-2030 ($ million)
Data Table on South Africa - Market size and forecast 2025-2030 ($ million)
Chart on South Africa - Year-over-year growth 2025-2030 (%)
Data Table on South Africa - Year-over-year growth 2025-2030 (%)

12.6.4 Israel - Market size and forecast 2025-2030

Chart on Israel - Market size and forecast 2025-2030 ($ million)
Data Table on Israel - Market size and forecast 2025-2030 ($ million)
Chart on Israel - Year-over-year growth 2025-2030 (%)
Data Table on Israel - Year-over-year growth 2025-2030 (%)

12.6.5 Turkey - Market size and forecast 2025-2030

Chart on Turkey - Market size and forecast 2025-2030 ($ million)
Data Table on Turkey - Market size and forecast 2025-2030 ($ million)
Chart on Turkey - Year-over-year growth 2025-2030 (%)
Data Table on Turkey - Year-over-year growth 2025-2030 (%)

12.7 South America - Market size and forecast 2025-2030

Chart on South America - Market size and forecast 2025-2030 ($ million)
Data Table on South America - Market size and forecast 2025-2030 ($ million)
Chart on South America - Year-over-year growth 2025-2030 (%)
Data Table on South America - Year-over-year growth 2025-2030 (%)
Chart on Regional Comparison - South America
Data Table on Regional Comparison - South America

12.7.1 Brazil - Market size and forecast 2025-2030

Chart on Brazil - Market size and forecast 2025-2030 ($ million)
Data Table on Brazil - Market size and forecast 2025-2030 ($ million)
Chart on Brazil - Year-over-year growth 2025-2030 (%)
Data Table on Brazil - Year-over-year growth 2025-2030 (%)

12.7.2 Argentina - Market size and forecast 2025-2030

Chart on Argentina - Market size and forecast 2025-2030 ($ million)
Data Table on Argentina - Market size and forecast 2025-2030 ($ million)
Chart on Argentina - Year-over-year growth 2025-2030 (%)
Data Table on Argentina - Year-over-year growth 2025-2030 (%)

12.7.3 Chile - Market size and forecast 2025-2030

Chart on Chile - Market size and forecast 2025-2030 ($ million)
Data Table on Chile - Market size and forecast 2025-2030 ($ million)
Chart on Chile - Year-over-year growth 2025-2030 (%)
Data Table on Chile - Year-over-year growth 2025-2030 (%)

12.8 Market opportunity by geography

Market opportunity by geography ($ million)
Data Tables on Market opportunity by geography ($ million)

13. Drivers, Challenges, and Opportunity

13.1 Market drivers

Growing adoption of specialty fertilizers in high value crop cultivation
Increasing focus on precision nutrition for improving agricultural productivity
Expanding greenhouse and protected agriculture activities

13.2 Market challenges

Volatility in natural gas and energy input costs
Stringent environmental and hazardous chemical compliance requirements
Dependence on cyclical agricultural demand patterns

13.3 Impact of drivers and challenges

Impact of drivers and challenges in 2025 and 2030

13.4 Market opportunities

Increasing shift toward chloride-free fertilizer applications
Advancing development of water-soluble fertilizer formulations
Growing integration of digital agronomy platforms with nutrient management programs

14. Competitive Landscape

14.1 Overview

14.2

Overview on criticality of inputs and factors of differentiation

14.3 Landscape disruption

Overview on factors of disruption

14.4 Industry risks

Impact of key risks on business

15. Competitive Analysis

15.1 Companies profiled

Companies covered

15.2 Company ranking index

15.3 Market positioning of companies

Matrix on companies position and classification

15.4 American Elements Inc.

American Elements Inc. - Overview
American Elements Inc. - Product / Service
American Elements Inc. - Key offerings
SWOT

15.5 Arab Potash Co. Plc

Arab Potash Co. Plc - Overview
Arab Potash Co. Plc - Product / Service
Arab Potash Co. Plc - Key offerings
SWOT

15.6 EuroChem Group AG

EuroChem Group AG - Overview
EuroChem Group AG - Product / Service
EuroChem Group AG - Key offerings
SWOT

15.7 Haifa Negev technologies Ltd.

Haifa Negev technologies Ltd. - Overview
Haifa Negev technologies Ltd. - Product / Service
Haifa Negev technologies Ltd. - Key offerings
SWOT

15.8 Jost Chemical Co.

Jost Chemical Co. - Overview
Jost Chemical Co. - Product / Service
Jost Chemical Co. - Key offerings
SWOT

15.9 Kingenta Ecological Engineering

Kingenta Ecological Engineering - Overview
Kingenta Ecological Engineering - Business segments
Kingenta Ecological Engineering - Key offerings
Kingenta Ecological Engineering - Segment focus
SWOT

15.10 Kishida Chemical Co. Ltd.

Kishida Chemical Co. Ltd. - Overview
Kishida Chemical Co. Ltd. - Product / Service
Kishida Chemical Co. Ltd. - Key offerings
SWOT

15.11 Migao Corp

Migao Corp - Overview
Migao Corp - Product / Service
Migao Corp - Key offerings
SWOT

15.12 Nacalai Tesque Inc.

Nacalai Tesque Inc. - Overview
Nacalai Tesque Inc. - Product / Service
Nacalai Tesque Inc. - Key offerings
SWOT

15.13 Otsuka Chemical Co. Ltd.

Otsuka Chemical Co. Ltd. - Overview
Otsuka Chemical Co. Ltd. - Product / Service
Otsuka Chemical Co. Ltd. - Key offerings
SWOT

15.14 Sigma Aldrich Chemicals Ltd.

Sigma Aldrich Chemicals Ltd. - Overview
Sigma Aldrich Chemicals Ltd. - Product / Service
Sigma Aldrich Chemicals Ltd. - Key offerings
SWOT

15.15 Spectrum Chemical Mfg. Corp.

Spectrum Chemical Mfg. Corp. - Overview
Spectrum Chemical Mfg. Corp. - Product / Service
Spectrum Chemical Mfg. Corp. - Key offerings
SWOT

15.16 SQM S.A.

SQM S.A. - Overview
SQM S.A. - Business segments
SQM S.A. - Key offerings
SQM S.A. - Segment focus
SWOT

15.17 Uralchem JSC

Uralchem JSC - Overview
Uralchem JSC - Product / Service
Uralchem JSC - Key offerings
SWOT

15.18 Yara International ASA

Yara International ASA - Overview
Yara International ASA - Business segments
Yara International ASA - Key offerings
Yara International ASA - Segment focus
SWOT

16. Appendix

16.1 Scope of the report

Market definition
Objectives
Notes and caveats

16.2 Inclusions and exclusions checklist

Inclusions checklist
Exclusions checklist

16.3 Currency conversion rates for US$

16.4 Research methodology

16.5 Data procurement

Information sources

16.6 Data validation

16.7 Validation techniques employed for market sizing

16.8 Data synthesis

16.9 360 degree market analysis

16.10 List of abbreviations

Research Methodology

Technavio presents a detailed picture of the market by way of study, synthesis, and summation of data from multiple sources. The analysts have presented the various facets of the market with a particular focus on identifying the key industry influencers. The data thus presented is comprehensive, reliable, and the result of extensive research, both primary and secondary.

INFORMATION SOURCES

Primary sources

  • Manufacturers and suppliers
  • Channel partners
  • Industry experts
  • Strategic decision makers

Secondary sources

  • Industry journals and periodicals
  • Government data
  • Financial reports of key industry players
  • Historical data
  • Press releases

DATA ANALYSIS

Data Synthesis

  • Collation of data
  • Estimation of key figures
  • Analysis of derived insights

Data Validation

  • Triangulation with data models
  • Reference against proprietary databases
  • Corroboration with industry experts

REPORT WRITING

Qualitative

  • Market drivers
  • Market challenges
  • Market trends
  • Five forces analysis

Quantitative

  • Market size and forecast
  • Market segmentation
  • Geographical insights
  • Competitive landscape

Interested in this report?

Get your sample now to see our research methodology and insights!

Download Now

Frequently Asked Questions

Potassium Nitrate market growth will increase by USD 411.8 million during 2026-2030.

The Potassium Nitrate market is expected to grow at a CAGR of 3.3% during 2026-2030.

Potassium Nitrate market is segmented by End-user (Agriculture, General industries, Pharmaceutical, Food and beverages) Type (Potassium chloride, Sodium nitrate, Ammonium nitrate) Product type (Granular, Powder, Liquid)

AG Chemi Group s.r.o., American Elements Inc., Arab Potash Co. Plc, EuroChem Group AG, Gansu Engineering Scientific, Haifa Negev technologies Ltd., Jost Chemical Co., Junsei Chemical Co. Ltd., Kingenta Ecological Engineering, Kishida Chemical Co. Ltd., Migao Corp, Nacalai Tesque Inc., Otsuka Chemical Co. Ltd., Penta s.r.o, Shandong Lanhai Industry Co., Sichuan Hongfu New Materials Co., Sigma Aldrich Chemicals Ltd., Spectrum Chemical Mfg. Corp., SQM S.A., Uralchem JSC, Yara International ASA are a few of the key vendors in the Potassium Nitrate market.

APAC will register the highest growth rate of 49.6% among the other regions. Therefore, the Potassium Nitrate market in APAC is expected to garner significant business opportunities for the vendors during the forecast period.

China, India, Japan, South Korea, Australia, Indonesia, US, Canada, Mexico, Germany, Italy, UK, Spain, France, The Netherlands, Saudi Arabia, UAE, South Africa, Israel, Turkey, Brazil, Argentina, Chile

  • Growing adoption of specialty fertilizers in high value crop cultivation is the driving factor this market.

The Potassium Nitrate market vendors should focus on grabbing business opportunities from the End-user segment as it accounted for the largest market share in the base year.
RIA - Research AI Assistant
Ask RIA
