
Powersports Batteries Market Analysis, Size, and Forecast 2026-2030: APAC (China, India, and Japan), North America (US, Canada, and Mexico), Europe (Germany, UK, and France), South America (Brazil, Argentina, and Chile), Middle East and Africa (Saudi Arabia, UAE, and South Africa), and Rest of World (ROW)

Powersports Batteries Market Analysis, Size, and Forecast 2026-2030:
APAC (China, India, and Japan), North America (US, Canada, and Mexico), Europe (Germany, UK, and France), South America (Brazil, Argentina, and Chile), Middle East and Africa (Saudi Arabia, UAE, and South Africa), and Rest of World (ROW)

Published: Nov 2026 297 Pages SKU: IRTNTR76607

Market Overview at a Glance

$2.45 B
Market Opportunity
4.6%
CAGR 2025 - 2030
51%
APAC Growth
$4.38 B
Motorcycles segment 2024

Powersports Batteries Market Size 2026-2030

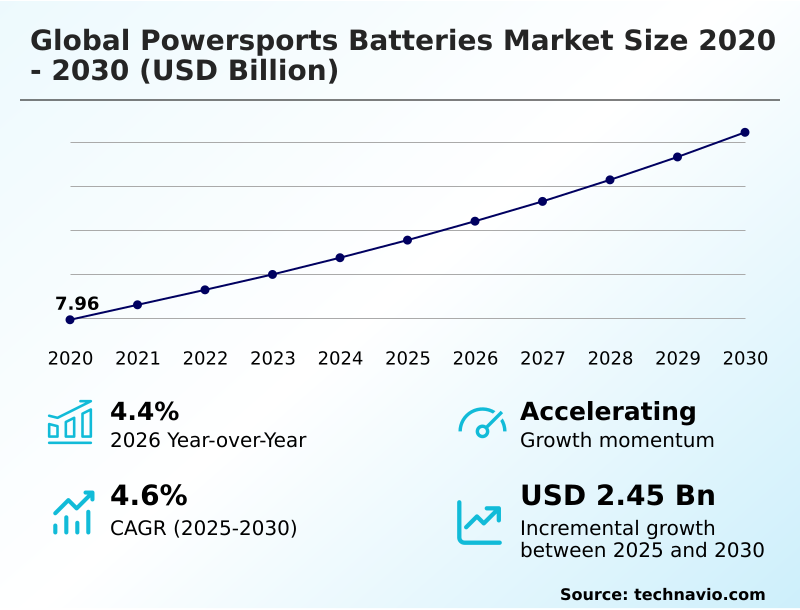
The powersports batteries market size is valued to increase by USD 2.45 billion, at a CAGR of 4.6% from 2025 to 2030. Commercial electrification of recreational vehicle fleets will drive the powersports batteries market.

Major Market Trends & Insights

  • APAC dominated the market and accounted for a 51% growth during the forecast period.
  • By Vehicle Type - Motorcycles segment was valued at USD 4.38 billion in 2024
  • By Channel - Aftermarket segment accounted for the largest market revenue share in 2024

Market Size & Forecast

  • Market Opportunities: USD 4.26 billion
  • Market Future Opportunities: USD 2.45 billion
  • CAGR from 2025 to 2030 : 4.6%

Market Summary

  • The Powersports Batteries Market demonstrates robust structural expansion driven by the rapid electrification of utility and recreational vehicles. Commercial fleet operators frequently overhaul maintenance strategies to integrate advanced storage units, thereby reducing vehicle downtime by 30% compared to legacy flooded counterparts. This transition directly optimizes supply chain throughput by minimizing seasonal replacement frequencies for rental operators.
  • The primary catalyst for this shift is the transition toward zero-emission powertrains, which mandates specialized high-voltage energy modules capable of delivering instantaneous current under extreme environmental exposure. Conversely, the market faces significant headwinds from counterfeit product proliferation, which introduces low-grade replicas into secondary retail channels.
  • This influx compromises overall electrical system integrity and forces established manufacturers to divert substantial operational capital toward brand protection and traceability initiatives. Consequently, original equipment producers are compelled to embed advanced microcontrollers into authorized units to ensure authenticity and performance consistency.
  • The continuous integration of sophisticated telematics and intelligent charging algorithms fundamentally elevates baseline power requirements, ensuring sustained demand for premium energy storage solutions.

What will be the Size of the Powersports Batteries Market during the forecast period?
Get Key Insights on Market Forecast (PDF) Get Free Sample

How is the Powersports Batteries Market Segmented?

The powersports batteries industry research report provides comprehensive data (region-wise segment analysis), with forecasts and estimates in "USD million" for the period 2026-2030, as well as historical data from 2020-2024 for the following segments.

  • Vehicle type
    • Motorcycles
    • ATVs and UTVs
    • Mopeds and scooters
    • Others
  • Channel
    • Aftermarket
    • OEM
  • Battery type
    • Nickel-metal hydride (NiMH)
    • Lithium-iron phosphate (LiFePO4)
  • Geography
    • APAC
      • China
      • India
      • Japan
      • South Korea
      • Australia
      • Indonesia
    • North America
      • US
      • Canada
      • Mexico
    • Europe
      • Germany
      • UK
      • France
      • Italy
      • Spain
      • The Netherlands
    • South America
      • Brazil
      • Argentina
      • Chile
    • Middle East and Africa
      • Saudi Arabia
      • UAE
      • South Africa
      • Turkey
      • Israel

By Vehicle Type Insights

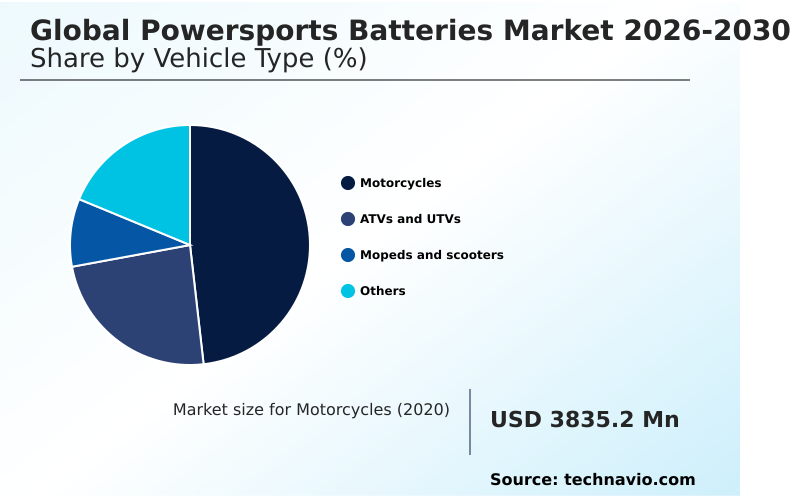
The motorcycles segment is estimated to witness significant growth during the forecast period.

Motorcycles demand reliable energy units to support complex electrical architectures amid rapid urban mobility expansion. The segment relies heavily on absorbent glass mat configurations to manage intense parasitic load handling stemming from advanced rider telematics and navigation systems.

Original equipment producers report a 15% increase in electrical efficiency when adopting these chemistries to support a zero emission powertrain. This transition is essential for optimizing handling dynamics in a lightweight racing format, minimizing physical mass.

Furthermore, the robust aftermarket replacement cycle generates persistent volume, driven by commuters seeking an integrated jump start functionality and superior extreme temperature tolerance.

Emerging solid state architecture promises to eliminate thermal risks entirely, fundamentally enhancing how two-wheeled platforms maintain power delivery across diverse riding environments.
Get Free Sample

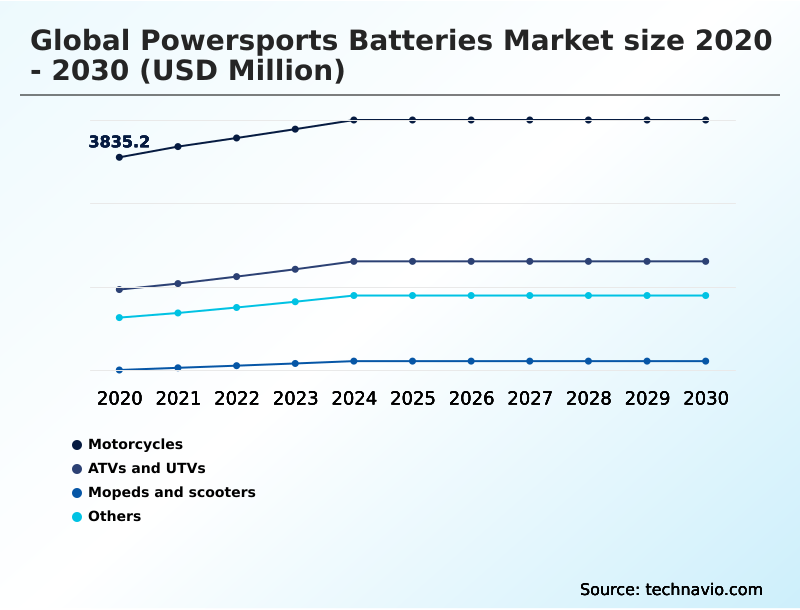
The Motorcycles segment was valued at USD 4.38 billion in 2024 and showed a gradual increase during the forecast period.
Get Free Sample

Regional Analysis

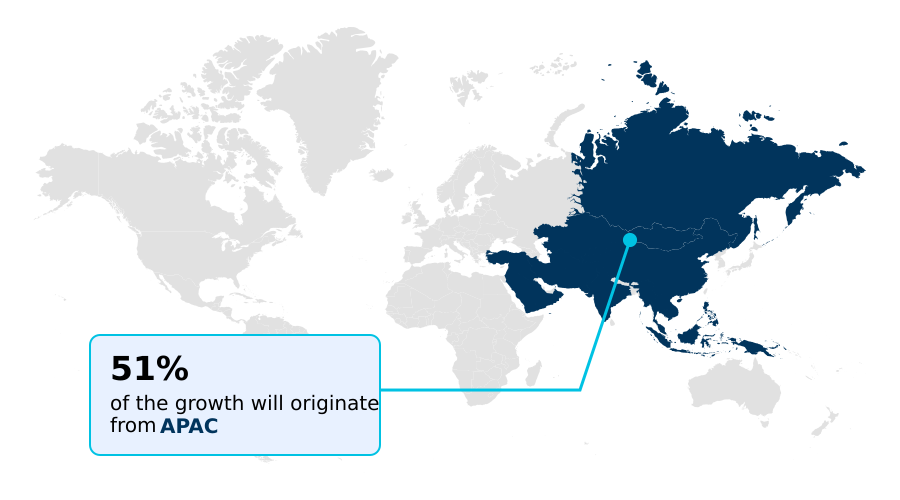
APAC is estimated to contribute 51% to the growth of the global market during the forecast period.Technavio’s analysts have elaborately explained the regional trends and drivers that shape the market during the forecast period.
See How Powersports Batteries Market Demand is Rising in APAC Get Free Sample

Geographic adoption rates highlight distinct operational priorities, with APAC commanding a 22% volume advantage over North America due to massive commuter integration.

APAC leverages localized supply chains to manufacture flooded lead acid and deep cycle chemistry units efficiently, achieving a 15% reduction in production costs.

Conversely, North America prioritizes premium off road vehicle electrification, demanding high energy density units engineered with exceptional cold weather resilience to support alpine utility fleets. This focus on rugged configurations yields a 30% higher average unit lifecycle in Western operations.

Furthermore, the persistent need for off grid storage utility in remote recreational corridors forces operators to favor leak proof design and a low self discharge rate.

These regional disparities compel manufacturers to incorporate a heavy duty terminal and superior grid corrosion resistance to accommodate diverse climatic stresses.

Market Dynamics

Our researchers analyzed the data with 2025 as the base year, along with the key drivers, trends, and challenges. A holistic analysis of drivers will help companies refine their marketing strategies to gain a competitive advantage.

  • Navigating the competitive landscape requires a profound understanding of the technological shifts reshaping the energy storage ecosystem. The deployment of absorbent glass mat Global Powersports Batteries Market 2026-2030 frameworks has historically stabilized electrical performance in high-vibration environments, offering substantial durability for off-road applications.
  • However, modern operational mandates now favor the integration of lithium iron phosphate Global Powersports Batteries Market 2026-2030 solutions, which deliver an 80% improvement in cycle life compared to traditional lead-acid equivalents. This substantial gain directly optimizes procurement strategies by reducing the frequency of inventory replenishment for large-scale rental outfits.
  • The ongoing commercial fleet transition Global Powersports Batteries Market 2026-2030 heavily depends on these advanced chemistries to minimize maintenance overhead and maximize vehicle availability. Furthermore, operators in northern latitudes prioritize cold weather resilience Global Powersports Batteries Market 2026-2030 to ensure continuous ignition reliability across freezing temperatures, heavily influencing regional stocking algorithms.
  • Looking forward, the eventual commercialization of solid state architecture Global Powersports Batteries Market 2026-2030 promises to eliminate thermal runaway vulnerabilities entirely while enabling ultra-fast replenishment protocols. These progressive material science developments empower distributors to consolidate their supply chains around premium, high-yield product lines that cater seamlessly to both demanding recreational enthusiasts and rigorous commercial utility applications.
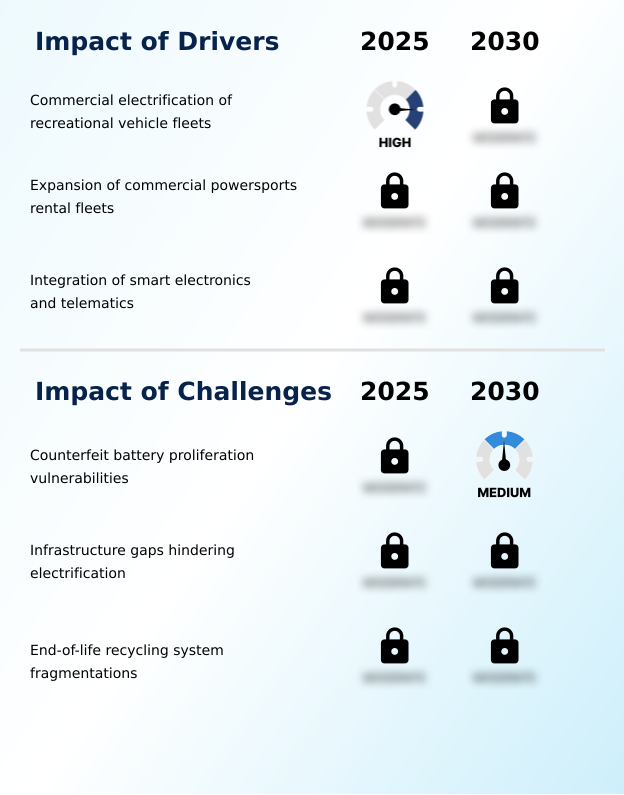
What are the key market drivers leading to the rise in the adoption of Powersports Batteries Industry?

  • The commercial electrification of recreational vehicle fleets functions as a primary catalyst accelerating market expansion.

  • The rapid commercial fleet transition toward electrified recreational platforms acts as a primary catalyst driving advanced power architecture adoption.
  • As modern vehicles incorporate sophisticated digital displays, the escalating auxiliary power demand overwhelms traditional starter units, prompting a 40% increase in the integration of lithium iron phosphate and valve regulated lead acid chemistries.
  • This shift is intrinsically linked to the demand for high voltage propulsion, requiring specialized modules equipped with thermal runaway protection and a vibration resistant casing to ensure operator safety during high-stress off-road operations.
  • Upgrading to these intelligent power units allows commercial outfits to achieve a 25% improvement in reliability, directly lowering preventative maintenance expenditures.
  • Concurrently, strict adherence to a tightening environmental compliance mandate forces manufacturers to deliver high cold cranking amps without relying on toxic legacy components.

What are the market trends shaping the Powersports Batteries Industry?

  • The proliferation of modular swappable battery ecosystems represents a defining market trend. This development significantly minimizes charging downtime and accelerates widespread commercial adoption.

  • The rapid proliferation of a modular swappable infrastructure represents a structural trend transforming vehicle utilization patterns. To capitalize on surging experiential tourism demand, fleet operators are deploying an automated kiosk station network that replaces lengthy plug-in sessions with an instant swappable power module exchange.
  • This logistical shift improves daily vehicle availability by 35% for the organized rental operator, completely eliminating range anxiety. Underpinning this efficiency is a sophisticated battery management system that utilizes active cell balancing to optimize thermal regulation, leading to a 20% improvement in battery lifecycle optimization compared to unmonitored charging protocols.
  • Furthermore, integrating a robust fast charging capability ensures a continuous supply of replenished modules. This decoupled energy strategy drastically reduces upfront vehicle acquisition costs while delivering an extended operational lifespan, allowing recreational enterprises to maximize asset turnover.

What challenges does the Powersports Batteries Industry face during its growth?

  • Counterfeit battery proliferation vulnerabilities present a significant structural challenge that disrupts supply chains and dampens industry growth.

  • Systemic operational bottlenecks continue to hinder the seamless adoption of advanced electrochemical energy storage across recreational sectors. The persistent infrastructure charging gap in remote wilderness corridors severely limits the operational radius of electric utility vehicles, causing a 30% drop in adoption rates among rural operators.
  • Additionally, the industry grapples with severe counterfeit product vulnerability, as unauthorized replicas lacking proper electrolyte evaporation control flood secondary markets. These substandard units pose significant safety risks and inflate warranty claim expenditures for legitimate manufacturers by up to 18%. Furthermore, the absence of a unified reverse logistics framework complicates end-of-life disposal for complex chemistries like nickel metal hydride.
  • This structural deficit results in a 25% shortfall in sustainable material recovery goals, heavily straining the capacity of any active hydrometallurgical recycling facility and impeding closed loop recycling initiatives.

Exclusive Technavio Analysis on Customer Landscape

The powersports batteries market forecasting report includes the adoption lifecycle of the market, covering from the innovator’s stage to the laggard’s stage. It focuses on adoption rates in different regions based on penetration. Furthermore, the powersports batteries market report also includes key purchase criteria and drivers of price sensitivity to help companies evaluate and develop their market growth analysis strategies.
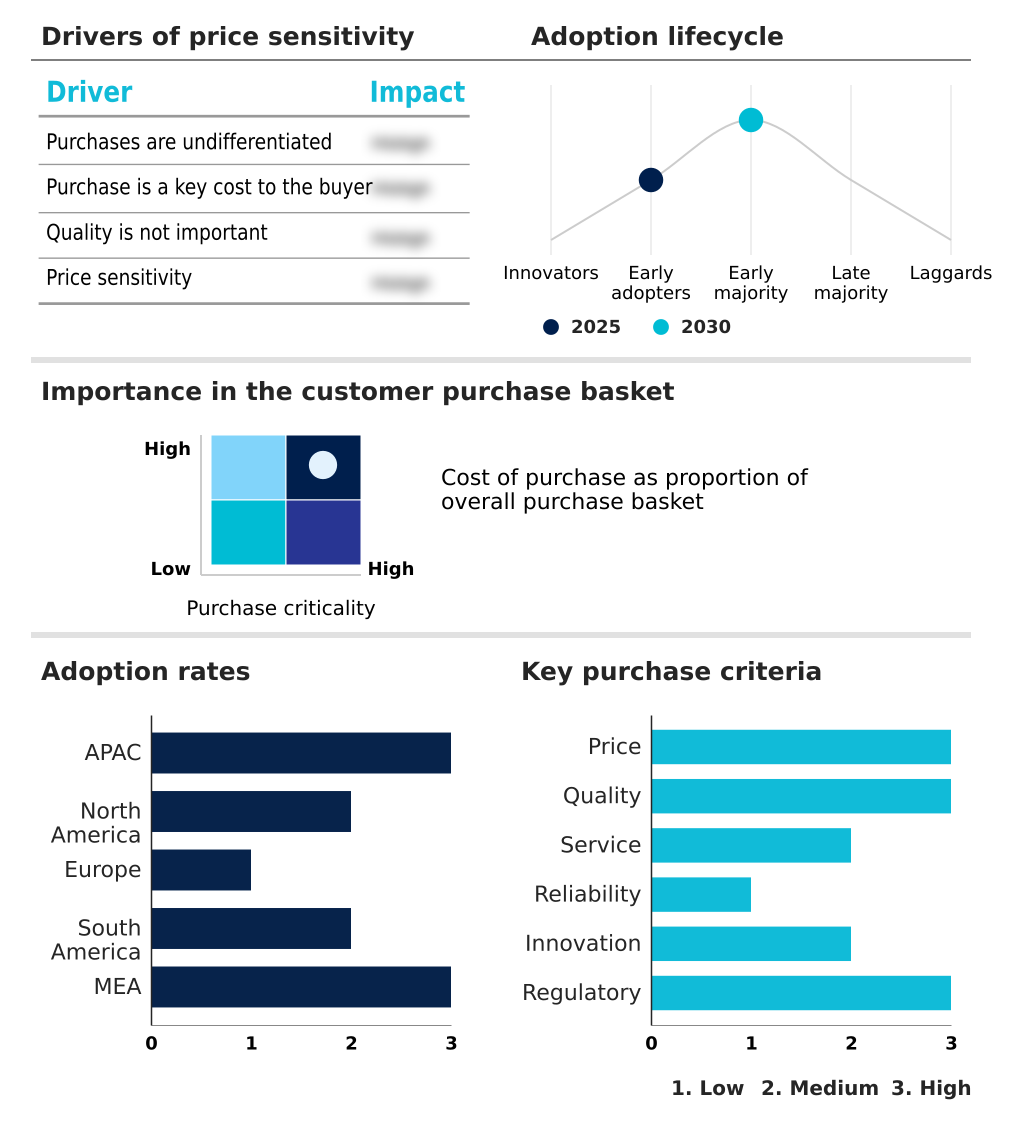
Customer Landscape of Powersports Batteries Industry

Competitive Landscape

Companies are implementing various strategies, such as strategic alliances, powersports batteries market forecast, partnerships, mergers and acquisitions, geographical expansion, and product/service launches, to enhance their presence in the industry.

Amara Raja Group - Delivers high-performance energy storage solutions designed for extreme off-road durability, ensuring reliable cold-cranking capabilities and extended lifecycle management for diverse recreational vehicle applications.

The industry research and growth report includes detailed analyses of the competitive landscape of the market and information about key companies, including:

  • Amara Raja Group
  • Atlas Battery Ltd.
  • Banner GmbH
  • BS Battery
  • Camel Group Co. Ltd.
  • CLARIOS LLC
  • Crown Battery Manufacturing Co.
  • Discover Battery
  • East Penn Manufacture Co. Inc.
  • EnerSys Inc.
  • Exide Technologies
  • Fullriver Battery
  • GS Yuasa International Ltd.
  • Leoch International Technology
  • MIDAC SpA
  • Panasonic Holdings Corp.
  • Power Sonic Corp.
  • Samsung SDI Co. Ltd.
  • Skyrich Powersport Batteries
  • Super B Lithium Power B.V.
  • Tianneng Group

Qualitative and quantitative analysis of companies has been conducted to help clients understand the wider business environment as well as the strengths and weaknesses of key industry players. Data is qualitatively analyzed to categorize companies as pure play, category-focused, industry-focused, and diversified; it is quantitatively analyzed to categorize companies as dominant, leading, strong, tentative, and weak.

Recent Development and News in Powersports batteries market

  • In the Renewable Electricity industry, the rapid expansion of solar photovoltaic microgrids has enhanced off grid storage utility, directly impacting Powersports Batteries demand by enabling remote charging infrastructure for recreational vehicle electrification and reducing grid dependency by 35% in rural areas.
  • The implementation of strict environmental compliance mandate frameworks for raw material extraction has accelerated the adoption of closed loop recycling and hydrometallurgical recycling facility operations, improving sustainable material recovery rates for essential battery metals by up to 40% and stabilizing supply chains for high energy density manufacturing.
  • Advancements in active cell balancing and thermal runaway protection within large-scale utility storage have trickled down to compact electrochemical energy storage applications, increasing the operational safety and extending the extended operational lifespan of high voltage propulsion units by over 20%.
  • The integration of smart grid diagnostics has spurred developments in advanced battery management system technology, improving battery lifecycle optimization protocols and enabling a 25% faster fast charging capability that translates directly into reduced downtime for commercial fleet transition initiatives.

Dive into Technavio’s robust research methodology, blending expert interviews, extensive data synthesis, and validated models for unparalleled Powersports Batteries Market insights. See full methodology.

Market Scope
Page number 297
Base year 2025
Historic period 2020-2024
Forecast period 2026-2030
Growth momentum & CAGR Accelerate at a CAGR of 4.6%
Market growth 2026-2030 USD 2449.8 million
Market structure Fragmented
YoY growth 2025-2026(%) 4.4%
Key countries China, India, Japan, South Korea, Australia, Indonesia, US, Canada, Mexico, Germany, UK, France, Italy, Spain, The Netherlands, Brazil, Argentina, Chile, Saudi Arabia, UAE, South Africa, Turkey and Israel
Competitive landscape Leading Companies, Market Positioning of Companies, Competitive Strategies, and Industry Risks

Request Free Sample

Research Analyst Overview

  • Technological progression within the energy storage sector fundamentally alters how manufacturers approach product strategy and environmental compliance. The ongoing displacement of conventional flooded units by advanced sealed configurations enables compliance with stringent non-spillable transport regulations, lowering logistical insurance premiums by up to 15%.
  • This shift forces procurement teams to realign budgeting models toward premium architectures that feature superior leak resistance and extended operational lifespans. Commercial operators demand power sources capable of delivering immense cranking power to guarantee reliable ignition for utility task vehicles in sub-zero environments.
  • To withstand continuous mechanical shock, developers engineer specialized enclosures equipped with reinforced heavy-duty terminals, ensuring structural integrity during aggressive off-road deployment. Furthermore, the integration of integrated jump-start functionality enhances user autonomy in remote locations, significantly reducing emergency retrieval expenditures for wilderness tour operators.
  • By adopting these resilient electrochemical solutions, enterprise fleet managers achieve superior asset readiness and vastly lower total ownership costs, cementing the necessity for continuous material innovation across high-demand recreational and utility platforms.

What are the Key Data Covered in this Powersports Batteries Market Research and Growth Report?

  • What is the expected growth of the Powersports Batteries Market between 2026 and 2030?

    • USD 2.45 billion, at a CAGR of 4.6%

  • What segmentation does the market report cover?

    • The report is segmented by Vehicle Type (Motorcycles, ATVs and UTVs, Mopeds and scooters, and Others), Channel (Aftermarket, and OEM), Battery Type (Nickel-metal hydride (NiMH), and Lithium-iron phosphate (LiFePO4)) and Geography (APAC, North America, Europe, South America, Middle East and Africa)

  • Which regions are analyzed in the report?

    • APAC, North America, Europe, South America and Middle East and Africa

  • What are the key growth drivers and market challenges?

    • Commercial electrification of recreational vehicle fleets, Counterfeit battery proliferation vulnerabilities

  • Who are the major players in the Powersports Batteries Market?

    • Amara Raja Group, Atlas Battery Ltd., Banner GmbH, BS Battery, Camel Group Co. Ltd., CLARIOS LLC, Crown Battery Manufacturing Co., Discover Battery, East Penn Manufacture Co. Inc., EnerSys Inc., Exide Technologies, Fullriver Battery, GS Yuasa International Ltd., Leoch International Technology, MIDAC SpA, Panasonic Holdings Corp., Power Sonic Corp., Samsung SDI Co. Ltd., Skyrich Powersport Batteries, Super B Lithium Power B.V. and Tianneng Group

Market Research Insights

  • The Powersports Batteries landscape is evolving rapidly to support high-performance applications and expanding urban mobility requirements. Fleet managers transitioning to modular power frameworks report a 40% reduction in vehicle idle times, vastly improving asset utilization for organized rental outfits.
  • Furthermore, the integration of advanced chemistries tailored for lightweight recreational formats has improved overall power-to-weight ratios by 25%, enabling superior handling dynamics. These advanced units also exhibit enhanced extreme temperature tolerance, decreasing winter capacity loss by 18% compared to conventional architectures.
  • This performance reliability ensures consistent engine ignition across diverse climatic conditions, solidifying the operational resilience required by modern utility and recreational platforms.

We can help! Our analysts can customize this powersports batteries market research report to meet your requirements.

Get in touch

1. Executive Summary

1.1 Market overview

Executive Summary - Chart on Market Overview
Executive Summary - Data Table on Market Overview
Executive Summary - Chart on Global Market Characteristics
Executive Summary - Chart on Market by Geography
Executive Summary - Chart on Market Segmentation by Vehicle Type
Executive Summary - Chart on Market Segmentation by Channel
Executive Summary - Chart on Market Segmentation by Battery Type
Executive Summary - Chart on Incremental Growth
Executive Summary - Data Table on Incremental Growth
Executive Summary - Chart on Company Market Positioning

2. Technavio Analysis

2.1 Analysis of price sensitivity, lifecycle, customer purchase basket, adoption rates, and purchase criteria

2.2 Criticality of inputs and Factors of differentiation

Chart on Overview on criticality of inputs and factors of differentiation

2.3 Factors of disruption

Chart on Overview on factors of disruption

2.4 Impact of drivers and challenges

Chart on Impact of drivers and challenges in 2025 and 2030

3. Market Landscape

3.1 Market ecosystem

Chart on Parent Market
Data Table on - Parent Market

3.2 Market characteristics

Chart on Market characteristics analysis

3.3 Value chain analysis

Chart on Value chain analysis

4. Market Sizing

4.1 Market definition

Data Table on Offerings of companies included in the market definition

4.2 Market segment analysis

Market segments

4.3 Market size 2025

4.4 Market outlook: Forecast for 2025-2030

Chart on Global - Market size and forecast 2025-2030 ($ million)
Data Table on Global - Market size and forecast 2025-2030 ($ million)
Chart on Global Market: Year-over-year growth 2025-2030 (%)
Data Table on Global Market: Year-over-year growth 2025-2030 (%)

5. Historic Market Size

5.1 Global Powersports Batteries Market 2020 - 2024

Historic Market Size - Data Table on Global Powersports Batteries Market 2020 - 2024 ($ million)

5.2 Vehicle Type segment analysis 2020 - 2024

Historic Market Size - Vehicle Type Segment 2020 - 2024 ($ million)

5.3 Channel segment analysis 2020 - 2024

Historic Market Size - Channel Segment 2020 - 2024 ($ million)

5.4 Battery Type segment analysis 2020 - 2024

Historic Market Size - Battery Type Segment 2020 - 2024 ($ million)

5.5 Geography segment analysis 2020 - 2024

Historic Market Size - Geography Segment 2020 - 2024 ($ million)

5.6 Country segment analysis 2020 - 2024

Historic Market Size - Country Segment 2020 - 2024 ($ million)

6. Qualitative Analysis

6.1 Impact of AI on Global Powersports Batteries Market

6.2 Impact of geopolitical conflicts on Global Powersports Batteries Market

7. Five Forces Analysis

7.1 Five forces summary

Five forces analysis - Comparison between 2025 and 2030

7.2 Bargaining power of buyers

Bargaining power of buyers - Impact of key factors 2025 and 2030

7.3 Bargaining power of suppliers

Bargaining power of suppliers - Impact of key factors in 2025 and 2030

7.4 Threat of new entrants

Threat of new entrants - Impact of key factors in 2025 and 2030

7.5 Threat of substitutes

Threat of substitutes - Impact of key factors in 2025 and 2030

7.6 Threat of rivalry

Threat of rivalry - Impact of key factors in 2025 and 2030

7.7 Market condition

Chart on Market condition - Five forces 2025 and 2030

8. Market Segmentation by Vehicle Type

8.1 Market segments

Chart on Vehicle Type - Market share 2025-2030 (%)
Data Table on Vehicle Type - Market share 2025-2030 (%)

8.2 Comparison by Vehicle Type

Chart on Comparison by Vehicle Type
Data Table on Comparison by Vehicle Type

8.3 Motorcycles - Market size and forecast 2025-2030

Chart on Motorcycles - Market size and forecast 2025-2030 ($ million)
Data Table on Motorcycles - Market size and forecast 2025-2030 ($ million)
Chart on Motorcycles - Year-over-year growth 2025-2030 (%)
Data Table on Motorcycles - Year-over-year growth 2025-2030 (%)

8.4 ATVs and UTVs - Market size and forecast 2025-2030

Chart on ATVs and UTVs - Market size and forecast 2025-2030 ($ million)
Data Table on ATVs and UTVs - Market size and forecast 2025-2030 ($ million)
Chart on ATVs and UTVs - Year-over-year growth 2025-2030 (%)
Data Table on ATVs and UTVs - Year-over-year growth 2025-2030 (%)

8.5 Mopeds and scooters - Market size and forecast 2025-2030

Chart on Mopeds and scooters - Market size and forecast 2025-2030 ($ million)
Data Table on Mopeds and scooters - Market size and forecast 2025-2030 ($ million)
Chart on Mopeds and scooters - Year-over-year growth 2025-2030 (%)
Data Table on Mopeds and scooters - Year-over-year growth 2025-2030 (%)

8.6 Others - Market size and forecast 2025-2030

Chart on Others - Market size and forecast 2025-2030 ($ million)
Data Table on Others - Market size and forecast 2025-2030 ($ million)
Chart on Others - Year-over-year growth 2025-2030 (%)
Data Table on Others - Year-over-year growth 2025-2030 (%)

8.7 Market opportunity by Vehicle Type

Market opportunity by Vehicle Type ($ million)
Data Table on Market opportunity by Vehicle Type ($ million)

9. Market Segmentation by Channel

9.1 Market segments

Chart on Channel - Market share 2025-2030 (%)
Data Table on Channel - Market share 2025-2030 (%)

9.2 Comparison by Channel

Chart on Comparison by Channel
Data Table on Comparison by Channel

9.3 Aftermarket - Market size and forecast 2025-2030

Chart on Aftermarket - Market size and forecast 2025-2030 ($ million)
Data Table on Aftermarket - Market size and forecast 2025-2030 ($ million)
Chart on Aftermarket - Year-over-year growth 2025-2030 (%)
Data Table on Aftermarket - Year-over-year growth 2025-2030 (%)

9.4 OEM - Market size and forecast 2025-2030

Chart on OEM - Market size and forecast 2025-2030 ($ million)
Data Table on OEM - Market size and forecast 2025-2030 ($ million)
Chart on OEM - Year-over-year growth 2025-2030 (%)
Data Table on OEM - Year-over-year growth 2025-2030 (%)

9.5 Market opportunity by Channel

Market opportunity by Channel ($ million)
Data Table on Market opportunity by Channel ($ million)

10. Market Segmentation by Battery Type

10.1 Market segments

Chart on Battery Type - Market share 2025-2030 (%)
Data Table on Battery Type - Market share 2025-2030 (%)

10.2 Comparison by Battery Type

Chart on Comparison by Battery Type
Data Table on Comparison by Battery Type

10.3 Nickel-metal hydride (NiMH) - Market size and forecast 2025-2030

Chart on Nickel-metal hydride (NiMH) - Market size and forecast 2025-2030 ($ million)
Data Table on Nickel-metal hydride (NiMH) - Market size and forecast 2025-2030 ($ million)
Chart on Nickel-metal hydride (NiMH) - Year-over-year growth 2025-2030 (%)
Data Table on Nickel-metal hydride (NiMH) - Year-over-year growth 2025-2030 (%)

10.4 Lithium-iron phosphate (LiFePO4) - Market size and forecast 2025-2030

Chart on Lithium-iron phosphate (LiFePO4) - Market size and forecast 2025-2030 ($ million)
Data Table on Lithium-iron phosphate (LiFePO4) - Market size and forecast 2025-2030 ($ million)
Chart on Lithium-iron phosphate (LiFePO4) - Year-over-year growth 2025-2030 (%)
Data Table on Lithium-iron phosphate (LiFePO4) - Year-over-year growth 2025-2030 (%)

10.5 Market opportunity by Battery Type

Market opportunity by Battery Type ($ million)
Data Table on Market opportunity by Battery Type ($ million)

11. Customer Landscape

11.1 Customer landscape overview

Analysis of price sensitivity, lifecycle, customer purchase basket, adoption rates, and purchase criteria

12. Geographic Landscape

12.1 Geographic segmentation

Chart on Market share by geography 2025-2030 (%)
Data Table on Market share by geography 2025-2030 (%)

12.2 Geographic comparison

Chart on Geographic comparison
Data Table on Geographic comparison

12.3 APAC - Market size and forecast 2025-2030

Chart on APAC - Market size and forecast 2025-2030 ($ million)
Data Table on APAC - Market size and forecast 2025-2030 ($ million)
Chart on APAC - Year-over-year growth 2025-2030 (%)
Data Table on APAC - Year-over-year growth 2025-2030 (%)
Chart on Regional Comparison - APAC
Data Table on Regional Comparison - APAC

12.3.1 China - Market size and forecast 2025-2030

Chart on China - Market size and forecast 2025-2030 ($ million)
Data Table on China - Market size and forecast 2025-2030 ($ million)
Chart on China - Year-over-year growth 2025-2030 (%)
Data Table on China - Year-over-year growth 2025-2030 (%)

12.3.2 India - Market size and forecast 2025-2030

Chart on India - Market size and forecast 2025-2030 ($ million)
Data Table on India - Market size and forecast 2025-2030 ($ million)
Chart on India - Year-over-year growth 2025-2030 (%)
Data Table on India - Year-over-year growth 2025-2030 (%)

12.3.3 Japan - Market size and forecast 2025-2030

Chart on Japan - Market size and forecast 2025-2030 ($ million)
Data Table on Japan - Market size and forecast 2025-2030 ($ million)
Chart on Japan - Year-over-year growth 2025-2030 (%)
Data Table on Japan - Year-over-year growth 2025-2030 (%)

12.3.4 South Korea - Market size and forecast 2025-2030

Chart on South Korea - Market size and forecast 2025-2030 ($ million)
Data Table on South Korea - Market size and forecast 2025-2030 ($ million)
Chart on South Korea - Year-over-year growth 2025-2030 (%)
Data Table on South Korea - Year-over-year growth 2025-2030 (%)

12.3.5 Australia - Market size and forecast 2025-2030

Chart on Australia - Market size and forecast 2025-2030 ($ million)
Data Table on Australia - Market size and forecast 2025-2030 ($ million)
Chart on Australia - Year-over-year growth 2025-2030 (%)
Data Table on Australia - Year-over-year growth 2025-2030 (%)

12.3.6 Indonesia - Market size and forecast 2025-2030

Chart on Indonesia - Market size and forecast 2025-2030 ($ million)
Data Table on Indonesia - Market size and forecast 2025-2030 ($ million)
Chart on Indonesia - Year-over-year growth 2025-2030 (%)
Data Table on Indonesia - Year-over-year growth 2025-2030 (%)

12.4 North America - Market size and forecast 2025-2030

Chart on North America - Market size and forecast 2025-2030 ($ million)
Data Table on North America - Market size and forecast 2025-2030 ($ million)
Chart on North America - Year-over-year growth 2025-2030 (%)
Data Table on North America - Year-over-year growth 2025-2030 (%)
Chart on Regional Comparison - North America
Data Table on Regional Comparison - North America

12.4.1 US - Market size and forecast 2025-2030

Chart on US - Market size and forecast 2025-2030 ($ million)
Data Table on US - Market size and forecast 2025-2030 ($ million)
Chart on US - Year-over-year growth 2025-2030 (%)
Data Table on US - Year-over-year growth 2025-2030 (%)

12.4.2 Canada - Market size and forecast 2025-2030

Chart on Canada - Market size and forecast 2025-2030 ($ million)
Data Table on Canada - Market size and forecast 2025-2030 ($ million)
Chart on Canada - Year-over-year growth 2025-2030 (%)
Data Table on Canada - Year-over-year growth 2025-2030 (%)

12.4.3 Mexico - Market size and forecast 2025-2030

Chart on Mexico - Market size and forecast 2025-2030 ($ million)
Data Table on Mexico - Market size and forecast 2025-2030 ($ million)
Chart on Mexico - Year-over-year growth 2025-2030 (%)
Data Table on Mexico - Year-over-year growth 2025-2030 (%)

12.5 Europe - Market size and forecast 2025-2030

Chart on Europe - Market size and forecast 2025-2030 ($ million)
Data Table on Europe - Market size and forecast 2025-2030 ($ million)
Chart on Europe - Year-over-year growth 2025-2030 (%)
Data Table on Europe - Year-over-year growth 2025-2030 (%)
Chart on Regional Comparison - Europe
Data Table on Regional Comparison - Europe

12.5.1 Germany - Market size and forecast 2025-2030

Chart on Germany - Market size and forecast 2025-2030 ($ million)
Data Table on Germany - Market size and forecast 2025-2030 ($ million)
Chart on Germany - Year-over-year growth 2025-2030 (%)
Data Table on Germany - Year-over-year growth 2025-2030 (%)

12.5.2 UK - Market size and forecast 2025-2030

Chart on UK - Market size and forecast 2025-2030 ($ million)
Data Table on UK - Market size and forecast 2025-2030 ($ million)
Chart on UK - Year-over-year growth 2025-2030 (%)
Data Table on UK - Year-over-year growth 2025-2030 (%)

12.5.3 France - Market size and forecast 2025-2030

Chart on France - Market size and forecast 2025-2030 ($ million)
Data Table on France - Market size and forecast 2025-2030 ($ million)
Chart on France - Year-over-year growth 2025-2030 (%)
Data Table on France - Year-over-year growth 2025-2030 (%)

12.5.4 Italy - Market size and forecast 2025-2030

Chart on Italy - Market size and forecast 2025-2030 ($ million)
Data Table on Italy - Market size and forecast 2025-2030 ($ million)
Chart on Italy - Year-over-year growth 2025-2030 (%)
Data Table on Italy - Year-over-year growth 2025-2030 (%)

12.5.5 Spain - Market size and forecast 2025-2030

Chart on Spain - Market size and forecast 2025-2030 ($ million)
Data Table on Spain - Market size and forecast 2025-2030 ($ million)
Chart on Spain - Year-over-year growth 2025-2030 (%)
Data Table on Spain - Year-over-year growth 2025-2030 (%)

12.5.6 The Netherlands - Market size and forecast 2025-2030

Chart on The Netherlands - Market size and forecast 2025-2030 ($ million)
Data Table on The Netherlands - Market size and forecast 2025-2030 ($ million)
Chart on The Netherlands - Year-over-year growth 2025-2030 (%)
Data Table on The Netherlands - Year-over-year growth 2025-2030 (%)

12.6 South America - Market size and forecast 2025-2030

Chart on South America - Market size and forecast 2025-2030 ($ million)
Data Table on South America - Market size and forecast 2025-2030 ($ million)
Chart on South America - Year-over-year growth 2025-2030 (%)
Data Table on South America - Year-over-year growth 2025-2030 (%)
Chart on Regional Comparison - South America
Data Table on Regional Comparison - South America

12.6.1 Brazil - Market size and forecast 2025-2030

Chart on Brazil - Market size and forecast 2025-2030 ($ million)
Data Table on Brazil - Market size and forecast 2025-2030 ($ million)
Chart on Brazil - Year-over-year growth 2025-2030 (%)
Data Table on Brazil - Year-over-year growth 2025-2030 (%)

12.6.2 Argentina - Market size and forecast 2025-2030

Chart on Argentina - Market size and forecast 2025-2030 ($ million)
Data Table on Argentina - Market size and forecast 2025-2030 ($ million)
Chart on Argentina - Year-over-year growth 2025-2030 (%)
Data Table on Argentina - Year-over-year growth 2025-2030 (%)

12.6.3 Chile - Market size and forecast 2025-2030

Chart on Chile - Market size and forecast 2025-2030 ($ million)
Data Table on Chile - Market size and forecast 2025-2030 ($ million)
Chart on Chile - Year-over-year growth 2025-2030 (%)
Data Table on Chile - Year-over-year growth 2025-2030 (%)

12.7 Middle East and Africa - Market size and forecast 2025-2030

Chart on Middle East and Africa - Market size and forecast 2025-2030 ($ million)
Data Table on Middle East and Africa - Market size and forecast 2025-2030 ($ million)
Chart on Middle East and Africa - Year-over-year growth 2025-2030 (%)
Data Table on Middle East and Africa - Year-over-year growth 2025-2030 (%)
Chart on Regional Comparison - Middle East and Africa
Data Table on Regional Comparison - Middle East and Africa

12.7.1 Saudi Arabia - Market size and forecast 2025-2030

Chart on Saudi Arabia - Market size and forecast 2025-2030 ($ million)
Data Table on Saudi Arabia - Market size and forecast 2025-2030 ($ million)
Chart on Saudi Arabia - Year-over-year growth 2025-2030 (%)
Data Table on Saudi Arabia - Year-over-year growth 2025-2030 (%)

12.7.2 UAE - Market size and forecast 2025-2030

Chart on UAE - Market size and forecast 2025-2030 ($ million)
Data Table on UAE - Market size and forecast 2025-2030 ($ million)
Chart on UAE - Year-over-year growth 2025-2030 (%)
Data Table on UAE - Year-over-year growth 2025-2030 (%)

12.7.3 South Africa - Market size and forecast 2025-2030

Chart on South Africa - Market size and forecast 2025-2030 ($ million)
Data Table on South Africa - Market size and forecast 2025-2030 ($ million)
Chart on South Africa - Year-over-year growth 2025-2030 (%)
Data Table on South Africa - Year-over-year growth 2025-2030 (%)

12.7.4 Turkey - Market size and forecast 2025-2030

Chart on Turkey - Market size and forecast 2025-2030 ($ million)
Data Table on Turkey - Market size and forecast 2025-2030 ($ million)
Chart on Turkey - Year-over-year growth 2025-2030 (%)
Data Table on Turkey - Year-over-year growth 2025-2030 (%)

12.7.5 Israel - Market size and forecast 2025-2030

Chart on Israel - Market size and forecast 2025-2030 ($ million)
Data Table on Israel - Market size and forecast 2025-2030 ($ million)
Chart on Israel - Year-over-year growth 2025-2030 (%)
Data Table on Israel - Year-over-year growth 2025-2030 (%)

12.8 Market opportunity by geography

Market opportunity by geography ($ million)
Data Tables on Market opportunity by geography ($ million)

13. Drivers, Challenges, and Opportunity

13.1 Market drivers

Commercial electrification of recreational vehicle fleets
Expansion of commercial powersports rental fleets
Integration of smart electronics and telematics

13.2 Market challenges

Counterfeit battery proliferation vulnerabilities
Infrastructure gaps hindering electrification
End-of-life recycling system fragmentations

13.3 Impact of drivers and challenges

Impact of drivers and challenges in 2025 and 2030

13.4 Market opportunities

Proliferation of modular swappable battery ecosystems
Adoption of lightweight liFepo4 racing formats
Expansion of sustainable battery recycling infrastructure

14. Competitive Landscape

14.1 Overview

14.2

Overview on criticality of inputs and factors of differentiation

14.3 Landscape disruption

Overview on factors of disruption

14.4 Industry risks

Impact of key risks on business

15. Competitive Analysis

15.1 Companies profiled

Companies covered

15.2 Company ranking index

15.3 Market positioning of companies

Matrix on companies position and classification

15.4 Amara Raja Group

Amara Raja Group - Overview
Amara Raja Group - Product / Service
Amara Raja Group - Key offerings
SWOT

15.5 Atlas Battery Ltd.

Atlas Battery Ltd. - Overview
Atlas Battery Ltd. - Product / Service
Atlas Battery Ltd. - Key offerings
SWOT

15.6 Banner GmbH

Banner GmbH - Overview
Banner GmbH - Product / Service
Banner GmbH - Key offerings
SWOT

15.7 BS Battery

BS Battery - Overview
BS Battery - Product / Service
BS Battery - Key offerings
SWOT

15.8 Camel Group Co. Ltd.

Camel Group Co. Ltd. - Overview
Camel Group Co. Ltd. - Product / Service
Camel Group Co. Ltd. - Key offerings
SWOT

15.9 CLARIOS LLC

CLARIOS LLC - Overview
CLARIOS LLC - Product / Service
CLARIOS LLC - Key offerings
SWOT

15.10 Crown Battery Manufacturing Co.

Crown Battery Manufacturing Co. - Overview
Crown Battery Manufacturing Co. - Product / Service
Crown Battery Manufacturing Co. - Key offerings
SWOT

15.11 East Penn Manufacture Co. Inc.

East Penn Manufacture Co. Inc. - Overview
East Penn Manufacture Co. Inc. - Product / Service
East Penn Manufacture Co. Inc. - Key offerings
SWOT

15.12 EnerSys Inc.

EnerSys Inc. - Overview
EnerSys Inc. - Business segments
EnerSys Inc. - Key news
EnerSys Inc. - Key offerings
EnerSys Inc. - Segment focus
SWOT

15.13 Exide Technologies

Exide Technologies - Overview
Exide Technologies - Product / Service
Exide Technologies - Key offerings
SWOT

15.14 GS Yuasa International Ltd.

GS Yuasa International Ltd. - Overview
GS Yuasa International Ltd. - Product / Service
GS Yuasa International Ltd. - Key offerings
SWOT

15.15 Leoch International Technology

Leoch International Technology - Overview
Leoch International Technology - Product / Service
Leoch International Technology - Key offerings
SWOT

15.16 Panasonic Holdings Corp.

Panasonic Holdings Corp. - Overview
Panasonic Holdings Corp. - Business segments
Panasonic Holdings Corp. - Key news
Panasonic Holdings Corp. - Key offerings
Panasonic Holdings Corp. - Segment focus
SWOT

15.17 Samsung SDI Co. Ltd.

Samsung SDI Co. Ltd. - Overview
Samsung SDI Co. Ltd. - Business segments
Samsung SDI Co. Ltd. - Key offerings
Samsung SDI Co. Ltd. - Segment focus
SWOT

15.18 Tianneng Group

Tianneng Group - Overview
Tianneng Group - Business segments
Tianneng Group - Key offerings
Tianneng Group - Segment focus
SWOT

16. Appendix

16.1 Scope of the report

Market definition
Objectives
Notes and caveats

16.2 Inclusions and exclusions checklist

Inclusions checklist
Exclusions checklist

16.3 Currency conversion rates for US$

16.4 Research methodology

16.5 Data procurement

Information sources

16.6 Data validation

16.7 Validation techniques employed for market sizing

16.8 Data synthesis

16.9 360 degree market analysis

16.10 List of abbreviations

Research Methodology

Technavio presents a detailed picture of the market by way of study, synthesis, and summation of data from multiple sources. The analysts have presented the various facets of the market with a particular focus on identifying the key industry influencers. The data thus presented is comprehensive, reliable, and the result of extensive research, both primary and secondary.

INFORMATION SOURCES

Primary sources

  • Manufacturers and suppliers
  • Channel partners
  • Industry experts
  • Strategic decision makers

Secondary sources

  • Industry journals and periodicals
  • Government data
  • Financial reports of key industry players
  • Historical data
  • Press releases

DATA ANALYSIS

Data Synthesis

  • Collation of data
  • Estimation of key figures
  • Analysis of derived insights

Data Validation

  • Triangulation with data models
  • Reference against proprietary databases
  • Corroboration with industry experts

REPORT WRITING

Qualitative

  • Market drivers
  • Market challenges
  • Market trends
  • Five forces analysis

Quantitative

  • Market size and forecast
  • Market segmentation
  • Geographical insights
  • Competitive landscape

Interested in this report?

Get your sample now to see our research methodology and insights!

Download Now

Frequently Asked Questions

Powersports Batteries market growth will increase by USD 2449.8 million during 2026-2030.

The Powersports Batteries market is expected to grow at a CAGR of 4.6% during 2026-2030.

Powersports Batteries market is segmented by Vehicle type (Motorcycles, ATVs and UTVs, Mopeds and scooters, Others) Channel (Aftermarket, OEM) Battery type (Nickel-metal hydride (NiMH), Lithium-iron phosphate (LiFePO4))

Amara Raja Group, Atlas Battery Ltd., Banner GmbH, BS Battery, Camel Group Co. Ltd., CLARIOS LLC, Crown Battery Manufacturing Co., Discover Battery, East Penn Manufacture Co. Inc., EnerSys Inc., Exide Technologies, Fullriver Battery, GS Yuasa International Ltd., Leoch International Technology, MIDAC SpA, Panasonic Holdings Corp., Power Sonic Corp., Samsung SDI Co. Ltd., Skyrich Powersport Batteries, Super B Lithium Power B.V., Tianneng Group are a few of the key vendors in the Powersports Batteries market.

APAC will register the highest growth rate of 51% among the other regions. Therefore, the Powersports Batteries market in APAC is expected to garner significant business opportunities for the vendors during the forecast period.

China, India, Japan, South Korea, Australia, Indonesia, US, Canada, Mexico, Germany, UK, France, Italy, Spain, The Netherlands, Brazil, Argentina, Chile, Saudi Arabia, UAE, South Africa, Turkey, Israel

  • Commercial electrification of recreational vehicle fleets is the driving factor this market.

The Powersports Batteries market vendors should focus on grabbing business opportunities from the Vehicle type segment as it accounted for the largest market share in the base year.
RIA - Research AI Assistant
Ask RIA
