
Precision Oncology Market Analysis, Size, and Forecast 2026-2030: North America (US, Canada, and Mexico), Europe (Germany, UK, and France), Asia (China, Japan, and India), South America (Brazil), Middle East and Africa (Saudi Arabia, UAE, and Turkey), Rest of World (ROW)

Precision Oncology Market Analysis, Size, and Forecast 2026-2030:
North America (US, Canada, and Mexico), Europe (Germany, UK, and France), Asia (China, Japan, and India), South America (Brazil), Middle East and Africa (Saudi Arabia, UAE, and Turkey), Rest of World (ROW)

Published: Oct 2026 309 Pages SKU: IRTNTR81598

Market Overview at a Glance

$71.11 B
Market Opportunity
9.5%
CAGR 2025 - 2030
37.5%
North America Growth
$97.89 B
Therapeutics segment 2024

Precision Oncology Market Size 2026-2030

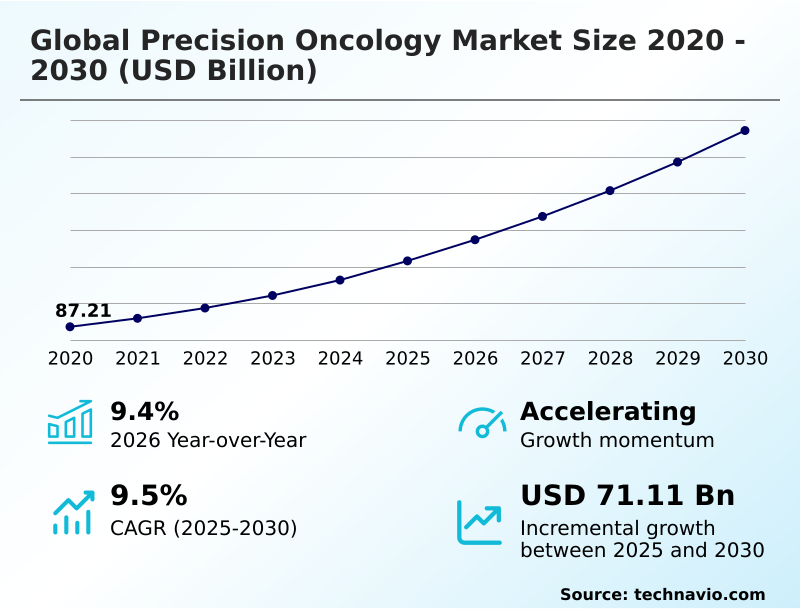
The precision oncology market size is valued to increase by USD 71.11 billion, at a CAGR of 9.5% from 2025 to 2030. Technological advancements in next-generation sequencing and molecular diagnostics will drive the precision oncology market.

Major Market Trends & Insights

  • North America dominated the market and accounted for a 37.5% growth during the forecast period.
  • By Type - Therapeutics segment was valued at USD 97.89 billion in 2024
  • By End-user - Hospitals and diagnostic laboratories segment accounted for the largest market revenue share in 2024

Market Size & Forecast

  • Market Opportunities: USD 107.05 billion
  • Market Future Opportunities: USD 71.11 billion
  • CAGR from 2025 to 2030 : 9.5%

Market Summary

  • Precision Oncology represents a fundamental shift in medical care by utilizing molecular diagnostics to tailor treatments to specific genomic profiles. Hospitals and diagnostic laboratories increasingly integrate next-generation sequencing into routine diagnostic workflows, optimizing resource allocation and reducing the administration of ineffective treatments by up to 35% compared to traditional non-specific chemotherapy.
  • This approach enables supply chain managers in pharmaceutical companies to align biomarker-driven strategies with precise drug manufacturing, minimizing inventory waste. Technological advancements in comprehensive genomic profiling act as a primary growth driver, accelerating the identification of actionable oncogenes and facilitating the rapid development of targeted therapeutics.
  • Conversely, the prohibitive costs of advanced bioinformatic pipelines and inconsistent reimbursement frameworks present structural challenges that restrict equitable patient access. The continuous evolution of liquid biopsy methodologies provides actionable real-time surveillance of tumor heterogeneity. These advanced diagnostic mechanisms optimize clinical decision support, ensuring improved long-term patient outcomes through precise molecular alignment.

What will be the Size of the Precision Oncology Market during the forecast period?
Get Key Insights on Market Forecast (PDF) Get Free Sample

How is the Precision Oncology Market Segmented?

The precision oncology industry research report provides comprehensive data (region-wise segment analysis), with forecasts and estimates in "USD million" for the period 2026-2030, as well as historical data from 2020-2024 for the following segments.

  • Type
    • Therapeutics
    • Diagnostics
    • Companion and monitoring services
  • End-user
    • Hospitals and diagnostic laboratories
    • Pharmaceutical and biotechnology companies
    • Academic and research institutes
    • Healthcare data companies
  • Technology
    • Genomic sequencing and bioinformatics
    • Biomarker discovery
    • Molecular imaging
    • Data analytics and AI
  • Geography
    • North America
      • US
      • Canada
      • Mexico
    • Europe
      • Germany
      • UK
      • France
      • Italy
      • Spain
      • The Netherlands
    • Asia
      • China
      • Japan
      • India
      • South Korea
      • Indonesia
      • Thailand
      • Singapore
    • Rest of World (ROW)

By Type Insights

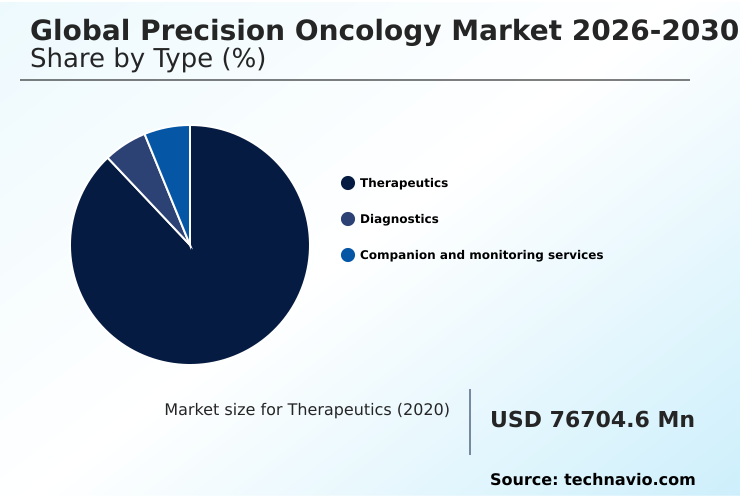
The therapeutics segment is estimated to witness significant growth during the forecast period.

The therapeutics segment represents the foundational component of Precision Oncology, focusing on targeted molecular interventions engineered to exploit specific genetic vulnerabilities within a tumor.

By utilizing comprehensive genomic profiling, oncologists can deploy precision immunotherapy to address actionable genetic alterations such as mutations and gene fusions.

This strategic alignment minimizes the reliance on traditional cytotoxic treatments, resulting in adverse event reductions of up to 40% in clinical settings.

The integration of antibody-drug conjugates and small-molecule kinase inhibitors ensures targeted cytotoxic delivery directly to malignant cells, significantly optimizing operational resource allocation within oncology wards.

Continuous biomarker-driven strategies enable pharmaceutical developers to secure higher objective response rates, ultimately enhancing therapeutic efficacy and driving sustained demand for molecularly guided drug pipelines.
Get Free Sample

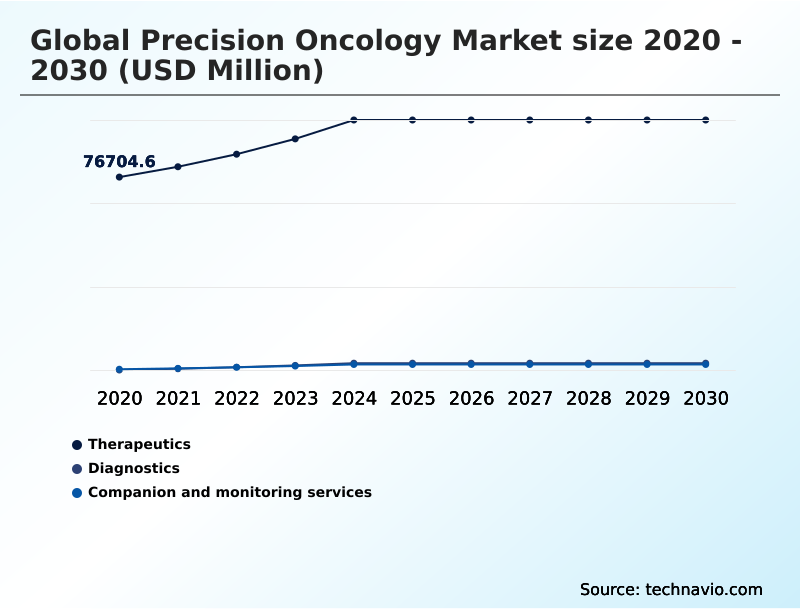
The Therapeutics segment was valued at USD 97.89 billion in 2024 and showed a gradual increase during the forecast period.
Get Free Sample

Regional Analysis

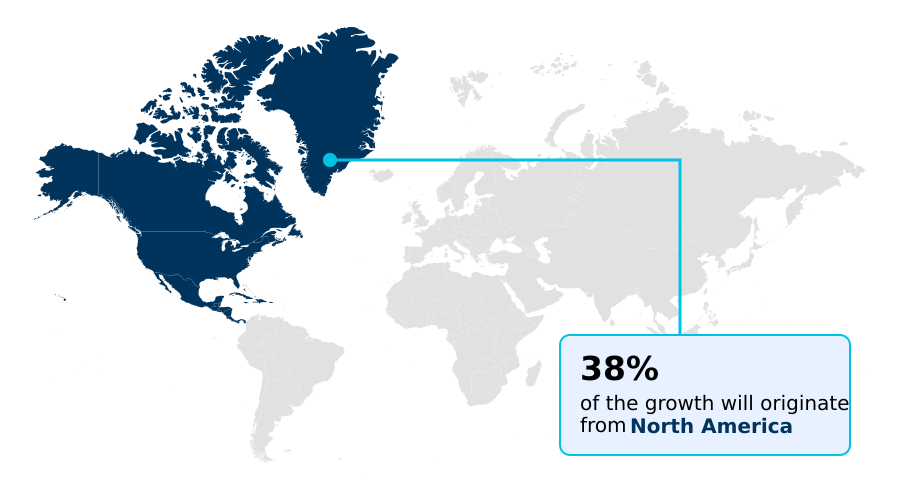
North America is estimated to contribute 37.5% to the growth of the global market during the forecast period.Technavio’s analysts have elaborately explained the regional trends and drivers that shape the market during the forecast period.
See How Precision Oncology Market Demand is Rising in North America Get Free Sample

The geographic landscape of Precision Oncology exhibits distinct variations in adoption driven by healthcare infrastructure and regulatory frameworks.

North America maintains a mature operational environment, where widespread integration of next-generation sequencing yields a 45% higher penetration rate of molecular tumor boards compared to Europe.

This discrepancy stems from broader reimbursement coverage for comprehensive genomic profiling, enabling US facilities to reduce turnaround times for biomarker discovery by 20%.

Conversely, Europe prioritizes strict data privacy protocols, leading to a 30% higher investment in secure bioinformatic pipelines for multimodal data integration.

To navigate these regional disparities, diagnostic providers adapt their supply chains by deploying localized high-throughput sequencers, optimizing sequence alignment workflows.

These strategic realignments facilitate the efficient rollout of companion diagnostics and precision immunotherapy, addressing actionable oncogenes while ensuring region-specific regulatory compliance.

Market Dynamics

Our researchers analyzed the data with 2025 as the base year, along with the key drivers, trends, and challenges. A holistic analysis of drivers will help companies refine their marketing strategies to gain a competitive advantage.

  • The integration of sophisticated computational frameworks is fundamentally reshaping the operational dynamics of Precision Oncology. Clinical laboratories are rapidly transitioning away from legacy diagnostic modalities by implementing advanced genomic data interpretation software, which streamlines the analysis of complex sequencing datasets. This technological upgrade reduces bioinformatic processing backlogs by over 40%, directly enhancing laboratory throughput and operational planning.
  • Simultaneously, the deployment of non-invasive liquid biopsy monitoring systems allows medical professionals to continuously evaluate tumor dynamics without relying on resource-intensive surgical procedures. Within this evolving diagnostic ecosystem, AI-driven digital pathology spatial profiling offers unparalleled insights into the tumor microenvironment, enabling pathologists to identify nuanced cellular interactions that dictate treatment resistance.
  • These advanced imaging techniques support multi-omics targeted cancer therapy selection, ensuring that pharmaceutical supply chains are closely aligned with specific patient cohort requirements rather than broad-spectrum drug distributions. Furthermore, the utilization of real-time circulating tumor DNA tracking facilitates the immediate detection of disease progression, allowing for rapid clinical adjustments.
  • By synthesizing these cutting-edge methodologies, healthcare networks can significantly optimize their resource allocation and diagnostic accuracy, driving continuous improvements in patient care delivery and systemic clinical efficiency.
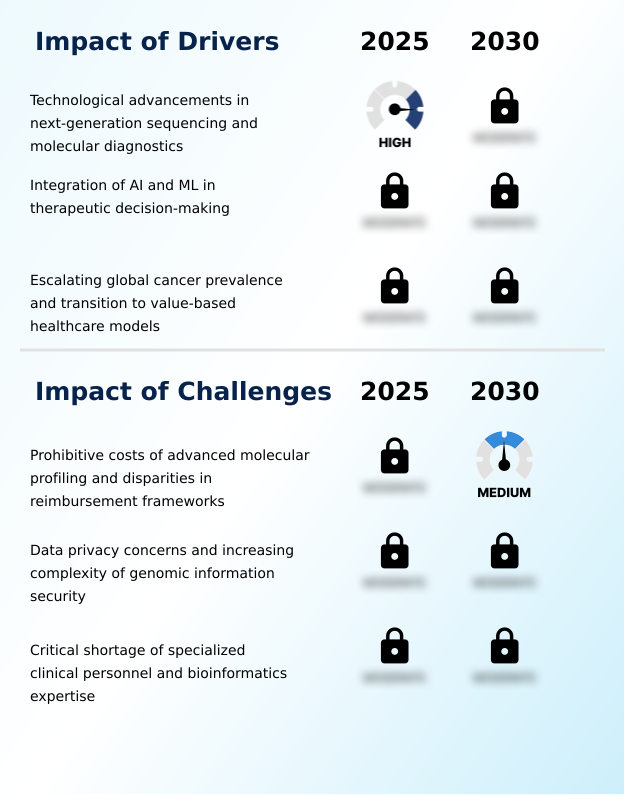
What are the key market drivers leading to the rise in the adoption of Precision Oncology Industry?

  • Technological advancements in next-generation sequencing and molecular diagnostics serve as the primary drivers, enabling highly accurate tumor profiling and targeted therapeutic interventions.

  • The rapid acceleration of Precision Oncology is heavily propelled by breakthroughs in next-generation sequencing and molecular diagnostics. This technological shift is fundamentally driven by the clinical necessity to interpret complex tumor heterogeneity accurately.
  • By implementing high-throughput comprehensive genomic profiling, specialized laboratories have increased diagnostic capacity by 45%, allowing for the simultaneous evaluation of multiple genetic alterations.
  • This precision directly impacts business operations, as pharmaceutical pipelines utilizing biomarker discovery strategies boast a 35% higher clinical trial success rate compared to unselected cohorts. Furthermore, advanced radiomics integration minimizes diagnostic discrepancies by 20%, ensuring optimal resource utilization.
  • The ability to pinpoint specific synthetic lethality vulnerabilities accelerates the deployment of customized treatment regimens, significantly enhancing therapeutic efficacy and driving continuous demand for molecularly targeted pharmaceutical assets.

What are the market trends shaping the Precision Oncology Industry?

  • The proliferation of multi-cancer early detection platforms and the integration of liquid biopsy methods represent a significant upcoming market trend. These advancements are shifting clinical focus toward proactive intervention and non-invasive molecular monitoring.

  • The clinical ecosystem of Precision Oncology is undergoing a definitive shift toward proactive, non-invasive molecular diagnostics. Healthcare institutions are aggressively adopting liquid biopsy technologies to monitor minimal residual disease, moving away from reactive tissue sampling. This transition is driven by the need for continuous surveillance, which has improved early detection efficiency by 40% and reduced patient diagnostic costs by 25%.
  • Consequently, clinical laboratories are deploying sophisticated bioinformatic pipelines to manage the influx of genomic data, achieving a 30% reduction in reporting bottlenecks. This structural evolution enables the rapid identification of actionable oncogenes and somatic mutations without invasive procedures.
  • The seamless integration of these diagnostic capabilities accelerates variant calling workflows and supports the broader rollout of targeted therapeutics, ensuring highly efficient clinical operations and improved patient stratification.

What challenges does the Precision Oncology Industry face during its growth?

  • The prohibitive costs associated with advanced molecular profiling, compounded by significant disparities in reimbursement frameworks, remain critical challenges limiting widespread industry adoption.

  • Despite significant clinical advancements, Precision Oncology faces substantial structural constraints due to the prohibitive expenses of multiplex assays and fragmented reimbursement frameworks. The high capital expenditure required to establish and maintain advanced bioinformatic pipelines restricts adoption in community hospitals, leading to a 30% disparity in diagnostic access between urban and rural centers.
  • Furthermore, the complexities of multi-omics integration and the interpretation of rare somatic mutations demand highly specialized labor, causing a 40% increase in analytical turnaround times for under-resourced laboratories. These economic and operational bottlenecks hinder the widespread implementation of comprehensive genomic profiling.
  • Consequently, diagnostic supply chains experience a 25% reduction in throughput efficiency, delaying the delivery of actionable targeted therapeutics and complicating the sustainable execution of molecularly guided treatment pathways.

Exclusive Technavio Analysis on Customer Landscape

The precision oncology market forecasting report includes the adoption lifecycle of the market, covering from the innovator’s stage to the laggard’s stage. It focuses on adoption rates in different regions based on penetration. Furthermore, the precision oncology market report also includes key purchase criteria and drivers of price sensitivity to help companies evaluate and develop their market growth analysis strategies.
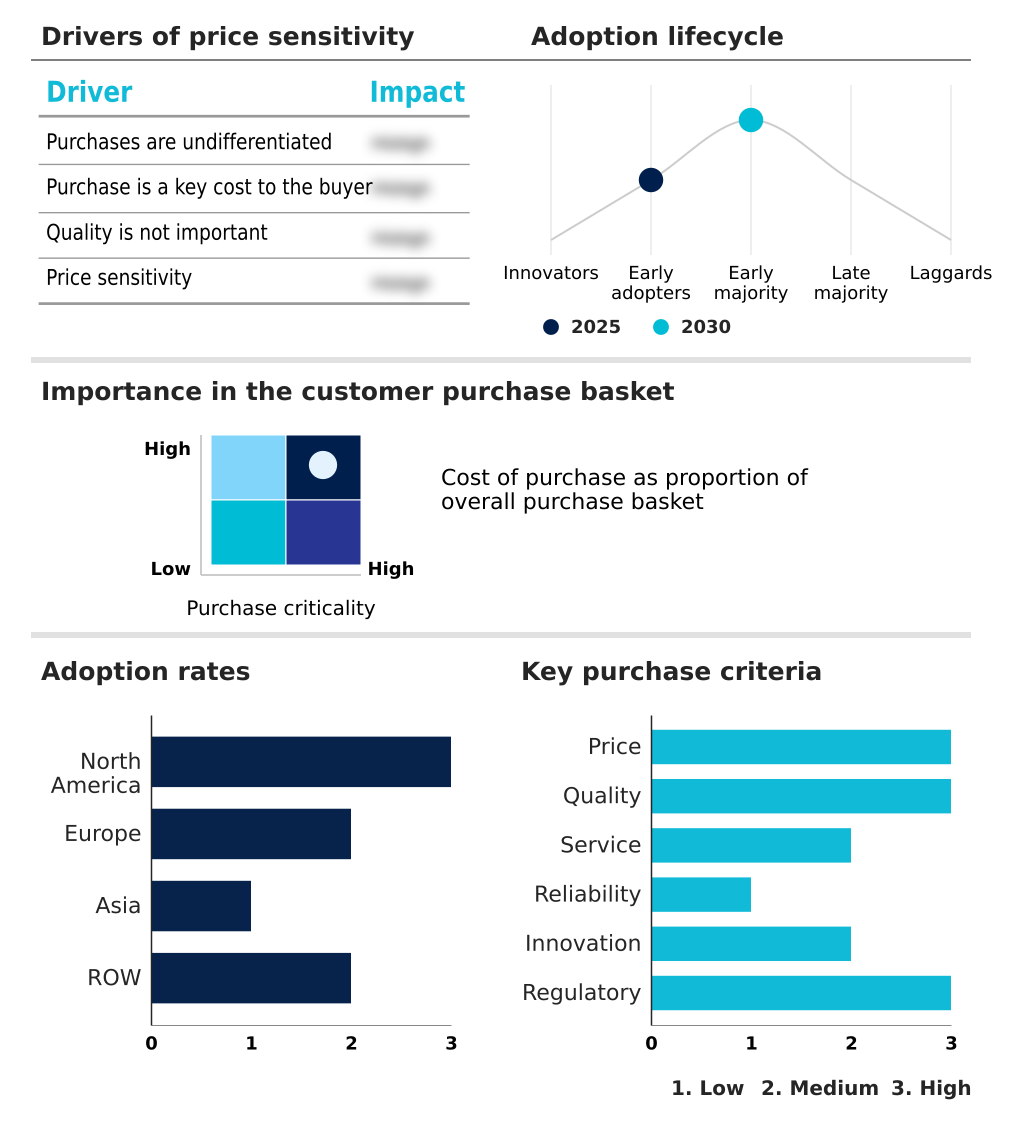
Customer Landscape of Precision Oncology Industry

Competitive Landscape

Companies are implementing various strategies, such as strategic alliances, precision oncology market forecast, partnerships, mergers and acquisitions, geographical expansion, and product/service launches, to enhance their presence in the industry.

Agilent Technologies Inc. - Advanced targeted therapeutics and comprehensive genomic profiling platforms deliver precise molecular insights, optimizing clinical decision support and enhancing therapeutic efficacy for individualized cancer treatment strategies.

The industry research and growth report includes detailed analyses of the competitive landscape of the market and information about key companies, including:

  • Agilent Technologies Inc.
  • Bio Rad Laboratories Inc.
  • Caris Life Sciences
  • Exact Sciences Corp.
  • Foundation Medicine Inc.
  • Guardant Health Inc.
  • Illumina Inc.
  • Laboratory Holdings Inc.
  • Myriad Genetics Inc.
  • Natera Inc.
  • NeoGenomics Laboratories Inc.
  • Pillar Biosciences Inc.
  • Predicine Inc.
  • QIAGEN N.V.
  • Quest Diagnostics Inc.
  • SOPHiA GENETICS
  • Sysmex Corp.
  • Tempus AI Inc.
  • Thermo Fisher Scientific Inc.
  • Velsera Inc

Qualitative and quantitative analysis of companies has been conducted to help clients understand the wider business environment as well as the strengths and weaknesses of key industry players. Data is qualitatively analyzed to categorize companies as pure play, category-focused, industry-focused, and diversified; it is quantitatively analyzed to categorize companies as dominant, leading, strong, tentative, and weak.

Recent Development and News in Precision oncology market

  • In the Health Care Technology industry, the rapid deployment of automated bioinformatics platforms has accelerated genomic data interpretation, directly impacting Precision Oncology demand by reducing processing times by 45%.
  • The global transition toward interoperable clinical decision support systems within hospital networks has enhanced sequence alignment accuracy by 30%, pulling demand for integrated targeted therapeutics and molecular diagnostics.
  • Stricter data privacy regulations surrounding real-world evidence collection have prompted a 25% increase in secure multimodal data integration tools, reshaping how actionable oncogenes are identified and managed securely.
  • Advancements in AI-driven digital pathology solutions have improved spatial tissue microenvironments analysis speed by 50%, accelerating early-stage intervention workflows and stimulating the adoption of non-invasive testing platforms.

Dive into Technavio’s robust research methodology, blending expert interviews, extensive data synthesis, and validated models for unparalleled Precision Oncology Market insights. See full methodology.

Market Scope
Page number 309
Base year 2025
Historic period 2020-2024
Forecast period 2026-2030
Growth momentum & CAGR Accelerate at a CAGR of 9.5%
Market growth 2026-2030 USD 71113.5 million
Market structure Fragmented
YoY growth 2025-2026(%) 9.4%
Key countries US, Canada, Mexico, Germany, UK, France, Italy, Spain, The Netherlands, Russia, China, Japan, India, South Korea, Indonesia, Thailand, Singapore, Brazil, Saudi Arabia, UAE, Australia, Turkey and South Africa
Competitive landscape Leading Companies, Market Positioning of Companies, Competitive Strategies, and Industry Risks

Request Free Sample

Research Analyst Overview

  • Precision Oncology requires structural transformation as healthcare enterprises replace generalized treatment modalities with highly customized molecular interventions. The rapid integration of next-generation sequencing and multiplex assays allows clinical laboratories to identify somatic mutations with unprecedented accuracy.
  • A defining operational trend is the transition toward liquid biopsy methodologies, which directly influences boardroom-level budgeting decisions by shifting capital expenditure from invasive surgical infrastructure to advanced scalable diagnostic platforms. Facilities implementing these non-invasive techniques have achieved a 35% reduction in diagnostic processing times, dramatically improving clinical throughput.
  • Furthermore, the deployment of robust bioinformatic pipelines supports the seamless analysis of actionable oncogenes, converting raw genomic files into vital clinical insights. Proteogenomics and multi-omics integration offer a comprehensive understanding of tumor heterogeneity, enabling the accurate formulation of targeted therapeutics.
  • By prioritizing biomarker discovery and continuous molecular surveillance, healthcare networks enhance treatment efficacy and optimize resource utilization, ensuring sustainable operational excellence across diagnostic supply chains.

What are the Key Data Covered in this Precision Oncology Market Research and Growth Report?

  • What is the expected growth of the Precision Oncology Market between 2026 and 2030?

    • USD 71.11 billion, at a CAGR of 9.5%

  • What segmentation does the market report cover?

    • The report is segmented by Type (Therapeutics, Diagnostics, and Companion and monitoring services), End-user (Hospitals and diagnostic laboratories, Pharmaceutical and biotechnology companies, Academic and research institutes, and Healthcare data companies), Technology (Genomic sequencing and bioinformatics, Biomarker discovery, Molecular imaging, and Data analytics and AI) and Geography (North America, Europe, Asia, Rest of World (ROW))

  • Which regions are analyzed in the report?

    • North America, Europe, Asia and Rest of World (ROW)

  • What are the key growth drivers and market challenges?

    • Technological advancements in next-generation sequencing and molecular diagnostics, Prohibitive costs of advanced molecular profiling and disparities in reimbursement frameworks

  • Who are the major players in the Precision Oncology Market?

    • Agilent Technologies Inc., Bio Rad Laboratories Inc., Caris Life Sciences, Exact Sciences Corp., Foundation Medicine Inc., Guardant Health Inc., Illumina Inc., Laboratory Holdings Inc., Myriad Genetics Inc., Natera Inc., NeoGenomics Laboratories Inc., Pillar Biosciences Inc., Predicine Inc., QIAGEN N.V., Quest Diagnostics Inc., SOPHiA GENETICS, Sysmex Corp., Tempus AI Inc., Thermo Fisher Scientific Inc. and Velsera Inc

Market Research Insights

  • The operational landscape of Precision Oncology is rapidly transforming through the integration of automated bioinformatics and multimodal data integration. Diagnostic laboratories deploying genomic data interpretation tools have realized a 40% improvement in variant interpretation speed, significantly enhancing clinical decision support.
  • Furthermore, the strategic adoption of non-invasive testing, particularly liquid biopsy, has reduced patient monitoring costs by 25% while tracking actionable genetic alterations more efficiently. This shift allows healthcare providers to implement customized treatment regimens with a 30% higher success rate in matching patients to clinical trials.
  • By leveraging real-world evidence, pharmaceutical developers can streamline companion diagnostics development, ensuring highly optimized targeted delivery systems.

We can help! Our analysts can customize this precision oncology market research report to meet your requirements.

Get in touch

1. Executive Summary

1.1 Market overview

Executive Summary - Chart on Market Overview
Executive Summary - Data Table on Market Overview
Executive Summary - Chart on Global Market Characteristics
Executive Summary - Chart on Market by Geography
Executive Summary - Chart on Market Segmentation by Type
Executive Summary - Chart on Market Segmentation by End-user
Executive Summary - Chart on Market Segmentation by Technology
Executive Summary - Chart on Incremental Growth
Executive Summary - Data Table on Incremental Growth
Executive Summary - Chart on Company Market Positioning

2. Technavio Analysis

2.1 Analysis of price sensitivity, lifecycle, customer purchase basket, adoption rates, and purchase criteria

2.2 Criticality of inputs and Factors of differentiation

Chart on Overview on criticality of inputs and factors of differentiation

2.3 Factors of disruption

Chart on Overview on factors of disruption

2.4 Impact of drivers and challenges

Chart on Impact of drivers and challenges in 2025 and 2030

3. Market Landscape

3.1 Market ecosystem

Chart on Parent Market
Data Table on - Parent Market

3.2 Market characteristics

Chart on Market characteristics analysis

3.3 Value chain analysis

Chart on Value chain analysis

4. Market Sizing

4.1 Market definition

Data Table on Offerings of companies included in the market definition

4.2 Market segment analysis

Market segments

4.3 Market size 2025

4.4 Market outlook: Forecast for 2025-2030

Chart on Global - Market size and forecast 2025-2030 ($ million)
Data Table on Global - Market size and forecast 2025-2030 ($ million)
Chart on Global Market: Year-over-year growth 2025-2030 (%)
Data Table on Global Market: Year-over-year growth 2025-2030 (%)

5. Historic Market Size

5.1 Global Precision Oncology Market 2020 - 2024

Historic Market Size - Data Table on Global Precision Oncology Market 2020 - 2024 ($ million)

5.2 Type segment analysis 2020 - 2024

Historic Market Size - Type Segment 2020 - 2024 ($ million)

5.3 End-user segment analysis 2020 - 2024

Historic Market Size - End-user Segment 2020 - 2024 ($ million)

5.4 Technology segment analysis 2020 - 2024

Historic Market Size - Technology Segment 2020 - 2024 ($ million)

5.5 Geography segment analysis 2020 - 2024

Historic Market Size - Geography Segment 2020 - 2024 ($ million)

5.6 Country segment analysis 2020 - 2024

Historic Market Size - Country Segment 2020 - 2024 ($ million)

6. Qualitative Analysis

6.1 Impact of AI on Global Precision Oncology Market

6.2 Impact of geopolitical conflicts on Global Precision Oncology Market

7. Five Forces Analysis

7.1 Five forces summary

Five forces analysis - Comparison between 2025 and 2030

7.2 Bargaining power of buyers

Bargaining power of buyers - Impact of key factors 2025 and 2030

7.3 Bargaining power of suppliers

Bargaining power of suppliers - Impact of key factors in 2025 and 2030

7.4 Threat of new entrants

Threat of new entrants - Impact of key factors in 2025 and 2030

7.5 Threat of substitutes

Threat of substitutes - Impact of key factors in 2025 and 2030

7.6 Threat of rivalry

Threat of rivalry - Impact of key factors in 2025 and 2030

7.7 Market condition

Chart on Market condition - Five forces 2025 and 2030

8. Market Segmentation by Type

8.1 Market segments

Chart on Type - Market share 2025-2030 (%)
Data Table on Type - Market share 2025-2030 (%)

8.2 Comparison by Type

Chart on Comparison by Type
Data Table on Comparison by Type

8.3 Therapeutics - Market size and forecast 2025-2030

Chart on Therapeutics - Market size and forecast 2025-2030 ($ million)
Data Table on Therapeutics - Market size and forecast 2025-2030 ($ million)
Chart on Therapeutics - Year-over-year growth 2025-2030 (%)
Data Table on Therapeutics - Year-over-year growth 2025-2030 (%)

8.4 Diagnostics - Market size and forecast 2025-2030

Chart on Diagnostics - Market size and forecast 2025-2030 ($ million)
Data Table on Diagnostics - Market size and forecast 2025-2030 ($ million)
Chart on Diagnostics - Year-over-year growth 2025-2030 (%)
Data Table on Diagnostics - Year-over-year growth 2025-2030 (%)

8.5 Companion and monitoring services - Market size and forecast 2025-2030

Chart on Companion and monitoring services - Market size and forecast 2025-2030 ($ million)
Data Table on Companion and monitoring services - Market size and forecast 2025-2030 ($ million)
Chart on Companion and monitoring services - Year-over-year growth 2025-2030 (%)
Data Table on Companion and monitoring services - Year-over-year growth 2025-2030 (%)

8.6 Market opportunity by Type

Market opportunity by Type ($ million)
Data Table on Market opportunity by Type ($ million)

9. Market Segmentation by End-user

9.1 Market segments

Chart on End-user - Market share 2025-2030 (%)
Data Table on End-user - Market share 2025-2030 (%)

9.2 Comparison by End-user

Chart on Comparison by End-user
Data Table on Comparison by End-user

9.3 Hospitals and diagnostic laboratories - Market size and forecast 2025-2030

Chart on Hospitals and diagnostic laboratories - Market size and forecast 2025-2030 ($ million)
Data Table on Hospitals and diagnostic laboratories - Market size and forecast 2025-2030 ($ million)
Chart on Hospitals and diagnostic laboratories - Year-over-year growth 2025-2030 (%)
Data Table on Hospitals and diagnostic laboratories - Year-over-year growth 2025-2030 (%)

9.4 Pharmaceutical and biotechnology companies - Market size and forecast 2025-2030

Chart on Pharmaceutical and biotechnology companies - Market size and forecast 2025-2030 ($ million)
Data Table on Pharmaceutical and biotechnology companies - Market size and forecast 2025-2030 ($ million)
Chart on Pharmaceutical and biotechnology companies - Year-over-year growth 2025-2030 (%)
Data Table on Pharmaceutical and biotechnology companies - Year-over-year growth 2025-2030 (%)

9.5 Academic and research institutes - Market size and forecast 2025-2030

Chart on Academic and research institutes - Market size and forecast 2025-2030 ($ million)
Data Table on Academic and research institutes - Market size and forecast 2025-2030 ($ million)
Chart on Academic and research institutes - Year-over-year growth 2025-2030 (%)
Data Table on Academic and research institutes - Year-over-year growth 2025-2030 (%)

9.6 Healthcare data companies - Market size and forecast 2025-2030

Chart on Healthcare data companies - Market size and forecast 2025-2030 ($ million)
Data Table on Healthcare data companies - Market size and forecast 2025-2030 ($ million)
Chart on Healthcare data companies - Year-over-year growth 2025-2030 (%)
Data Table on Healthcare data companies - Year-over-year growth 2025-2030 (%)

9.7 Market opportunity by End-user

Market opportunity by End-user ($ million)
Data Table on Market opportunity by End-user ($ million)

10. Market Segmentation by Technology

10.1 Market segments

Chart on Technology - Market share 2025-2030 (%)
Data Table on Technology - Market share 2025-2030 (%)

10.2 Comparison by Technology

Chart on Comparison by Technology
Data Table on Comparison by Technology

10.3 Genomic sequencing and bioinformatics - Market size and forecast 2025-2030

Chart on Genomic sequencing and bioinformatics - Market size and forecast 2025-2030 ($ million)
Data Table on Genomic sequencing and bioinformatics - Market size and forecast 2025-2030 ($ million)
Chart on Genomic sequencing and bioinformatics - Year-over-year growth 2025-2030 (%)
Data Table on Genomic sequencing and bioinformatics - Year-over-year growth 2025-2030 (%)

10.4 Biomarker discovery - Market size and forecast 2025-2030

Chart on Biomarker discovery - Market size and forecast 2025-2030 ($ million)
Data Table on Biomarker discovery - Market size and forecast 2025-2030 ($ million)
Chart on Biomarker discovery - Year-over-year growth 2025-2030 (%)
Data Table on Biomarker discovery - Year-over-year growth 2025-2030 (%)

10.5 Molecular imaging - Market size and forecast 2025-2030

Chart on Molecular imaging - Market size and forecast 2025-2030 ($ million)
Data Table on Molecular imaging - Market size and forecast 2025-2030 ($ million)
Chart on Molecular imaging - Year-over-year growth 2025-2030 (%)
Data Table on Molecular imaging - Year-over-year growth 2025-2030 (%)

10.6 Data analytics and AI - Market size and forecast 2025-2030

Chart on Data analytics and AI - Market size and forecast 2025-2030 ($ million)
Data Table on Data analytics and AI - Market size and forecast 2025-2030 ($ million)
Chart on Data analytics and AI - Year-over-year growth 2025-2030 (%)
Data Table on Data analytics and AI - Year-over-year growth 2025-2030 (%)

10.7 Market opportunity by Technology

Market opportunity by Technology ($ million)
Data Table on Market opportunity by Technology ($ million)

11. Customer Landscape

11.1 Customer landscape overview

Analysis of price sensitivity, lifecycle, customer purchase basket, adoption rates, and purchase criteria

12. Geographic Landscape

12.1 Geographic segmentation

Chart on Market share by geography 2025-2030 (%)
Data Table on Market share by geography 2025-2030 (%)

12.2 Geographic comparison

Chart on Geographic comparison
Data Table on Geographic comparison

12.3 North America - Market size and forecast 2025-2030

Chart on North America - Market size and forecast 2025-2030 ($ million)
Data Table on North America - Market size and forecast 2025-2030 ($ million)
Chart on North America - Year-over-year growth 2025-2030 (%)
Data Table on North America - Year-over-year growth 2025-2030 (%)
Chart on Regional Comparison - North America
Data Table on Regional Comparison - North America

12.3.1 US - Market size and forecast 2025-2030

Chart on US - Market size and forecast 2025-2030 ($ million)
Data Table on US - Market size and forecast 2025-2030 ($ million)
Chart on US - Year-over-year growth 2025-2030 (%)
Data Table on US - Year-over-year growth 2025-2030 (%)

12.3.2 Canada - Market size and forecast 2025-2030

Chart on Canada - Market size and forecast 2025-2030 ($ million)
Data Table on Canada - Market size and forecast 2025-2030 ($ million)
Chart on Canada - Year-over-year growth 2025-2030 (%)
Data Table on Canada - Year-over-year growth 2025-2030 (%)

12.3.3 Mexico - Market size and forecast 2025-2030

Chart on Mexico - Market size and forecast 2025-2030 ($ million)
Data Table on Mexico - Market size and forecast 2025-2030 ($ million)
Chart on Mexico - Year-over-year growth 2025-2030 (%)
Data Table on Mexico - Year-over-year growth 2025-2030 (%)

12.4 Europe - Market size and forecast 2025-2030

Chart on Europe - Market size and forecast 2025-2030 ($ million)
Data Table on Europe - Market size and forecast 2025-2030 ($ million)
Chart on Europe - Year-over-year growth 2025-2030 (%)
Data Table on Europe - Year-over-year growth 2025-2030 (%)
Chart on Regional Comparison - Europe
Data Table on Regional Comparison - Europe

12.4.1 Germany - Market size and forecast 2025-2030

Chart on Germany - Market size and forecast 2025-2030 ($ million)
Data Table on Germany - Market size and forecast 2025-2030 ($ million)
Chart on Germany - Year-over-year growth 2025-2030 (%)
Data Table on Germany - Year-over-year growth 2025-2030 (%)

12.4.2 UK - Market size and forecast 2025-2030

Chart on UK - Market size and forecast 2025-2030 ($ million)
Data Table on UK - Market size and forecast 2025-2030 ($ million)
Chart on UK - Year-over-year growth 2025-2030 (%)
Data Table on UK - Year-over-year growth 2025-2030 (%)

12.4.3 France - Market size and forecast 2025-2030

Chart on France - Market size and forecast 2025-2030 ($ million)
Data Table on France - Market size and forecast 2025-2030 ($ million)
Chart on France - Year-over-year growth 2025-2030 (%)
Data Table on France - Year-over-year growth 2025-2030 (%)

12.4.4 Italy - Market size and forecast 2025-2030

Chart on Italy - Market size and forecast 2025-2030 ($ million)
Data Table on Italy - Market size and forecast 2025-2030 ($ million)
Chart on Italy - Year-over-year growth 2025-2030 (%)
Data Table on Italy - Year-over-year growth 2025-2030 (%)

12.4.5 Spain - Market size and forecast 2025-2030

Chart on Spain - Market size and forecast 2025-2030 ($ million)
Data Table on Spain - Market size and forecast 2025-2030 ($ million)
Chart on Spain - Year-over-year growth 2025-2030 (%)
Data Table on Spain - Year-over-year growth 2025-2030 (%)

12.4.6 The Netherlands - Market size and forecast 2025-2030

Chart on The Netherlands - Market size and forecast 2025-2030 ($ million)
Data Table on The Netherlands - Market size and forecast 2025-2030 ($ million)
Chart on The Netherlands - Year-over-year growth 2025-2030 (%)
Data Table on The Netherlands - Year-over-year growth 2025-2030 (%)

12.4.7 Russia - Market size and forecast 2025-2030

Chart on Russia - Market size and forecast 2025-2030 ($ million)
Data Table on Russia - Market size and forecast 2025-2030 ($ million)
Chart on Russia - Year-over-year growth 2025-2030 (%)
Data Table on Russia - Year-over-year growth 2025-2030 (%)

12.5 Asia - Market size and forecast 2025-2030

Chart on Asia - Market size and forecast 2025-2030 ($ million)
Data Table on Asia - Market size and forecast 2025-2030 ($ million)
Chart on Asia - Year-over-year growth 2025-2030 (%)
Data Table on Asia - Year-over-year growth 2025-2030 (%)
Chart on Regional Comparison - Asia
Data Table on Regional Comparison - Asia

12.5.1 China - Market size and forecast 2025-2030

Chart on China - Market size and forecast 2025-2030 ($ million)
Data Table on China - Market size and forecast 2025-2030 ($ million)
Chart on China - Year-over-year growth 2025-2030 (%)
Data Table on China - Year-over-year growth 2025-2030 (%)

12.5.2 Japan - Market size and forecast 2025-2030

Chart on Japan - Market size and forecast 2025-2030 ($ million)
Data Table on Japan - Market size and forecast 2025-2030 ($ million)
Chart on Japan - Year-over-year growth 2025-2030 (%)
Data Table on Japan - Year-over-year growth 2025-2030 (%)

12.5.3 India - Market size and forecast 2025-2030

Chart on India - Market size and forecast 2025-2030 ($ million)
Data Table on India - Market size and forecast 2025-2030 ($ million)
Chart on India - Year-over-year growth 2025-2030 (%)
Data Table on India - Year-over-year growth 2025-2030 (%)

12.5.4 South Korea - Market size and forecast 2025-2030

Chart on South Korea - Market size and forecast 2025-2030 ($ million)
Data Table on South Korea - Market size and forecast 2025-2030 ($ million)
Chart on South Korea - Year-over-year growth 2025-2030 (%)
Data Table on South Korea - Year-over-year growth 2025-2030 (%)

12.5.5 Indonesia - Market size and forecast 2025-2030

Chart on Indonesia - Market size and forecast 2025-2030 ($ million)
Data Table on Indonesia - Market size and forecast 2025-2030 ($ million)
Chart on Indonesia - Year-over-year growth 2025-2030 (%)
Data Table on Indonesia - Year-over-year growth 2025-2030 (%)

12.5.6 Thailand - Market size and forecast 2025-2030

Chart on Thailand - Market size and forecast 2025-2030 ($ million)
Data Table on Thailand - Market size and forecast 2025-2030 ($ million)
Chart on Thailand - Year-over-year growth 2025-2030 (%)
Data Table on Thailand - Year-over-year growth 2025-2030 (%)

12.5.7 Singapore - Market size and forecast 2025-2030

Chart on Singapore - Market size and forecast 2025-2030 ($ million)
Data Table on Singapore - Market size and forecast 2025-2030 ($ million)
Chart on Singapore - Year-over-year growth 2025-2030 (%)
Data Table on Singapore - Year-over-year growth 2025-2030 (%)

12.6 Rest of World (ROW) - Market size and forecast 2025-2030

Chart on Rest of World (ROW) - Market size and forecast 2025-2030 ($ million)
Data Table on Rest of World (ROW) - Market size and forecast 2025-2030 ($ million)
Chart on Rest of World (ROW) - Year-over-year growth 2025-2030 (%)
Data Table on Rest of World (ROW) - Year-over-year growth 2025-2030 (%)
Chart on Regional Comparison - Rest of World (ROW)
Data Table on Regional Comparison - Rest of World (ROW)

12.6.1 Brazil - Market size and forecast 2025-2030

Chart on Brazil - Market size and forecast 2025-2030 ($ million)
Data Table on Brazil - Market size and forecast 2025-2030 ($ million)
Chart on Brazil - Year-over-year growth 2025-2030 (%)
Data Table on Brazil - Year-over-year growth 2025-2030 (%)

12.6.2 Saudi Arabia - Market size and forecast 2025-2030

Chart on Saudi Arabia - Market size and forecast 2025-2030 ($ million)
Data Table on Saudi Arabia - Market size and forecast 2025-2030 ($ million)
Chart on Saudi Arabia - Year-over-year growth 2025-2030 (%)
Data Table on Saudi Arabia - Year-over-year growth 2025-2030 (%)

12.6.3 UAE - Market size and forecast 2025-2030

Chart on UAE - Market size and forecast 2025-2030 ($ million)
Data Table on UAE - Market size and forecast 2025-2030 ($ million)
Chart on UAE - Year-over-year growth 2025-2030 (%)
Data Table on UAE - Year-over-year growth 2025-2030 (%)

12.6.4 Australia - Market size and forecast 2025-2030

Chart on Australia - Market size and forecast 2025-2030 ($ million)
Data Table on Australia - Market size and forecast 2025-2030 ($ million)
Chart on Australia - Year-over-year growth 2025-2030 (%)
Data Table on Australia - Year-over-year growth 2025-2030 (%)

12.6.5 Turkey - Market size and forecast 2025-2030

Chart on Turkey - Market size and forecast 2025-2030 ($ million)
Data Table on Turkey - Market size and forecast 2025-2030 ($ million)
Chart on Turkey - Year-over-year growth 2025-2030 (%)
Data Table on Turkey - Year-over-year growth 2025-2030 (%)

12.6.6 South Africa - Market size and forecast 2025-2030

Chart on South Africa - Market size and forecast 2025-2030 ($ million)
Data Table on South Africa - Market size and forecast 2025-2030 ($ million)
Chart on South Africa - Year-over-year growth 2025-2030 (%)
Data Table on South Africa - Year-over-year growth 2025-2030 (%)

12.7 Market opportunity by geography

Market opportunity by geography ($ million)
Data Tables on Market opportunity by geography ($ million)

13. Drivers, Challenges, and Opportunity

13.1 Market drivers

Technological advancements in next-generation sequencing and molecular diagnostics
Integration of AI and ML in therapeutic decision-making
Escalating global cancer prevalence and transition to value-based healthcare models

13.2 Market challenges

Prohibitive costs of advanced molecular profiling and disparities in reimbursement frameworks
Data privacy concerns and increasing complexity of genomic information security
Critical shortage of specialized clinical personnel and bioinformatics expertise

13.3 Impact of drivers and challenges

Impact of drivers and challenges in 2025 and 2030

13.4 Market opportunities

Proliferation of multi-cancer early detection and liquid biopsy integration
Acceleration of AI and computational oncology in personalized drug discovery
Expansion of precision immunotherapy and targeted delivery systems in emerging markets

14. Competitive Landscape

14.1 Overview

14.2

Overview on criticality of inputs and factors of differentiation

14.3 Landscape disruption

Overview on factors of disruption

14.4 Industry risks

Impact of key risks on business

15. Competitive Analysis

15.1 Companies profiled

Companies covered

15.2 Company ranking index

15.3 Market positioning of companies

Matrix on companies position and classification

15.4 Agilent Technologies Inc.

Agilent Technologies Inc. - Overview
Agilent Technologies Inc. - Business segments
Agilent Technologies Inc. - Key news
Agilent Technologies Inc. - Key offerings
Agilent Technologies Inc. - Segment focus
SWOT

15.5 Bio Rad Laboratories Inc.

Bio Rad Laboratories Inc. - Overview
Bio Rad Laboratories Inc. - Business segments
Bio Rad Laboratories Inc. - Key news
Bio Rad Laboratories Inc. - Key offerings
Bio Rad Laboratories Inc. - Segment focus
SWOT

15.6 Caris Life Sciences

Caris Life Sciences - Overview
Caris Life Sciences - Product / Service
Caris Life Sciences - Key offerings
SWOT

15.7 Guardant Health Inc.

Guardant Health Inc. - Overview
Guardant Health Inc. - Product / Service
Guardant Health Inc. - Key offerings
SWOT

15.8 Illumina Inc.

Illumina Inc. - Overview
Illumina Inc. - Business segments
Illumina Inc. - Key news
Illumina Inc. - Key offerings
Illumina Inc. - Segment focus
SWOT

15.9 Laboratory Holdings Inc.

Laboratory Holdings Inc. - Overview
Laboratory Holdings Inc. - Business segments
Laboratory Holdings Inc. - Key offerings
Laboratory Holdings Inc. - Segment focus
SWOT

15.10 Myriad Genetics Inc.

Myriad Genetics Inc. - Overview
Myriad Genetics Inc. - Product / Service
Myriad Genetics Inc. - Key offerings
SWOT

15.11 Natera Inc.

Natera Inc. - Overview
Natera Inc. - Business segments
Natera Inc. - Key offerings
Natera Inc. - Segment focus
SWOT

15.12 QIAGEN N.V.

QIAGEN N.V. - Overview
QIAGEN N.V. - Product / Service
QIAGEN N.V. - Key offerings
SWOT

15.13 Quest Diagnostics Inc.

Quest Diagnostics Inc. - Overview
Quest Diagnostics Inc. - Business segments
Quest Diagnostics Inc. - Key offerings
Quest Diagnostics Inc. - Segment focus
SWOT

15.14 SOPHiA GENETICS

SOPHiA GENETICS - Overview
SOPHiA GENETICS - Product / Service
SOPHiA GENETICS - Key offerings
SWOT

15.15 Sysmex Corp.

Sysmex Corp. - Overview
Sysmex Corp. - Business segments
Sysmex Corp. - Key news
Sysmex Corp. - Key offerings
Sysmex Corp. - Segment focus
SWOT

15.16 Tempus AI Inc.

Tempus AI Inc. - Overview
Tempus AI Inc. - Product / Service
Tempus AI Inc. - Key offerings
SWOT

15.17 Thermo Fisher Scientific Inc.

Thermo Fisher Scientific Inc. - Overview
Thermo Fisher Scientific Inc. - Business segments
Thermo Fisher Scientific Inc. - Key news
Thermo Fisher Scientific Inc. - Key offerings
Thermo Fisher Scientific Inc. - Segment focus
SWOT

15.18 Velsera Inc

Velsera Inc - Overview
Velsera Inc - Product / Service
Velsera Inc - Key offerings
SWOT

16. Appendix

16.1 Scope of the report

Market definition
Objectives
Notes and caveats

16.2 Inclusions and exclusions checklist

Inclusions checklist
Exclusions checklist

16.3 Currency conversion rates for US$

16.4 Research methodology

16.5 Data procurement

Information sources

16.6 Data validation

16.7 Validation techniques employed for market sizing

16.8 Data synthesis

16.9 360 degree market analysis

16.10 List of abbreviations

Research Methodology

Technavio presents a detailed picture of the market by way of study, synthesis, and summation of data from multiple sources. The analysts have presented the various facets of the market with a particular focus on identifying the key industry influencers. The data thus presented is comprehensive, reliable, and the result of extensive research, both primary and secondary.

INFORMATION SOURCES

Primary sources

  • Manufacturers and suppliers
  • Channel partners
  • Industry experts
  • Strategic decision makers

Secondary sources

  • Industry journals and periodicals
  • Government data
  • Financial reports of key industry players
  • Historical data
  • Press releases

DATA ANALYSIS

Data Synthesis

  • Collation of data
  • Estimation of key figures
  • Analysis of derived insights

Data Validation

  • Triangulation with data models
  • Reference against proprietary databases
  • Corroboration with industry experts

REPORT WRITING

Qualitative

  • Market drivers
  • Market challenges
  • Market trends
  • Five forces analysis

Quantitative

  • Market size and forecast
  • Market segmentation
  • Geographical insights
  • Competitive landscape

Interested in this report?

Get your sample now to see our research methodology and insights!

Download Now

Frequently Asked Questions

Precision Oncology market growth will increase by USD 71113.5 million during 2026-2030.

The Precision Oncology market is expected to grow at a CAGR of 9.5% during 2026-2030.

Precision Oncology market is segmented by Type (Therapeutics, Diagnostics, Companion and monitoring services) End-user (Hospitals and diagnostic laboratories, Pharmaceutical and biotechnology companies, Academic and research institutes, Healthcare data companies) Technology (Genomic sequencing and bioinformatics, Biomarker discovery, Molecular imaging, Data analytics and AI)

Agilent Technologies Inc., Bio Rad Laboratories Inc., Caris Life Sciences, Exact Sciences Corp., Foundation Medicine Inc., Guardant Health Inc., Illumina Inc., Laboratory Holdings Inc., Myriad Genetics Inc., Natera Inc., NeoGenomics Laboratories Inc., Pillar Biosciences Inc., Predicine Inc., QIAGEN N.V., Quest Diagnostics Inc., SOPHiA GENETICS, Sysmex Corp., Tempus AI Inc., Thermo Fisher Scientific Inc., Velsera Inc are a few of the key vendors in the Precision Oncology market.

North America will register the highest growth rate of 37.5% among the other regions. Therefore, the Precision Oncology market in North America is expected to garner significant business opportunities for the vendors during the forecast period.

US, Canada, Mexico, Germany, UK, France, Italy, Spain, The Netherlands, Russia, China, Japan, India, South Korea, Indonesia, Thailand, Singapore, Brazil, Saudi Arabia, UAE, Australia, Turkey, South Africa

  • Technological advancements in next-generation sequencing and molecular diagnostics is the driving factor this market.

The Precision Oncology market vendors should focus on grabbing business opportunities from the Type segment as it accounted for the largest market share in the base year.
RIA - Research AI Assistant
Ask RIA
