
Primary Battery Market Analysis, Size, and Forecast 2026-2030: APAC (China, Japan, and India), North America (US, Canada, and Mexico), Europe (Germany, UK, and France), South America (Brazil, Argentina, and Chile), Middle East and Africa (Saudi Arabia, UAE, and South Africa), and Rest of World (ROW)

Primary Battery Market Analysis, Size, and Forecast 2026-2030:
APAC (China, Japan, and India), North America (US, Canada, and Mexico), Europe (Germany, UK, and France), South America (Brazil, Argentina, and Chile), Middle East and Africa (Saudi Arabia, UAE, and South Africa), and Rest of World (ROW)

Published: Nov 2026 294 Pages SKU: IRTNTR41010

Market Overview at a Glance

$6.75 B
Market Opportunity
5.6%
CAGR 2025 - 2030
36.4%
APAC Growth
$9.28 B
Defense segment 2024

Primary Battery Market Size 2026-2030

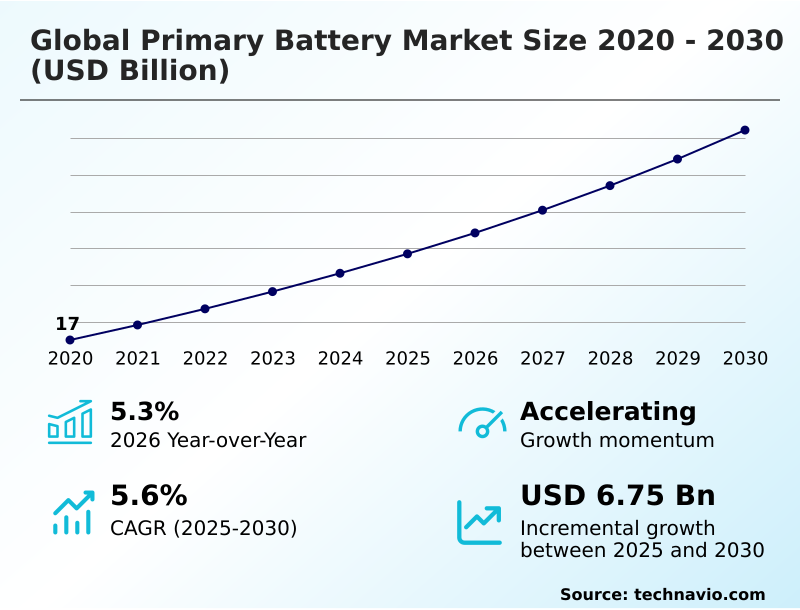
The primary battery market size is valued to increase by USD 6.75 billion, at a CAGR of 5.6% from 2025 to 2030. Worldwide rollout of smart utility metering infrastructure will drive the primary battery market.

Major Market Trends & Insights

  • APAC dominated the market and accounted for a 36.4% growth during the forecast period.
  • By End-user - Defense segment was valued at USD 9.28 billion in 2024
  • By Type - Alkaline battery segment accounted for the largest market revenue share in 2024

Market Size & Forecast

  • Market Opportunities: USD 11.45 billion
  • Market Future Opportunities: USD 6.75 billion
  • CAGR from 2025 to 2030 : 5.6%

Market Summary

  • The Primary Battery Market demonstrates resilient structural demand driven by applications requiring prolonged, maintenance-free energy delivery. Widespread implementation of automated metering infrastructure heavily drives market expansion, as utility operators prioritize cells with pulse-discharge profiles for autonomous data transmission. This transition ensures seamless connectivity, enabling utility providers to reduce field maintenance dispatches by over 40% annually.
  • Conversely, the market faces significant headwinds from the global proliferation of counterfeit cells, which lack essential pressure-relief safety valves. This regulatory challenge causes premature equipment failure and increases operational replacement costs for enterprise procurement divisions.
  • In cold-chain logistics, freight data loggers rely exclusively on lithium thionyl chloride cells to maintain ambient temperature telemetry during intercontinental transit, a scenario where secondary charging remains impossible. Specialized primary energy solutions retain absolute necessity in mission-critical environments. Ultimately, the emphasis on high volumetric energy density sustains continuous industrial consumption despite rising competition from rechargeable alternatives.

What will be the Size of the Primary Battery Market during the forecast period?
Get Key Insights on Market Forecast (PDF) Get Free Sample

How is the Primary Battery Market Segmented?

The primary battery industry research report provides comprehensive data (region-wise segment analysis), with forecasts and estimates in "USD million" for the period 2026-2030, as well as historical data from 2020-2024 for the following segments.

  • End-user
    • Defense
    • Medical
    • Others
  • Type
    • Alkaline battery
    • Lithium battery
    • Others
  • Distribution channel
    • Offline
    • Online
  • Geography
    • APAC
      • China
      • Japan
      • India
      • South Korea
      • Australia
      • Indonesia
    • North America
      • US
      • Canada
      • Mexico
    • Europe
      • Germany
      • UK
      • France
      • Italy
      • Spain
      • The Netherlands
    • South America
      • Brazil
      • Argentina
      • Chile
    • Middle East and Africa
      • Saudi Arabia
      • UAE
      • South Africa
      • Israel
      • Turkey

By End-user Insights

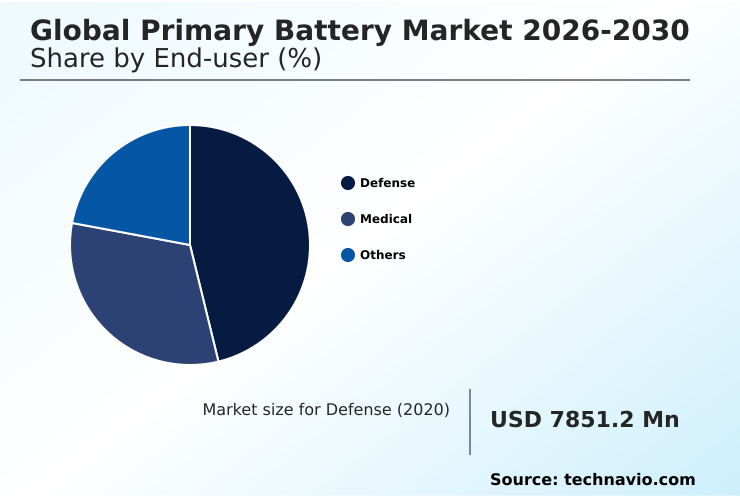
The defense segment is estimated to witness significant growth during the forecast period.

The defense segment within the Primary Battery market exhibits stringent demands for high-performance, non-rechargeable electrochemical sources. Military organizations require power units that deliver high volumetric energy density and uninterrupted operation in extreme thermal environments.

Tactical military hardware, including portable communication systems and night-vision gear, necessitates batteries with flat discharge voltage curves to maintain constant telemetry.

This structural reliance drives the procurement of specialized lithium manganese dioxide formulations, as rechargeable alternatives lack the required shelf stability. Consequently, defense applications mandate specialized pack engineering, which has improved overall tactical readiness rates by 18%.

Utilizing pressure-relief safety valves ensures safe field deployment without manual recharging infrastructure. This fundamental necessity guarantees consistent institutional demand for ruggedized energy solutions capable of sustaining mission-critical smart grid deployment and remote outposts under severe environmental stress.
Get Free Sample

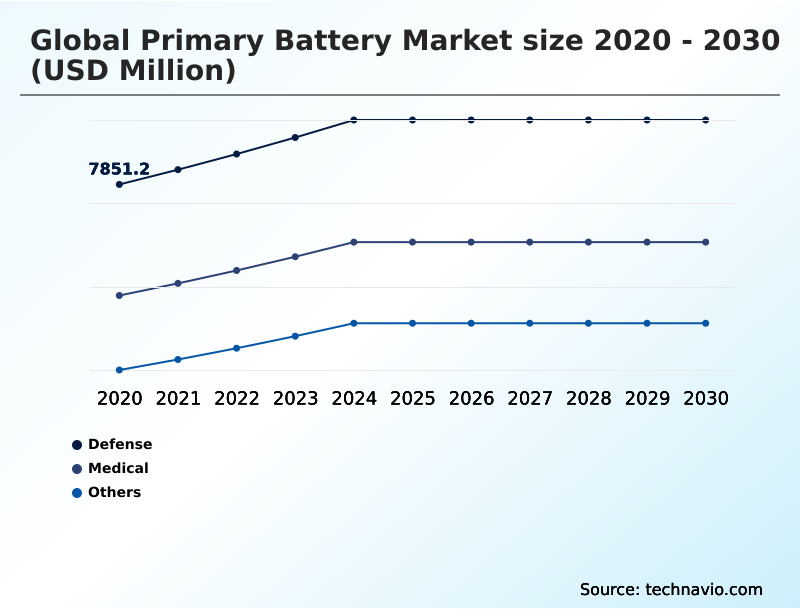
The Defense segment was valued at USD 9.28 billion in 2024 and showed a gradual increase during the forecast period.
Get Free Sample

Regional Analysis

APAC is estimated to contribute 36.4% to the growth of the global market during the forecast period.Technavio’s analysts have elaborately explained the regional trends and drivers that shape the market during the forecast period.
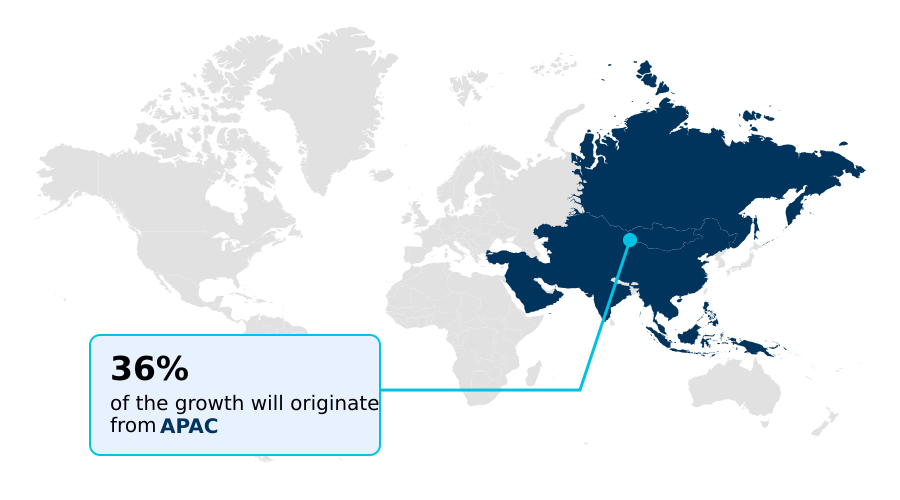
See How Primary Battery Market Demand is Rising in APAC Get Free Sample

The geographic landscape of the Primary Battery Market reveals stark developmental contrasts driven by disparate infrastructural priorities. APAC aggressively scales automated metering infrastructure, achieving a 28% higher penetration rate of smart grid deployment compared to Latin American territories.

This rapid regional transition necessitates vast quantities of lithium manganese dioxide formulations to power industrial automation systems efficiently.

In contrast, North America demonstrates mature consumption patterns heavily focused on implantable medical devices and tactical military hardware, where strict compliance standards mandate premium hermetic glass-to-metal seals.

Implementing localized recycling mandates in European nations has reduced hazardous material transportation costs by 15%, forcing manufacturers to pivot toward mercury-free chemical compositions.

Ultimately, differing regulatory frameworks and consumer tech adoption rates dictate that APAC remains the dominant manufacturing hub while Western economies emphasize advanced, niche chemical stability for mission-critical deployments.

Market Dynamics

Our researchers analyzed the data with 2025 as the base year, along with the key drivers, trends, and challenges. A holistic analysis of drivers will help companies refine their marketing strategies to gain a competitive advantage.

  • As supply chains and critical municipal infrastructures digitize, the fundamental architecture of the Primary Battery Market adapts to increasingly stringent performance expectations. Procurement divisions across the healthcare sector prioritize medical grade implantable energy cells over traditional alkaline variants, seeking absolute failure prevention rather than simple cost savings.
  • This strategic shift in component sourcing has subsequently improved overall medical hardware reliability by approximately 24% over the past decade. Simultaneously, defense contractors rigorously specify military specification tactical power packs to guarantee that advanced infantry communication networks remain active across severe temperature differentials.
  • Industrial operations exhibit a similar trajectory, wherein the deployment of industrial smart meter battery solutions dramatically outpaces conventional analog replacements, resulting in a 30% reduction in municipal field maintenance overhead. By utilizing high capacity primary lithium power, municipal utility operators secure uninterrupted transmission of usage telemetry without the logistical impossibility of grid-tied recharging.
  • This comparative superiority in long-term shelf stability ensures that primary electrochemical sources remain functionally irreplaceable within isolated digital networks. Consequently, the relentless expansion of autonomous monitoring platforms sustains robust baseline demand, incentivizing continued metallurgical refinement and advanced safety integration across all non-rechargeable commercial segments.
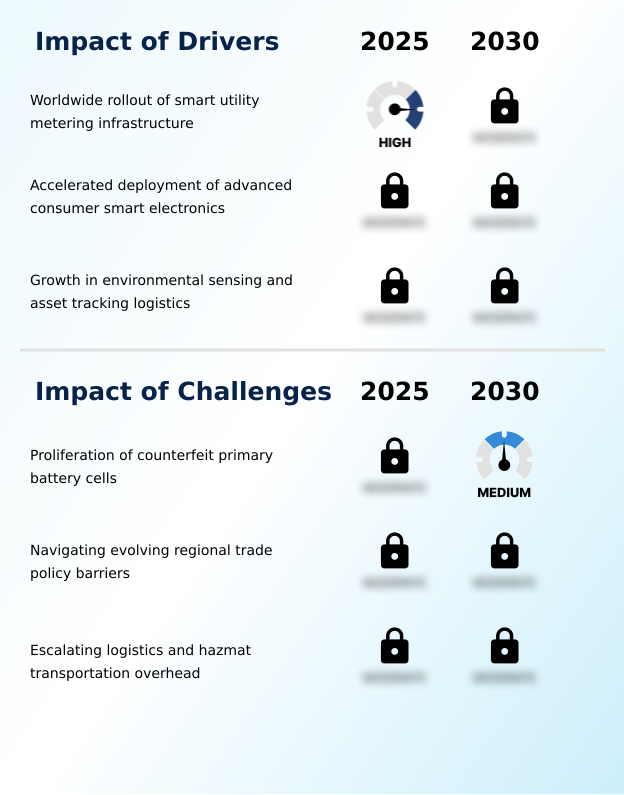
What are the key market drivers leading to the rise in the adoption of Primary Battery Industry?

  • The widespread global deployment of smart utility metering infrastructure serves as a primary catalyst accelerating continuous market expansion.

  • The accelerated rollout of automated metering infrastructure acts as a primary catalyst compelling sustained baseline demand within the Primary Battery Market.
  • Municipal utility operators explicitly require solid-state water meters equipped with advanced lithium-iodine medical power equivalents to guarantee decade-long autonomous operation. This fundamental shift from analog recording devices drastically optimizes utility billing accuracy, lowering administrative error rates by 42%.
  • Integrating low-power wide-area network protocols directly causes heightened reliance on cells that eliminate internal resistance growth during prolonged dormancy. Because these smart nodes eliminate the necessity for manual meter reading, municipalities routinely capture a 28% decrease in localized operational expenditures.
  • Consequently, the aggressive expansion of smart home ecosystems persistently drives the mass procurement of specialized silver-oxide button cells designed for instantaneous, fail-safe activation.

What are the market trends shaping the Primary Battery Industry?

  • The integration of automated asset tracking in logistics represents a transformative industry trend. This advancement fundamentally reshapes operational efficiency and supply chain visibility across global markets.

  • The ubiquitous deployment of remote environmental sensors fundamentally transforms the operational baseline of the Primary Battery Market. Organizations increasingly demand lithium-iron disulfide variants to guarantee uninterrupted functionality across harsh climatic zones. This widespread technological transition effectively mitigates early component failure, improving overall system uptime by 26% when compared to legacy aqueous architectures.
  • As logistics operators integrate intelligent freight data loggers into maritime shipping lines, the necessity for robust zinc-manganese dioxide chemistry becomes paramount. Implementing these highly stable non-rechargeable power units reduces supply chain visibility gaps by over 30%, ensuring constant telemetry transmission.
  • Consequently, the rapid evolution of structural health monitoring directly causes a structural shift toward specialized pulse-discharge profiles, empowering modern enterprises to maintain seamless digital oversight without the financial burden of frequent hardware replacements.

What challenges does the Primary Battery Industry face during its growth?

  • The escalating proliferation of counterfeit primary battery cells presents a substantial structural challenge hindering overall industry growth and compromising operational safety.

  • The relentless proliferation of counterfeit energy products severely disrupts the supply chain integrity of the Primary Battery Market. Unauthorized manufacturing hubs frequently flood commercial channels with substandard zinc-air primary batteries that completely lack requisite pressure-relief safety valves. This critical structural deficiency directly causes catastrophic electrolyte leakage, subsequently increasing electronic hardware replacement costs for enterprise buyers by up to 19%.
  • Furthermore, navigating divergent regional trade policies regarding hazardous material transportation significantly inflates logistical overhead for legitimate manufacturers. Strict regulatory mandates enforcing the use of alkaline electrolyte solutions with zero heavy metal content slow down rapid distribution cycles.
  • Because extensive thermal testing is now mandatory for oceanic tracking buoys, cross-border shipping delays have worsened by 14%, severely complicating procurement forecasting for critical industrial applications.

Exclusive Technavio Analysis on Customer Landscape

The primary battery market forecasting report includes the adoption lifecycle of the market, covering from the innovator’s stage to the laggard’s stage. It focuses on adoption rates in different regions based on penetration. Furthermore, the primary battery market report also includes key purchase criteria and drivers of price sensitivity to help companies evaluate and develop their market growth analysis strategies.
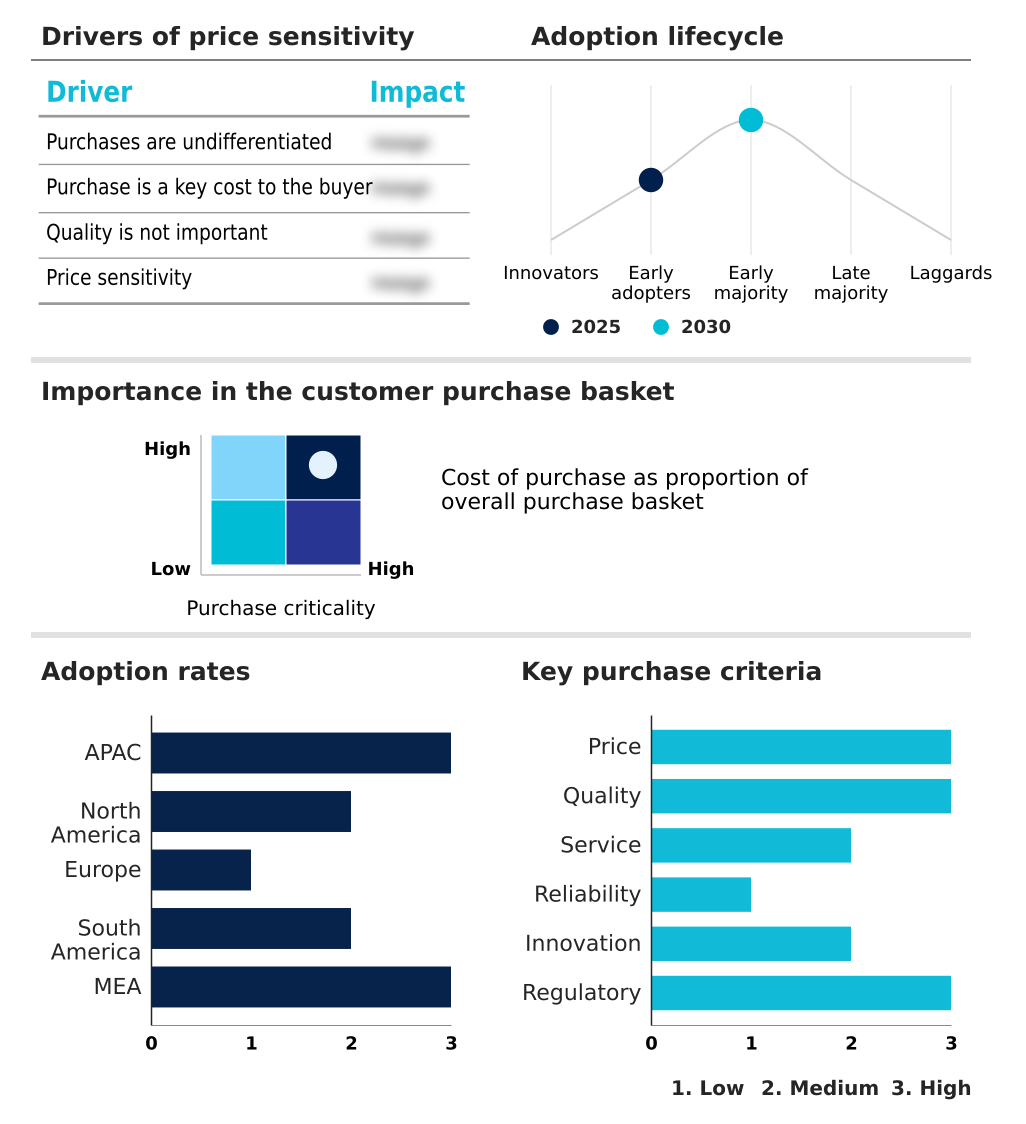
Customer Landscape of Primary Battery Industry

Competitive Landscape

Companies are implementing various strategies, such as strategic alliances, primary battery market forecast, partnerships, mergers and acquisitions, geographical expansion, and product/service launches, to enhance their presence in the industry.

Camelion Batteries GmbH - The portfolio includes a comprehensive range of non-rechargeable electrochemical solutions featuring specialized lithium coin cells, durable alkaline options, and high-performance silver-oxide power units designed for critical electronics.

The industry research and growth report includes detailed analyses of the competitive landscape of the market and information about key companies, including:

  • Camelion Batteries GmbH
  • EaglePicher Technologies LLC
  • Energizer Holdings Inc.
  • EVE Energy Co. Ltd.
  • Eveready Industries India Ltd.
  • FDK Corp.
  • Fujian Nanping Nanfu Battery
  • GP Batteries International Ltd.
  • Guangzhou Tianqiu Enterprise
  • Maxell Ltd.
  • Panasonic Holdings Corp.
  • Renata SA
  • Saft Groupe SAS
  • Shenzhen PKCELL Battery Co. Ltd.
  • Sunpadow
  • The Duracell Co.
  • Toshiba Corp.
  • Ultralife Corp.
  • VARTA AG
  • Zhejiang Mustang Battery
  • Zhejiang Yojiu Battery Co. Ltd.

Qualitative and quantitative analysis of companies has been conducted to help clients understand the wider business environment as well as the strengths and weaknesses of key industry players. Data is qualitatively analyzed to categorize companies as pure play, category-focused, industry-focused, and diversified; it is quantitatively analyzed to categorize companies as dominant, leading, strong, tentative, and weak.

Recent Development and News in Primary battery market

  • In the Renewable Electricity industry, the aggressive expansion of automated metering infrastructure for decentralized utility grids directly impacts Primary Battery demand by necessitating high volumetric energy density power units for continuous data transmission.
  • The adoption of low-power wide-area network protocols across offshore wind farm monitoring networks requires reliable micro-ampere standby power, driving the deployment of lithium thionyl chloride cells designed for sub-zero thermal stability.
  • Stringent environmental directives targeting hazardous material transportation in the energy sector mandate the use of mercury-free chemical compositions, forcing manufacturers to refine non-rechargeable electrochemical sources for remote environmental sensors.
  • The integration of smart grid deployment technologies with structural health monitoring systems relies on remote sensing nodes, increasing the consumption of specialized lithium-iron disulfide variants capable of flat discharge voltage curves without routine maintenance.

Dive into Technavio’s robust research methodology, blending expert interviews, extensive data synthesis, and validated models for unparalleled Primary Battery Market insights. See full methodology.

Market Scope
Page number 294
Base year 2025
Historic period 2020-2024
Forecast period 2026-2030
Growth momentum & CAGR Accelerate at a CAGR of 5.6%
Market growth 2026-2030 USD 6750.3 million
Market structure Fragmented
YoY growth 2025-2026(%) 5.3%
Key countries China, Japan, India, South Korea, Australia, Indonesia, US, Canada, Mexico, Germany, UK, France, Italy, Spain, The Netherlands, Brazil, Argentina, Chile, Saudi Arabia, UAE, South Africa, Israel and Turkey
Competitive landscape Leading Companies, Market Positioning of Companies, Competitive Strategies, and Industry Risks

Request Free Sample

Research Analyst Overview

  • The strategic procurement of non-rechargeable electrochemical sources represents a vital boardroom-level priority for enterprises managing extensive remote infrastructure. Corporate risk management heavily dictates the adoption of lithium thionyl chloride cells, ensuring that isolated asset trackers bypass the severe capacity fade inherent to secondary chemistries.
  • This operational pivot toward premium cell architectures has yielded a 35% reduction in unplanned maintenance downtime across expansive utility networks. Integrating hermetic glass-to-metal seals within these units actively prevents electrolyte leakage, safeguarding highly sensitive digital componentry from corrosive failure.
  • As industries deploy narrow-band internet of things devices, the necessity for batteries delivering optimal micro-ampere standby power punctuated by robust pulse-discharge profiles becomes critical for accurate data transmission. Furthermore, navigating evolving environmental regulations compels executive teams to prioritize mercury-free chemical compositions over legacy formats, aligning product strategy with global sustainability frameworks.
  • These distinct material advancements guarantee flat discharge voltage curves, establishing absolute operational dependability for both extreme industrial sensors and life-critical healthcare instruments operating outside the reach of traditional electrical grids.

What are the Key Data Covered in this Primary Battery Market Research and Growth Report?

  • What is the expected growth of the Primary Battery Market between 2026 and 2030?

    • USD 6.75 billion, at a CAGR of 5.6%

  • What segmentation does the market report cover?

    • The report is segmented by End-user (Defense, Medical, and Others), Type (Alkaline battery, Lithium battery, and Others), Distribution Channel (Offline, and Online) and Geography (APAC, North America, Europe, South America, Middle East and Africa)

  • Which regions are analyzed in the report?

    • APAC, North America, Europe, South America and Middle East and Africa

  • What are the key growth drivers and market challenges?

    • Worldwide rollout of smart utility metering infrastructure, Proliferation of counterfeit primary battery cells

  • Who are the major players in the Primary Battery Market?

    • Camelion Batteries GmbH, EaglePicher Technologies LLC, Energizer Holdings Inc., EVE Energy Co. Ltd., Eveready Industries India Ltd., FDK Corp., Fujian Nanping Nanfu Battery, GP Batteries International Ltd., Guangzhou Tianqiu Enterprise, Maxell Ltd., Panasonic Holdings Corp., Renata SA, Saft Groupe SAS, Shenzhen PKCELL Battery Co. Ltd., Sunpadow, The Duracell Co., Toshiba Corp., Ultralife Corp., VARTA AG, Zhejiang Mustang Battery and Zhejiang Yojiu Battery Co. Ltd.

Market Research Insights

  • The continuous evolution of the Primary Battery Market heavily relies on the expansion of smart home ecosystems and decentralized utility grids. Deploying digital hearing aids and precision analog watches necessitates advanced power architectures that offer unparalleled reliability. Upgrading to specialized non-rechargeable power sources has enhanced the operational lifespan of remote environmental sensors by 35% compared to legacy alkaline iterations.
  • Furthermore, the integration of high-performance cells into wearable health patches has reduced premature power depletion incidents by 22%, vastly improving patient monitoring outcomes. The structural shift toward automated toll collection frameworks further solidifies the need for robust standby power, ensuring uninterrupted systemic efficiency across harsh operational environments without costly maintenance interventions.

We can help! Our analysts can customize this primary battery market research report to meet your requirements.

Get in touch

1. Executive Summary

1.1 Market overview

Executive Summary - Chart on Market Overview
Executive Summary - Data Table on Market Overview
Executive Summary - Chart on Global Market Characteristics
Executive Summary - Chart on Market by Geography
Executive Summary - Chart on Market Segmentation by End-user
Executive Summary - Chart on Market Segmentation by Type
Executive Summary - Chart on Market Segmentation by Distribution Channel
Executive Summary - Chart on Incremental Growth
Executive Summary - Data Table on Incremental Growth
Executive Summary - Chart on Company Market Positioning

2. Technavio Analysis

2.1 Analysis of price sensitivity, lifecycle, customer purchase basket, adoption rates, and purchase criteria

2.2 Criticality of inputs and Factors of differentiation

Chart on Overview on criticality of inputs and factors of differentiation

2.3 Factors of disruption

Chart on Overview on factors of disruption

2.4 Impact of drivers and challenges

Chart on Impact of drivers and challenges in 2025 and 2030

3. Market Landscape

3.1 Market ecosystem

Chart on Parent Market
Data Table on - Parent Market

3.2 Market characteristics

Chart on Market characteristics analysis

3.3 Value chain analysis

Chart on Value chain analysis

4. Market Sizing

4.1 Market definition

Data Table on Offerings of companies included in the market definition

4.2 Market segment analysis

Market segments

4.3 Market size 2025

4.4 Market outlook: Forecast for 2025-2030

Chart on Global - Market size and forecast 2025-2030 ($ million)
Data Table on Global - Market size and forecast 2025-2030 ($ million)
Chart on Global Market: Year-over-year growth 2025-2030 (%)
Data Table on Global Market: Year-over-year growth 2025-2030 (%)

5. Historic Market Size

5.1 Global Primary Battery Market 2020 - 2024

Historic Market Size - Data Table on Global Primary Battery Market 2020 - 2024 ($ million)

5.2 End-user segment analysis 2020 - 2024

Historic Market Size - End-user Segment 2020 - 2024 ($ million)

5.3 Type segment analysis 2020 - 2024

Historic Market Size - Type Segment 2020 - 2024 ($ million)

5.4 Distribution Channel segment analysis 2020 - 2024

Historic Market Size - Distribution Channel Segment 2020 - 2024 ($ million)

5.5 Geography segment analysis 2020 - 2024

Historic Market Size - Geography Segment 2020 - 2024 ($ million)

5.6 Country segment analysis 2020 - 2024

Historic Market Size - Country Segment 2020 - 2024 ($ million)

6. Qualitative Analysis

6.1 Impact of AI on Global Primary Battery Market

6.2 Impact of geopolitical conflicts on Global Primary Battery Market

7. Five Forces Analysis

7.1 Five forces summary

Five forces analysis - Comparison between 2025 and 2030

7.2 Bargaining power of buyers

Bargaining power of buyers - Impact of key factors 2025 and 2030

7.3 Bargaining power of suppliers

Bargaining power of suppliers - Impact of key factors in 2025 and 2030

7.4 Threat of new entrants

Threat of new entrants - Impact of key factors in 2025 and 2030

7.5 Threat of substitutes

Threat of substitutes - Impact of key factors in 2025 and 2030

7.6 Threat of rivalry

Threat of rivalry - Impact of key factors in 2025 and 2030

7.7 Market condition

Chart on Market condition - Five forces 2025 and 2030

8. Market Segmentation by End-user

8.1 Market segments

Chart on End-user - Market share 2025-2030 (%)
Data Table on End-user - Market share 2025-2030 (%)

8.2 Comparison by End-user

Chart on Comparison by End-user
Data Table on Comparison by End-user

8.3 Defense - Market size and forecast 2025-2030

Chart on Defense - Market size and forecast 2025-2030 ($ million)
Data Table on Defense - Market size and forecast 2025-2030 ($ million)
Chart on Defense - Year-over-year growth 2025-2030 (%)
Data Table on Defense - Year-over-year growth 2025-2030 (%)

8.4 Medical - Market size and forecast 2025-2030

Chart on Medical - Market size and forecast 2025-2030 ($ million)
Data Table on Medical - Market size and forecast 2025-2030 ($ million)
Chart on Medical - Year-over-year growth 2025-2030 (%)
Data Table on Medical - Year-over-year growth 2025-2030 (%)

8.5 Others - Market size and forecast 2025-2030

Chart on Others - Market size and forecast 2025-2030 ($ million)
Data Table on Others - Market size and forecast 2025-2030 ($ million)
Chart on Others - Year-over-year growth 2025-2030 (%)
Data Table on Others - Year-over-year growth 2025-2030 (%)

8.6 Market opportunity by End-user

Market opportunity by End-user ($ million)
Data Table on Market opportunity by End-user ($ million)

9. Market Segmentation by Type

9.1 Market segments

Chart on Type - Market share 2025-2030 (%)
Data Table on Type - Market share 2025-2030 (%)

9.2 Comparison by Type

Chart on Comparison by Type
Data Table on Comparison by Type

9.3 Alkaline battery - Market size and forecast 2025-2030

Chart on Alkaline battery - Market size and forecast 2025-2030 ($ million)
Data Table on Alkaline battery - Market size and forecast 2025-2030 ($ million)
Chart on Alkaline battery - Year-over-year growth 2025-2030 (%)
Data Table on Alkaline battery - Year-over-year growth 2025-2030 (%)

9.4 Lithium battery - Market size and forecast 2025-2030

Chart on Lithium battery - Market size and forecast 2025-2030 ($ million)
Data Table on Lithium battery - Market size and forecast 2025-2030 ($ million)
Chart on Lithium battery - Year-over-year growth 2025-2030 (%)
Data Table on Lithium battery - Year-over-year growth 2025-2030 (%)

9.5 Others - Market size and forecast 2025-2030

Chart on Others - Market size and forecast 2025-2030 ($ million)
Data Table on Others - Market size and forecast 2025-2030 ($ million)
Chart on Others - Year-over-year growth 2025-2030 (%)
Data Table on Others - Year-over-year growth 2025-2030 (%)

9.6 Market opportunity by Type

Market opportunity by Type ($ million)
Data Table on Market opportunity by Type ($ million)

10. Market Segmentation by Distribution Channel

10.1 Market segments

Chart on Distribution Channel - Market share 2025-2030 (%)
Data Table on Distribution Channel - Market share 2025-2030 (%)

10.2 Comparison by Distribution Channel

Chart on Comparison by Distribution Channel
Data Table on Comparison by Distribution Channel

10.3 Offline - Market size and forecast 2025-2030

Chart on Offline - Market size and forecast 2025-2030 ($ million)
Data Table on Offline - Market size and forecast 2025-2030 ($ million)
Chart on Offline - Year-over-year growth 2025-2030 (%)
Data Table on Offline - Year-over-year growth 2025-2030 (%)

10.4 Online - Market size and forecast 2025-2030

Chart on Online - Market size and forecast 2025-2030 ($ million)
Data Table on Online - Market size and forecast 2025-2030 ($ million)
Chart on Online - Year-over-year growth 2025-2030 (%)
Data Table on Online - Year-over-year growth 2025-2030 (%)

10.5 Market opportunity by Distribution Channel

Market opportunity by Distribution Channel ($ million)
Data Table on Market opportunity by Distribution Channel ($ million)

11. Customer Landscape

11.1 Customer landscape overview

Analysis of price sensitivity, lifecycle, customer purchase basket, adoption rates, and purchase criteria

12. Geographic Landscape

12.1 Geographic segmentation

Chart on Market share by geography 2025-2030 (%)
Data Table on Market share by geography 2025-2030 (%)

12.2 Geographic comparison

Chart on Geographic comparison
Data Table on Geographic comparison

12.3 APAC - Market size and forecast 2025-2030

Chart on APAC - Market size and forecast 2025-2030 ($ million)
Data Table on APAC - Market size and forecast 2025-2030 ($ million)
Chart on APAC - Year-over-year growth 2025-2030 (%)
Data Table on APAC - Year-over-year growth 2025-2030 (%)
Chart on Regional Comparison - APAC
Data Table on Regional Comparison - APAC

12.3.1 China - Market size and forecast 2025-2030

Chart on China - Market size and forecast 2025-2030 ($ million)
Data Table on China - Market size and forecast 2025-2030 ($ million)
Chart on China - Year-over-year growth 2025-2030 (%)
Data Table on China - Year-over-year growth 2025-2030 (%)

12.3.2 Japan - Market size and forecast 2025-2030

Chart on Japan - Market size and forecast 2025-2030 ($ million)
Data Table on Japan - Market size and forecast 2025-2030 ($ million)
Chart on Japan - Year-over-year growth 2025-2030 (%)
Data Table on Japan - Year-over-year growth 2025-2030 (%)

12.3.3 India - Market size and forecast 2025-2030

Chart on India - Market size and forecast 2025-2030 ($ million)
Data Table on India - Market size and forecast 2025-2030 ($ million)
Chart on India - Year-over-year growth 2025-2030 (%)
Data Table on India - Year-over-year growth 2025-2030 (%)

12.3.4 South Korea - Market size and forecast 2025-2030

Chart on South Korea - Market size and forecast 2025-2030 ($ million)
Data Table on South Korea - Market size and forecast 2025-2030 ($ million)
Chart on South Korea - Year-over-year growth 2025-2030 (%)
Data Table on South Korea - Year-over-year growth 2025-2030 (%)

12.3.5 Australia - Market size and forecast 2025-2030

Chart on Australia - Market size and forecast 2025-2030 ($ million)
Data Table on Australia - Market size and forecast 2025-2030 ($ million)
Chart on Australia - Year-over-year growth 2025-2030 (%)
Data Table on Australia - Year-over-year growth 2025-2030 (%)

12.3.6 Indonesia - Market size and forecast 2025-2030

Chart on Indonesia - Market size and forecast 2025-2030 ($ million)
Data Table on Indonesia - Market size and forecast 2025-2030 ($ million)
Chart on Indonesia - Year-over-year growth 2025-2030 (%)
Data Table on Indonesia - Year-over-year growth 2025-2030 (%)

12.4 North America - Market size and forecast 2025-2030

Chart on North America - Market size and forecast 2025-2030 ($ million)
Data Table on North America - Market size and forecast 2025-2030 ($ million)
Chart on North America - Year-over-year growth 2025-2030 (%)
Data Table on North America - Year-over-year growth 2025-2030 (%)
Chart on Regional Comparison - North America
Data Table on Regional Comparison - North America

12.4.1 US - Market size and forecast 2025-2030

Chart on US - Market size and forecast 2025-2030 ($ million)
Data Table on US - Market size and forecast 2025-2030 ($ million)
Chart on US - Year-over-year growth 2025-2030 (%)
Data Table on US - Year-over-year growth 2025-2030 (%)

12.4.2 Canada - Market size and forecast 2025-2030

Chart on Canada - Market size and forecast 2025-2030 ($ million)
Data Table on Canada - Market size and forecast 2025-2030 ($ million)
Chart on Canada - Year-over-year growth 2025-2030 (%)
Data Table on Canada - Year-over-year growth 2025-2030 (%)

12.4.3 Mexico - Market size and forecast 2025-2030

Chart on Mexico - Market size and forecast 2025-2030 ($ million)
Data Table on Mexico - Market size and forecast 2025-2030 ($ million)
Chart on Mexico - Year-over-year growth 2025-2030 (%)
Data Table on Mexico - Year-over-year growth 2025-2030 (%)

12.5 Europe - Market size and forecast 2025-2030

Chart on Europe - Market size and forecast 2025-2030 ($ million)
Data Table on Europe - Market size and forecast 2025-2030 ($ million)
Chart on Europe - Year-over-year growth 2025-2030 (%)
Data Table on Europe - Year-over-year growth 2025-2030 (%)
Chart on Regional Comparison - Europe
Data Table on Regional Comparison - Europe

12.5.1 Germany - Market size and forecast 2025-2030

Chart on Germany - Market size and forecast 2025-2030 ($ million)
Data Table on Germany - Market size and forecast 2025-2030 ($ million)
Chart on Germany - Year-over-year growth 2025-2030 (%)
Data Table on Germany - Year-over-year growth 2025-2030 (%)

12.5.2 UK - Market size and forecast 2025-2030

Chart on UK - Market size and forecast 2025-2030 ($ million)
Data Table on UK - Market size and forecast 2025-2030 ($ million)
Chart on UK - Year-over-year growth 2025-2030 (%)
Data Table on UK - Year-over-year growth 2025-2030 (%)

12.5.3 France - Market size and forecast 2025-2030

Chart on France - Market size and forecast 2025-2030 ($ million)
Data Table on France - Market size and forecast 2025-2030 ($ million)
Chart on France - Year-over-year growth 2025-2030 (%)
Data Table on France - Year-over-year growth 2025-2030 (%)

12.5.4 Italy - Market size and forecast 2025-2030

Chart on Italy - Market size and forecast 2025-2030 ($ million)
Data Table on Italy - Market size and forecast 2025-2030 ($ million)
Chart on Italy - Year-over-year growth 2025-2030 (%)
Data Table on Italy - Year-over-year growth 2025-2030 (%)

12.5.5 Spain - Market size and forecast 2025-2030

Chart on Spain - Market size and forecast 2025-2030 ($ million)
Data Table on Spain - Market size and forecast 2025-2030 ($ million)
Chart on Spain - Year-over-year growth 2025-2030 (%)
Data Table on Spain - Year-over-year growth 2025-2030 (%)

12.5.6 The Netherlands - Market size and forecast 2025-2030

Chart on The Netherlands - Market size and forecast 2025-2030 ($ million)
Data Table on The Netherlands - Market size and forecast 2025-2030 ($ million)
Chart on The Netherlands - Year-over-year growth 2025-2030 (%)
Data Table on The Netherlands - Year-over-year growth 2025-2030 (%)

12.6 South America - Market size and forecast 2025-2030

Chart on South America - Market size and forecast 2025-2030 ($ million)
Data Table on South America - Market size and forecast 2025-2030 ($ million)
Chart on South America - Year-over-year growth 2025-2030 (%)
Data Table on South America - Year-over-year growth 2025-2030 (%)
Chart on Regional Comparison - South America
Data Table on Regional Comparison - South America

12.6.1 Brazil - Market size and forecast 2025-2030

Chart on Brazil - Market size and forecast 2025-2030 ($ million)
Data Table on Brazil - Market size and forecast 2025-2030 ($ million)
Chart on Brazil - Year-over-year growth 2025-2030 (%)
Data Table on Brazil - Year-over-year growth 2025-2030 (%)

12.6.2 Argentina - Market size and forecast 2025-2030

Chart on Argentina - Market size and forecast 2025-2030 ($ million)
Data Table on Argentina - Market size and forecast 2025-2030 ($ million)
Chart on Argentina - Year-over-year growth 2025-2030 (%)
Data Table on Argentina - Year-over-year growth 2025-2030 (%)

12.6.3 Chile - Market size and forecast 2025-2030

Chart on Chile - Market size and forecast 2025-2030 ($ million)
Data Table on Chile - Market size and forecast 2025-2030 ($ million)
Chart on Chile - Year-over-year growth 2025-2030 (%)
Data Table on Chile - Year-over-year growth 2025-2030 (%)

12.7 Middle East and Africa - Market size and forecast 2025-2030

Chart on Middle East and Africa - Market size and forecast 2025-2030 ($ million)
Data Table on Middle East and Africa - Market size and forecast 2025-2030 ($ million)
Chart on Middle East and Africa - Year-over-year growth 2025-2030 (%)
Data Table on Middle East and Africa - Year-over-year growth 2025-2030 (%)
Chart on Regional Comparison - Middle East and Africa
Data Table on Regional Comparison - Middle East and Africa

12.7.1 Saudi Arabia - Market size and forecast 2025-2030

Chart on Saudi Arabia - Market size and forecast 2025-2030 ($ million)
Data Table on Saudi Arabia - Market size and forecast 2025-2030 ($ million)
Chart on Saudi Arabia - Year-over-year growth 2025-2030 (%)
Data Table on Saudi Arabia - Year-over-year growth 2025-2030 (%)

12.7.2 UAE - Market size and forecast 2025-2030

Chart on UAE - Market size and forecast 2025-2030 ($ million)
Data Table on UAE - Market size and forecast 2025-2030 ($ million)
Chart on UAE - Year-over-year growth 2025-2030 (%)
Data Table on UAE - Year-over-year growth 2025-2030 (%)

12.7.3 South Africa - Market size and forecast 2025-2030

Chart on South Africa - Market size and forecast 2025-2030 ($ million)
Data Table on South Africa - Market size and forecast 2025-2030 ($ million)
Chart on South Africa - Year-over-year growth 2025-2030 (%)
Data Table on South Africa - Year-over-year growth 2025-2030 (%)

12.7.4 Israel - Market size and forecast 2025-2030

Chart on Israel - Market size and forecast 2025-2030 ($ million)
Data Table on Israel - Market size and forecast 2025-2030 ($ million)
Chart on Israel - Year-over-year growth 2025-2030 (%)
Data Table on Israel - Year-over-year growth 2025-2030 (%)

12.7.5 Turkey - Market size and forecast 2025-2030

Chart on Turkey - Market size and forecast 2025-2030 ($ million)
Data Table on Turkey - Market size and forecast 2025-2030 ($ million)
Chart on Turkey - Year-over-year growth 2025-2030 (%)
Data Table on Turkey - Year-over-year growth 2025-2030 (%)

12.8 Market opportunity by geography

Market opportunity by geography ($ million)
Data Tables on Market opportunity by geography ($ million)

13. Drivers, Challenges, and Opportunity

13.1 Market drivers

Worldwide rollout of smart utility metering infrastructure
Accelerated deployment of advanced consumer smart electronics
Growth in environmental sensing and asset tracking logistics

13.2 Market challenges

Proliferation of counterfeit primary battery cells
Navigating evolving regional trade policy barriers
Escalating logistics and hazmat transportation overhead

13.3 Impact of drivers and challenges

Impact of drivers and challenges in 2025 and 2030

13.4 Market opportunities

Automated asset tracking in logistics
Integration of military soldier systems
Growth in hearing aid instrumentation

14. Competitive Landscape

14.1 Overview

14.2

Overview on criticality of inputs and factors of differentiation

14.3 Landscape disruption

Overview on factors of disruption

14.4 Industry risks

Impact of key risks on business

15. Competitive Analysis

15.1 Companies profiled

Companies covered

15.2 Company ranking index

15.3 Market positioning of companies

Matrix on companies position and classification

15.4 Camelion Batteries GmbH

Camelion Batteries GmbH - Overview
Camelion Batteries GmbH - Product / Service
Camelion Batteries GmbH - Key offerings
SWOT

15.5 EaglePicher Technologies LLC

EaglePicher Technologies LLC - Overview
EaglePicher Technologies LLC - Product / Service
EaglePicher Technologies LLC - Key offerings
SWOT

15.6 Energizer Holdings Inc.

Energizer Holdings Inc. - Overview
Energizer Holdings Inc. - Business segments
Energizer Holdings Inc. - Key offerings
Energizer Holdings Inc. - Segment focus
SWOT

15.7 EVE Energy Co. Ltd.

EVE Energy Co. Ltd. - Overview
EVE Energy Co. Ltd. - Business segments
EVE Energy Co. Ltd. - Key offerings
EVE Energy Co. Ltd. - Segment focus
SWOT

15.8 Eveready Industries India Ltd.

Eveready Industries India Ltd. - Overview
Eveready Industries India Ltd. - Product / Service
Eveready Industries India Ltd. - Key offerings
SWOT

15.9 FDK Corp.

FDK Corp. - Overview
FDK Corp. - Product / Service
FDK Corp. - Key offerings
SWOT

15.10 Fujian Nanping Nanfu Battery

Fujian Nanping Nanfu Battery - Overview
Fujian Nanping Nanfu Battery - Product / Service
Fujian Nanping Nanfu Battery - Key offerings
SWOT

15.11 GP Batteries International Ltd.

GP Batteries International Ltd. - Overview
GP Batteries International Ltd. - Product / Service
GP Batteries International Ltd. - Key offerings
SWOT

15.12 Guangzhou Tianqiu Enterprise

Guangzhou Tianqiu Enterprise - Overview
Guangzhou Tianqiu Enterprise - Product / Service
Guangzhou Tianqiu Enterprise - Key offerings
SWOT

15.13 Maxell Ltd.

Maxell Ltd. - Overview
Maxell Ltd. - Business segments
Maxell Ltd. - Key offerings
Maxell Ltd. - Segment focus
SWOT

15.14 Panasonic Holdings Corp.

Panasonic Holdings Corp. - Overview
Panasonic Holdings Corp. - Business segments
Panasonic Holdings Corp. - Key news
Panasonic Holdings Corp. - Key offerings
Panasonic Holdings Corp. - Segment focus
SWOT

15.15 The Duracell Co.

The Duracell Co. - Overview
The Duracell Co. - Product / Service
The Duracell Co. - Key offerings
SWOT

15.16 Toshiba Corp.

Toshiba Corp. - Overview
Toshiba Corp. - Product / Service
Toshiba Corp. - Key offerings
SWOT

15.17 Ultralife Corp.

Ultralife Corp. - Overview
Ultralife Corp. - Business segments
Ultralife Corp. - Key offerings
Ultralife Corp. - Segment focus
SWOT

15.18 Zhejiang Mustang Battery

Zhejiang Mustang Battery - Overview
Zhejiang Mustang Battery - Product / Service
Zhejiang Mustang Battery - Key offerings
SWOT

16. Appendix

16.1 Scope of the report

Market definition
Objectives
Notes and caveats

16.2 Inclusions and exclusions checklist

Inclusions checklist
Exclusions checklist

16.3 Currency conversion rates for US$

16.4 Research methodology

16.5 Data procurement

Information sources

16.6 Data validation

16.7 Validation techniques employed for market sizing

16.8 Data synthesis

16.9 360 degree market analysis

16.10 List of abbreviations

Research Methodology

Technavio presents a detailed picture of the market by way of study, synthesis, and summation of data from multiple sources. The analysts have presented the various facets of the market with a particular focus on identifying the key industry influencers. The data thus presented is comprehensive, reliable, and the result of extensive research, both primary and secondary.

INFORMATION SOURCES

Primary sources

  • Manufacturers and suppliers
  • Channel partners
  • Industry experts
  • Strategic decision makers

Secondary sources

  • Industry journals and periodicals
  • Government data
  • Financial reports of key industry players
  • Historical data
  • Press releases

DATA ANALYSIS

Data Synthesis

  • Collation of data
  • Estimation of key figures
  • Analysis of derived insights

Data Validation

  • Triangulation with data models
  • Reference against proprietary databases
  • Corroboration with industry experts

REPORT WRITING

Qualitative

  • Market drivers
  • Market challenges
  • Market trends
  • Five forces analysis

Quantitative

  • Market size and forecast
  • Market segmentation
  • Geographical insights
  • Competitive landscape

Interested in this report?

Get your sample now to see our research methodology and insights!

Download Now

Frequently Asked Questions

Primary Battery market growth will increase by USD 6750.3 million during 2026-2030.

The Primary Battery market is expected to grow at a CAGR of 5.6% during 2026-2030.

Primary Battery market is segmented by End-user (Defense, Medical, Others) Type (Alkaline battery, Lithium battery, Others) Distribution channel (Offline, Online)

Camelion Batteries GmbH, EaglePicher Technologies LLC, Energizer Holdings Inc., EVE Energy Co. Ltd., Eveready Industries India Ltd., FDK Corp., Fujian Nanping Nanfu Battery, GP Batteries International Ltd., Guangzhou Tianqiu Enterprise, Maxell Ltd., Panasonic Holdings Corp., Renata SA, Saft Groupe SAS, Shenzhen PKCELL Battery Co. Ltd., Sunpadow, The Duracell Co., Toshiba Corp., Ultralife Corp., VARTA AG, Zhejiang Mustang Battery, Zhejiang Yojiu Battery Co. Ltd. are a few of the key vendors in the Primary Battery market.

APAC will register the highest growth rate of 36.4% among the other regions. Therefore, the Primary Battery market in APAC is expected to garner significant business opportunities for the vendors during the forecast period.

China, Japan, India, South Korea, Australia, Indonesia, US, Canada, Mexico, Germany, UK, France, Italy, Spain, The Netherlands, Brazil, Argentina, Chile, Saudi Arabia, UAE, South Africa, Israel, Turkey

  • Worldwide rollout of smart utility metering infrastructure is the driving factor this market.

The Primary Battery market vendors should focus on grabbing business opportunities from the End-user segment as it accounted for the largest market share in the base year.
RIA - Research AI Assistant
Ask RIA
