Printed Circuit Board (PCB) Market Analysis, Size, and Forecast 2026-2030: APAC (China, India, and Japan), North America (US, Canada, and Mexico), Europe (Germany, UK, and France), Middle East and Africa (UAE, Saudi Arabia, and South Africa), South America (Brazil and Argentina), and Rest of World (ROW)

Printed Circuit Board (PCB) Market Analysis, Size, and Forecast 2026-2030:
APAC (China, India, and Japan), North America (US, Canada, and Mexico), Europe (Germany, UK, and France), Middle East and Africa (UAE, Saudi Arabia, and South Africa), South America (Brazil and Argentina), and Rest of World (ROW)

Published: May 2026 311 Pages SKU: IRTNTR43572

Market Overview at a Glance

$28.57 B
Market Opportunity
6.2%
CAGR 2025 - 2030
88.4%
APAC Growth
$25.86 B
Multi-layer segment 2024

Printed Circuit Board (PCB) Market Size 2026-2030

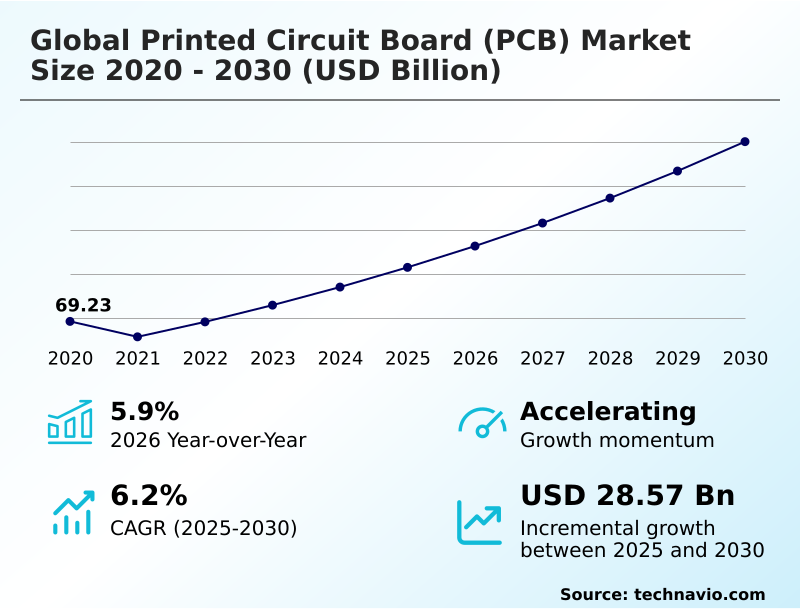
The printed circuit board (pcb) market size is valued to increase by USD 28.57 billion, at a CAGR of 6.2% from 2025 to 2030. Proliferation of AI and high-performance computing infrastructure will drive the printed circuit board (pcb) market.

Major Market Trends & Insights

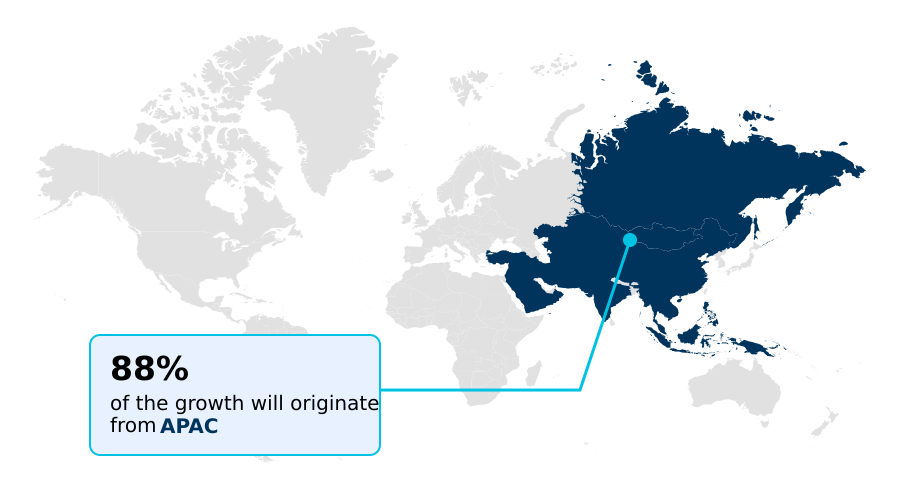
  • APAC dominated the market and accounted for a 88.4% growth during the forecast period.
  • By Type - Multi-layer segment was valued at USD 25.86 billion in 2024
  • By End-user - Communication network infrastructure segment accounted for the largest market revenue share in 2024

Market Size & Forecast

  • Market Opportunities: USD 40.85 billion
  • Market Future Opportunities: USD 28.57 billion
  • CAGR from 2025 to 2030 : 6.2%

Market Summary

  • The Printed Circuit Board (PCB) market serves as the physical backbone of the digital world, undergoing a profound transformation driven by the insatiable demand for smaller, faster, and more powerful electronics. This evolution is most evident in the push toward miniaturization and higher performance, necessitating the adoption of advanced technologies like high-density interconnect and multi-layer boards.
  • These innovations are critical for emerging sectors such as artificial intelligence, 5G telecommunications, and automotive electrification, where complex circuitry must manage high-speed data and significant thermal loads within compact spaces. For instance, a manufacturer of autonomous vehicle systems must navigate a complex supply chain to source specialized rigid-flex circuits and heavy copper boards that meet stringent reliability standards.
  • This requires sophisticated inventory management to mitigate risks from commodity pricing volatility and ensure a steady supply of low-loss laminates. Simultaneously, the industry faces the challenge of integrating sustainable electronics manufacturing practices, balancing high-tech production with environmental responsibility. The convergence of these factors creates a dynamic environment where technical innovation and strategic sourcing are paramount for success.

What will be the Size of the Printed Circuit Board (PCB) Market during the forecast period?

Get Key Insights on Market Forecast (PDF) Request Free Sample

How is the Printed Circuit Board (PCB) Market Segmented?

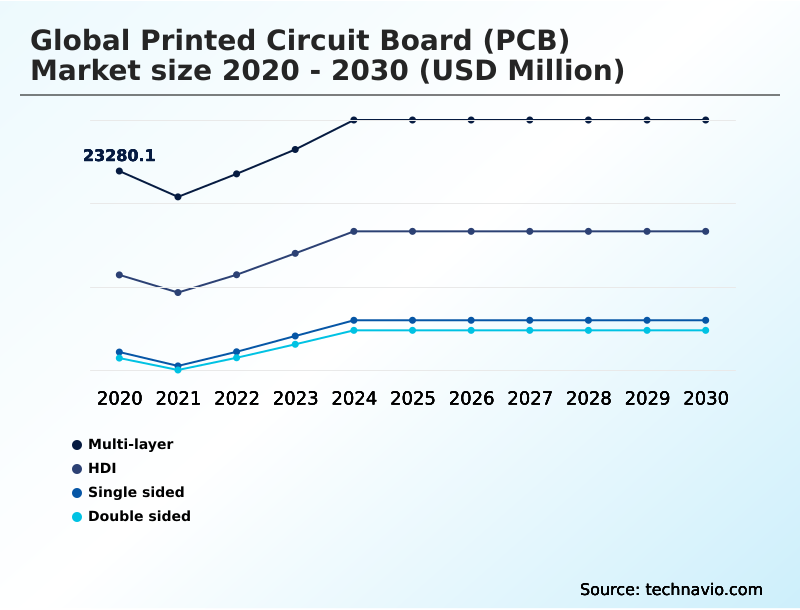
The printed circuit board (pcb) industry research report provides comprehensive data (region-wise segment analysis), with forecasts and estimates in "USD million" for the period 2026-2030, as well as historical data from 2020-2024 for the following segments.

  • Type
    • Multi-layer
    • HDI
    • Single sided
    • Double sided
  • End-user
    • Communication network infrastructure
    • IT and peripherals
    • Automotive
    • Consumer electronics
    • Others
  • Component
    • Integrated circuits
    • Capacitors
    • Resistors
    • Diodes
    • Others
  • Geography
    • APAC
      • China
      • India
      • Japan
    • North America
      • US
      • Canada
      • Mexico
    • Europe
      • Germany
      • UK
      • France
    • Middle East and Africa
      • UAE
      • Saudi Arabia
      • South Africa
    • South America
      • Brazil
      • Argentina
    • Rest of World (ROW)

By Type Insights

The multi-layer segment is estimated to witness significant growth during the forecast period.

The multi-layer segment is foundational to sophisticated electronic systems, supporting the digital infrastructure expansion and the evolution of telecommunications hardware.

These advanced multi-layer boards are indispensable for high-performance computing ecosystems and advanced driver-assistance systems, where compact design and robust thermal management are critical.

The shift towards sustainable electronics manufacturing is influencing material choices, while the demand for superior signal integrity in high-speed applications is driving innovation. As automotive electrification integration accelerates, the complexity of these boards increases.

The adoption of advanced production techniques, enhancing z-axis connectivity, has improved production yields for high-aspect-ratio designs by over 12%.

This ongoing development ensures multi-layer solutions, including high-density interconnect and substrate-like PCB formats, meet the needs of 5G-advanced infrastructure and sovereign cloud infrastructure.

Request Free Sample

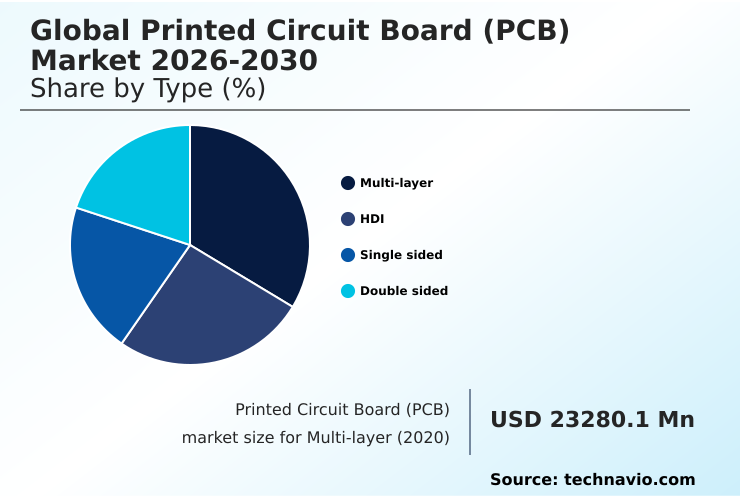
The Multi-layer segment was valued at USD 25.86 billion in 2024 and showed a gradual increase during the forecast period.

Request Free Sample

Regional Analysis

APAC is estimated to contribute 88.4% to the growth of the global market during the forecast period.Technavio’s analysts have elaborately explained the regional trends and drivers that shape the market during the forecast period.

See How Printed Circuit Board (PCB) Market Demand is Rising in APAC Request Free Sample

The market's geographic landscape is dominated by APAC, which serves as the global manufacturing hub, though North America and Europe are registering higher growth rates of 7.0% and 7.2% respectively, compared to APAC's 6.1%.

North America focuses on high-reliability applications, while Europe leads in industrial and automotive sectors, emphasizing green manufacturing processes and regulatory compliance mandates. This regional specialization creates a complex global supply chain where precision engineering bottlenecks can arise.

Key technologies like flip-chip ball grid array packaging and rigid-flex circuits are seeing investment globally. However, sourcing advanced materials like ceramic-based substrates and low-loss laminates is subject to commodity pricing volatility.

Advanced packaging strategies, including heterogeneous integration, are being developed to overcome these challenges, with automated optical inspection improving yields by over 20% in advanced facilities.

Market Dynamics

Our researchers analyzed the data with 2025 as the base year, along with the key drivers, trends, and challenges. A holistic analysis of drivers will help companies refine their marketing strategies to gain a competitive advantage.

  • The strategic implementation of advanced PCB technologies is reshaping product development across high-value sectors. The use of high-density interconnect for AI accelerators is no longer a niche requirement but a standard for achieving the necessary computational density, while the design of a multi-layer PCB for automotive electronics has become a core competency for ensuring vehicle safety and performance.
  • The choice of a specific substrate for high-speed data transmission directly impacts the functionality of next-generation networking equipment, where signal integrity for 224 Gbps signaling is a critical benchmark. In parallel, innovations in thermal management in power electronics are enabling more efficient PCB design for electric vehicle powertrains.
  • The fabrication process itself is evolving; microvia fabrication for 5G hardware is essential for connectivity, while automated optical inspection for zero-defect manufacturing is crucial for producing reliable medical devices using rigid-flex PCB technology. Furthermore, the industry is balancing performance with responsibility. Sustainable PCB manufacturing practices are being integrated alongside the development of ceramic substrates for high-power applications.
  • Adhering to regulatory compliance in the electronics supply chain is as critical as mastering the technical challenges of flip-chip BGA for server processors or the material procurement for high-performance PCBs.

What are the key market drivers leading to the rise in the adoption of Printed Circuit Board (PCB) Industry?

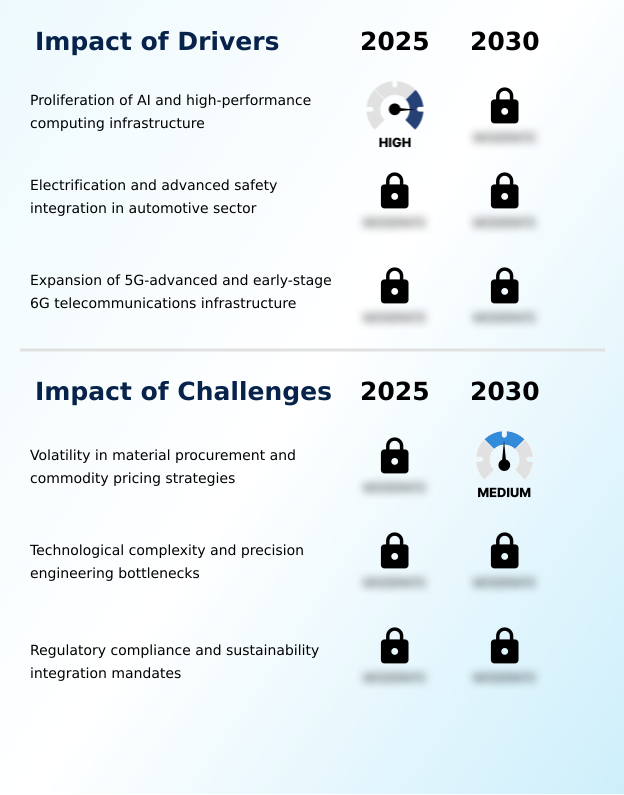
  • The proliferation of artificial intelligence and high-performance computing infrastructure serves as a primary driver for market expansion.

  • Market growth is fundamentally driven by the need for high-speed networking equipment and critical electronic components for next-generation infrastructure. The expansion of 5G and 6G networks necessitates precision microvia technology and any-layer HDI boards made with halogen-free materials.
  • The automotive sector's shift to electric vehicles fuels demand for bio-based resin substrates and designs that adhere to circular economy frameworks.
  • In data centers, the adoption of the advanced memory module standard requires more complex boards with energy-efficient circuit designs and high-frequency embedding technology.
  • Compliance with new regulations, such as those requiring digital product passports and digital tracking for waste shipments, is also spurring innovation. Implementing these technologies has led to a 20% reduction in material waste for compliant manufacturers.

What are the market trends shaping the Printed Circuit Board (PCB) Industry?

  • A global transition toward high-density interconnect and AI-accelerated substrates defines the market's trajectory, driven by the demand for advanced computing power and hardware miniaturization.

  • The market is undergoing a significant transformation driven by the adoption of miniaturized electronics design and the expansion of hyperscale data center components. Key trends include the shift toward advanced substrate solutions and high-frequency circuit materials to support next-generation server-grade processors and high-reliability applications in aerospace and defense.
  • The proliferation of embedded component technology and sophisticated semiconductor packaging is enabling more powerful devices in smaller form factors. This evolution requires substantial investment in domestic fabrication capacities and advanced manufacturing techniques, such as laser direct imaging and surface mount technology.
  • The integration of power electronics into IC substrates has improved energy efficiency in certain applications by up to 10%, while specialized designs for industrial automation reduce system failure rates by 15%.

What challenges does the Printed Circuit Board (PCB) Industry face during its growth?

  • Volatility in material procurement and fluctuating commodity prices present a significant challenge to the industry's growth and stability.

  • The industry faces significant challenges from manufacturing complexity and supply chain vulnerabilities. Developing high-layer-count backplanes and flip-chip ball grid array substrates for AI servers requires massive capital investment and secure manufacturing processes that are difficult to scale.
  • The demand for specialized components for satellite communications systems and the commercial space sector pushes the limits of existing technology, particularly with radiation-hardened substrates. In the industrial automation electronics and automotive sectors, the need for high-voltage power electronics and reliable power distribution boards creates technical hurdles.
  • Manufacturers must master advanced techniques like the modified semi-additive process and integrate specialized components such as thick-film and thin-film technologies. Failure to manage these complexities can increase production costs by over 25% and delay product launches.

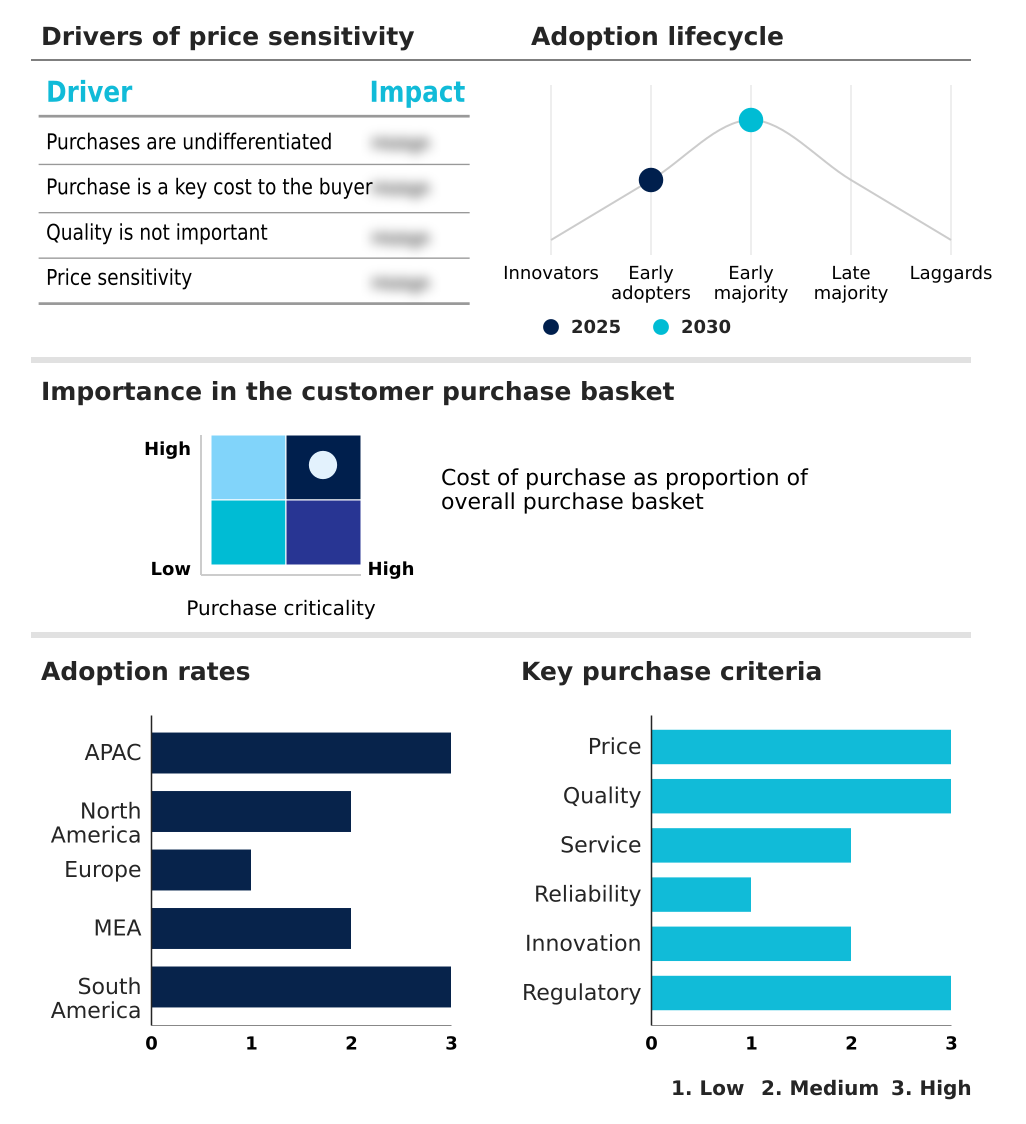
Exclusive Technavio Analysis on Customer Landscape

The printed circuit board (pcb) market forecasting report includes the adoption lifecycle of the market, covering from the innovator’s stage to the laggard’s stage. It focuses on adoption rates in different regions based on penetration. Furthermore, the printed circuit board (pcb) market report also includes key purchase criteria and drivers of price sensitivity to help companies evaluate and develop their market growth analysis strategies.

Customer Landscape of Printed Circuit Board (PCB) Industry

Competitive Landscape

Companies are implementing various strategies, such as strategic alliances, printed circuit board (pcb) market forecast, partnerships, mergers and acquisitions, geographical expansion, and product/service launches, to enhance their presence in the industry.

APCT - Manufacturing capabilities include a diverse range of printed circuit boards, encompassing rigid, rigid-flex, and high-density interconnect (HDI) technologies for advanced electronic systems.

The industry research and growth report includes detailed analyses of the competitive landscape of the market and information about key companies, including:

  • APCT
  • China Circuit Technology Shantou
  • Compeq Manufacturing Co. Ltd.
  • Daedeok Electronics Co. Ltd.
  • Ibiden Co. Ltd.
  • Jabil Inc.
  • Korea Circuit Co. Ltd.
  • Murrietta Circuits
  • NOK Corp.
  • RayMing Technology Co. Ltd.
  • Shenzhen Kinwong Electronic Co
  • Shenzhen SenYan Circuit Co
  • ShenZhen Wonderful Technology
  • Shenzhen Zhongxinhua Electronics
  • Sumitomo Electric Industries
  • TTM Technologies Inc.
  • Victory Giant Technology Co.
  • Vishal International

Qualitative and quantitative analysis of companies has been conducted to help clients understand the wider business environment as well as the strengths and weaknesses of key industry players. Data is qualitatively analyzed to categorize companies as pure play, category-focused, industry-focused, and diversified; it is quantitatively analyzed to categorize companies as dominant, leading, strong, tentative, and weak.

Recent Development and News in Printed circuit board (pcb) market

  • In May 2025, TTM Technologies Inc. inaugurated a new manufacturing facility focused on producing high-reliability circuit boards for the North American aerospace and automotive markets, reinforcing domestic supply chain capabilities.
  • In April 2025, Schweizer Electronic AG introduced an innovative high-frequency embedding technology designed to minimize energy loss in high-performance computing applications, addressing a key challenge in data center efficiency.
  • In March 2025, Unimicron Technology Corp. announced the full-scale operation of a new production facility dedicated to fabricating high-layer-count substrates for AI accelerators, meeting the demand from the high-performance computing sector.
  • In February 2025, Rogers Corp. launched a new line of circuit materials engineered to improve the performance and reliability of high-frequency automotive radar systems, enhancing the capabilities of advanced driver-assistance systems.

Dive into Technavio’s robust research methodology, blending expert interviews, extensive data synthesis, and validated models for unparalleled Printed Circuit Board (PCB) Market insights. See full methodology.

Market Scope
Page number 311
Base year 2025
Historic period 2020-2024
Forecast period 2026-2030
Growth momentum & CAGR Accelerate at a CAGR of 6.2%
Market growth 2026-2030 USD 28569.7 million
Market structure Fragmented
YoY growth 2025-2026(%) 5.9%
Key countries China, India, Japan, South Korea, Australia, Singapore, US, Canada, Mexico, Germany, UK, France, Italy, Spain, The Netherlands, UAE, Saudi Arabia, South Africa, Egypt, Qatar, Brazil, Argentina and Chile
Competitive landscape Leading Companies, Market Positioning of Companies, Competitive Strategies, and Industry Risks

Request Free Sample

Research Analyst Overview

  • The market is defined by a rapid convergence of advanced technologies, forcing a strategic realignment in manufacturing and design. The widespread adoption of high-density interconnect, multi-layer boards, and substrate-like PCB architectures is now standard for achieving requisite signal integrity and thermal management. This technological pivot is driven by demands from advanced driver-assistance systems and 5G-advanced infrastructure.
  • Boardroom decisions now center on the significant capital investment required for technologies like automated optical inspection and laser direct imaging. Companies are weighing the benefits of in-house development of rigid-flex circuits and ceramic-based substrates against outsourcing, a choice that directly impacts long-term competitiveness.
  • The integration of embedded component technology and advanced semiconductor packaging, such as flip-chip ball grid array, necessitates a deeper collaboration across the supply chain. Mastery of surface mount technology on heavy copper boards for power electronics is critical.
  • This focus on high-value fabrication is compelling, with firms adopting advanced manufacturing processes reporting a 25% improvement in first-pass yield for complex designs.

What are the Key Data Covered in this Printed Circuit Board (PCB) Market Research and Growth Report?

  • What is the expected growth of the Printed Circuit Board (PCB) Market between 2026 and 2030?

    • USD 28.57 billion, at a CAGR of 6.2%

  • What segmentation does the market report cover?

    • The report is segmented by Type (Multi-layer, HDI, Single sided, and Double sided), End-user (Communication network infrastructure, IT and peripherals, Automotive, Consumer electronics, and Others), Component (Integrated circuits, Capacitors, Resistors, Diodes, and Others) and Geography (APAC, North America, Europe, Middle East and Africa, South America)

  • Which regions are analyzed in the report?

    • APAC, North America, Europe, Middle East and Africa and South America

  • What are the key growth drivers and market challenges?

    • Proliferation of AI and high-performance computing infrastructure, Volatility in material procurement and commodity pricing strategies

  • Who are the major players in the Printed Circuit Board (PCB) Market?

    • APCT, China Circuit Technology Shantou, Compeq Manufacturing Co. Ltd., Daedeok Electronics Co. Ltd., Ibiden Co. Ltd., Jabil Inc., Korea Circuit Co. Ltd., Murrietta Circuits, NOK Corp., RayMing Technology Co. Ltd., Shenzhen Kinwong Electronic Co, Shenzhen SenYan Circuit Co, ShenZhen Wonderful Technology, Shenzhen Zhongxinhua Electronics, Sumitomo Electric Industries, TTM Technologies Inc., Victory Giant Technology Co. and Vishal International

Market Research Insights

  • The market's dynamics are shaped by intense demand from high-performance computing ecosystems and advancements in automotive electrification integration. This pressure drives the need for advanced packaging strategies and heterogeneous integration, with firms adopting green manufacturing processes achieving up to 15% better resource efficiency.
  • The expansion of telecommunications hardware and sovereign cloud infrastructure is met with challenges, including precision engineering bottlenecks and commodity pricing volatility. As a result, establishing resilient domestic fabrication capacities has become a key strategic objective, with government support for such initiatives increasing by over 30% in key regions.
  • Adherence to new regulatory compliance mandates for sustainable electronics manufacturing is now a critical differentiator, influencing design and material choices across the entire value chain.

We can help! Our analysts can customize this printed circuit board (pcb) market research report to meet your requirements.

Get in touch

1. Executive Summary

1.1 Market overview

Executive Summary - Chart on Market Overview
Executive Summary - Data Table on Market Overview
Executive Summary - Chart on Global Market Characteristics
Executive Summary - Chart on Market by Geography
Executive Summary - Chart on Market Segmentation by Type
Executive Summary - Chart on Market Segmentation by End-user
Executive Summary - Chart on Market Segmentation by Component
Executive Summary - Chart on Incremental Growth
Executive Summary - Data Table on Incremental Growth
Executive Summary - Chart on Company Market Positioning

2. Technavio Analysis

2.1 Analysis of price sensitivity, lifecycle, customer purchase basket, adoption rates, and purchase criteria

2.2 Criticality of inputs and Factors of differentiation

Chart on Overview on criticality of inputs and factors of differentiation

2.3 Factors of disruption

Chart on Overview on factors of disruption

2.4 Impact of drivers and challenges

Chart on Impact of drivers and challenges in 2025 and 2030

3. Market Landscape

3.1 Market ecosystem

Chart on Parent Market
Data Table on - Parent Market

3.2 Market characteristics

Chart on Market characteristics analysis

3.3 Value chain analysis

Chart on Value chain analysis

4. Market Sizing

4.1 Market definition

Data Table on Offerings of companies included in the market definition

4.2 Market segment analysis

Market segments

4.3 Market size 2025

4.4 Market outlook: Forecast for 2025-2030

Chart on Global - Market size and forecast 2025-2030 ($ million)
Data Table on Global - Market size and forecast 2025-2030 ($ million)
Chart on Global Market: Year-over-year growth 2025-2030 (%)
Data Table on Global Market: Year-over-year growth 2025-2030 (%)

5. Historic Market Size

5.1 Global Printed Circuit Board (PCB) Market 2020 - 2024

Historic Market Size - Data Table on Global Printed Circuit Board (PCB) Market 2020 - 2024 ($ million)

5.2 Type segment analysis 2020 - 2024

Historic Market Size - Type Segment 2020 - 2024 ($ million)

5.3 End-user segment analysis 2020 - 2024

Historic Market Size - End-user Segment 2020 - 2024 ($ million)

5.4 Component segment analysis 2020 - 2024

Historic Market Size - Component Segment 2020 - 2024 ($ million)

5.5 Geography segment analysis 2020 - 2024

Historic Market Size - Geography Segment 2020 - 2024 ($ million)

5.6 Country segment analysis 2020 - 2024

Historic Market Size - Country Segment 2020 - 2024 ($ million)

6. Qualitative Analysis

6.1 Impact of AI on Global Printed Circuit Board (PCB) Market

6.2 Impact of Geopolitical Conflicts on Global Printed Circuit Board (PCB) Market

7. Five Forces Analysis

7.1 Five forces summary

Five forces analysis - Comparison between 2025 and 2030

7.2 Bargaining power of buyers

Bargaining power of buyers - Impact of key factors 2025 and 2030

7.3 Bargaining power of suppliers

Bargaining power of suppliers - Impact of key factors in 2025 and 2030

7.4 Threat of new entrants

Threat of new entrants - Impact of key factors in 2025 and 2030

7.5 Threat of substitutes

Threat of substitutes - Impact of key factors in 2025 and 2030

7.6 Threat of rivalry

Threat of rivalry - Impact of key factors in 2025 and 2030

7.7 Market condition

Chart on Market condition - Five forces 2025 and 2030

8. Market Segmentation by Type

8.1 Market segments

Chart on Type - Market share 2025-2030 (%)
Data Table on Type - Market share 2025-2030 (%)

8.2 Comparison by Type

Chart on Comparison by Type
Data Table on Comparison by Type

8.3 Multi-layer - Market size and forecast 2025-2030

Chart on Multi-layer - Market size and forecast 2025-2030 ($ million)
Data Table on Multi-layer - Market size and forecast 2025-2030 ($ million)
Chart on Multi-layer - Year-over-year growth 2025-2030 (%)
Data Table on Multi-layer - Year-over-year growth 2025-2030 (%)

8.4 HDI - Market size and forecast 2025-2030

Chart on HDI - Market size and forecast 2025-2030 ($ million)
Data Table on HDI - Market size and forecast 2025-2030 ($ million)
Chart on HDI - Year-over-year growth 2025-2030 (%)
Data Table on HDI - Year-over-year growth 2025-2030 (%)

8.5 Single sided - Market size and forecast 2025-2030

Chart on Single sided - Market size and forecast 2025-2030 ($ million)
Data Table on Single sided - Market size and forecast 2025-2030 ($ million)
Chart on Single sided - Year-over-year growth 2025-2030 (%)
Data Table on Single sided - Year-over-year growth 2025-2030 (%)

8.6 Double sided - Market size and forecast 2025-2030

Chart on Double sided - Market size and forecast 2025-2030 ($ million)
Data Table on Double sided - Market size and forecast 2025-2030 ($ million)
Chart on Double sided - Year-over-year growth 2025-2030 (%)
Data Table on Double sided - Year-over-year growth 2025-2030 (%)

8.7 Market opportunity by Type

Market opportunity by Type ($ million)
Data Table on Market opportunity by Type ($ million)

9. Market Segmentation by End-user

9.1 Market segments

Chart on End-user - Market share 2025-2030 (%)
Data Table on End-user - Market share 2025-2030 (%)

9.2 Comparison by End-user

Chart on Comparison by End-user
Data Table on Comparison by End-user

9.3 Communication network infrastructure - Market size and forecast 2025-2030

Chart on Communication network infrastructure - Market size and forecast 2025-2030 ($ million)
Data Table on Communication network infrastructure - Market size and forecast 2025-2030 ($ million)
Chart on Communication network infrastructure - Year-over-year growth 2025-2030 (%)
Data Table on Communication network infrastructure - Year-over-year growth 2025-2030 (%)

9.4 IT and peripherals - Market size and forecast 2025-2030

Chart on IT and peripherals - Market size and forecast 2025-2030 ($ million)
Data Table on IT and peripherals - Market size and forecast 2025-2030 ($ million)
Chart on IT and peripherals - Year-over-year growth 2025-2030 (%)
Data Table on IT and peripherals - Year-over-year growth 2025-2030 (%)

9.5 Automotive - Market size and forecast 2025-2030

Chart on Automotive - Market size and forecast 2025-2030 ($ million)
Data Table on Automotive - Market size and forecast 2025-2030 ($ million)
Chart on Automotive - Year-over-year growth 2025-2030 (%)
Data Table on Automotive - Year-over-year growth 2025-2030 (%)

9.6 Consumer electronics - Market size and forecast 2025-2030

Chart on Consumer electronics - Market size and forecast 2025-2030 ($ million)
Data Table on Consumer electronics - Market size and forecast 2025-2030 ($ million)
Chart on Consumer electronics - Year-over-year growth 2025-2030 (%)
Data Table on Consumer electronics - Year-over-year growth 2025-2030 (%)

9.7 Others - Market size and forecast 2025-2030

Chart on Others - Market size and forecast 2025-2030 ($ million)
Data Table on Others - Market size and forecast 2025-2030 ($ million)
Chart on Others - Year-over-year growth 2025-2030 (%)
Data Table on Others - Year-over-year growth 2025-2030 (%)

9.8 Market opportunity by End-user

Market opportunity by End-user ($ million)
Data Table on Market opportunity by End-user ($ million)

10. Market Segmentation by Component

10.1 Market segments

Chart on Component - Market share 2025-2030 (%)
Data Table on Component - Market share 2025-2030 (%)

10.2 Comparison by Component

Chart on Comparison by Component
Data Table on Comparison by Component

10.3 Integrated circuits - Market size and forecast 2025-2030

Chart on Integrated circuits - Market size and forecast 2025-2030 ($ million)
Data Table on Integrated circuits - Market size and forecast 2025-2030 ($ million)
Chart on Integrated circuits - Year-over-year growth 2025-2030 (%)
Data Table on Integrated circuits - Year-over-year growth 2025-2030 (%)

10.4 Capacitors - Market size and forecast 2025-2030

Chart on Capacitors - Market size and forecast 2025-2030 ($ million)
Data Table on Capacitors - Market size and forecast 2025-2030 ($ million)
Chart on Capacitors - Year-over-year growth 2025-2030 (%)
Data Table on Capacitors - Year-over-year growth 2025-2030 (%)

10.5 Resistors - Market size and forecast 2025-2030

Chart on Resistors - Market size and forecast 2025-2030 ($ million)
Data Table on Resistors - Market size and forecast 2025-2030 ($ million)
Chart on Resistors - Year-over-year growth 2025-2030 (%)
Data Table on Resistors - Year-over-year growth 2025-2030 (%)

10.6 Diodes - Market size and forecast 2025-2030

Chart on Diodes - Market size and forecast 2025-2030 ($ million)
Data Table on Diodes - Market size and forecast 2025-2030 ($ million)
Chart on Diodes - Year-over-year growth 2025-2030 (%)
Data Table on Diodes - Year-over-year growth 2025-2030 (%)

10.7 Others - Market size and forecast 2025-2030

Chart on Others - Market size and forecast 2025-2030 ($ million)
Data Table on Others - Market size and forecast 2025-2030 ($ million)
Chart on Others - Year-over-year growth 2025-2030 (%)
Data Table on Others - Year-over-year growth 2025-2030 (%)

10.8 Market opportunity by Component

Market opportunity by Component ($ million)
Data Table on Market opportunity by Component ($ million)

11. Customer Landscape

11.1 Customer landscape overview

Analysis of price sensitivity, lifecycle, customer purchase basket, adoption rates, and purchase criteria

12. Geographic Landscape

12.1 Geographic segmentation

Chart on Market share by geography 2025-2030 (%)
Data Table on Market share by geography 2025-2030 (%)

12.2 Geographic comparison

Chart on Geographic comparison
Data Table on Geographic comparison

12.3 APAC - Market size and forecast 2025-2030

Chart on APAC - Market size and forecast 2025-2030 ($ million)
Data Table on APAC - Market size and forecast 2025-2030 ($ million)
Chart on APAC - Year-over-year growth 2025-2030 (%)
Data Table on APAC - Year-over-year growth 2025-2030 (%)
Chart on Regional Comparison - APAC
Data Table on Regional Comparison - APAC

12.3.1 China - Market size and forecast 2025-2030

Chart on China - Market size and forecast 2025-2030 ($ million)
Data Table on China - Market size and forecast 2025-2030 ($ million)
Chart on China - Year-over-year growth 2025-2030 (%)
Data Table on China - Year-over-year growth 2025-2030 (%)

12.3.2 India - Market size and forecast 2025-2030

Chart on India - Market size and forecast 2025-2030 ($ million)
Data Table on India - Market size and forecast 2025-2030 ($ million)
Chart on India - Year-over-year growth 2025-2030 (%)
Data Table on India - Year-over-year growth 2025-2030 (%)

12.3.3 Japan - Market size and forecast 2025-2030

Chart on Japan - Market size and forecast 2025-2030 ($ million)
Data Table on Japan - Market size and forecast 2025-2030 ($ million)
Chart on Japan - Year-over-year growth 2025-2030 (%)
Data Table on Japan - Year-over-year growth 2025-2030 (%)

12.3.4 South Korea - Market size and forecast 2025-2030

Chart on South Korea - Market size and forecast 2025-2030 ($ million)
Data Table on South Korea - Market size and forecast 2025-2030 ($ million)
Chart on South Korea - Year-over-year growth 2025-2030 (%)
Data Table on South Korea - Year-over-year growth 2025-2030 (%)

12.3.5 Australia - Market size and forecast 2025-2030

Chart on Australia - Market size and forecast 2025-2030 ($ million)
Data Table on Australia - Market size and forecast 2025-2030 ($ million)
Chart on Australia - Year-over-year growth 2025-2030 (%)
Data Table on Australia - Year-over-year growth 2025-2030 (%)

12.3.6 Singapore - Market size and forecast 2025-2030

Chart on Singapore - Market size and forecast 2025-2030 ($ million)
Data Table on Singapore - Market size and forecast 2025-2030 ($ million)
Chart on Singapore - Year-over-year growth 2025-2030 (%)
Data Table on Singapore - Year-over-year growth 2025-2030 (%)

12.4 North America - Market size and forecast 2025-2030

Chart on North America - Market size and forecast 2025-2030 ($ million)
Data Table on North America - Market size and forecast 2025-2030 ($ million)
Chart on North America - Year-over-year growth 2025-2030 (%)
Data Table on North America - Year-over-year growth 2025-2030 (%)
Chart on Regional Comparison - North America
Data Table on Regional Comparison - North America

12.4.1 US - Market size and forecast 2025-2030

Chart on US - Market size and forecast 2025-2030 ($ million)
Data Table on US - Market size and forecast 2025-2030 ($ million)
Chart on US - Year-over-year growth 2025-2030 (%)
Data Table on US - Year-over-year growth 2025-2030 (%)

12.4.2 Canada - Market size and forecast 2025-2030

Chart on Canada - Market size and forecast 2025-2030 ($ million)
Data Table on Canada - Market size and forecast 2025-2030 ($ million)
Chart on Canada - Year-over-year growth 2025-2030 (%)
Data Table on Canada - Year-over-year growth 2025-2030 (%)

12.4.3 Mexico - Market size and forecast 2025-2030

Chart on Mexico - Market size and forecast 2025-2030 ($ million)
Data Table on Mexico - Market size and forecast 2025-2030 ($ million)
Chart on Mexico - Year-over-year growth 2025-2030 (%)
Data Table on Mexico - Year-over-year growth 2025-2030 (%)

12.5 Europe - Market size and forecast 2025-2030

Chart on Europe - Market size and forecast 2025-2030 ($ million)
Data Table on Europe - Market size and forecast 2025-2030 ($ million)
Chart on Europe - Year-over-year growth 2025-2030 (%)
Data Table on Europe - Year-over-year growth 2025-2030 (%)
Chart on Regional Comparison - Europe
Data Table on Regional Comparison - Europe

12.5.1 Germany - Market size and forecast 2025-2030

Chart on Germany - Market size and forecast 2025-2030 ($ million)
Data Table on Germany - Market size and forecast 2025-2030 ($ million)
Chart on Germany - Year-over-year growth 2025-2030 (%)
Data Table on Germany - Year-over-year growth 2025-2030 (%)

12.5.2 UK - Market size and forecast 2025-2030

Chart on UK - Market size and forecast 2025-2030 ($ million)
Data Table on UK - Market size and forecast 2025-2030 ($ million)
Chart on UK - Year-over-year growth 2025-2030 (%)
Data Table on UK - Year-over-year growth 2025-2030 (%)

12.5.3 France - Market size and forecast 2025-2030

Chart on France - Market size and forecast 2025-2030 ($ million)
Data Table on France - Market size and forecast 2025-2030 ($ million)
Chart on France - Year-over-year growth 2025-2030 (%)
Data Table on France - Year-over-year growth 2025-2030 (%)

12.5.4 Italy - Market size and forecast 2025-2030

Chart on Italy - Market size and forecast 2025-2030 ($ million)
Data Table on Italy - Market size and forecast 2025-2030 ($ million)
Chart on Italy - Year-over-year growth 2025-2030 (%)
Data Table on Italy - Year-over-year growth 2025-2030 (%)

12.5.5 Spain - Market size and forecast 2025-2030

Chart on Spain - Market size and forecast 2025-2030 ($ million)
Data Table on Spain - Market size and forecast 2025-2030 ($ million)
Chart on Spain - Year-over-year growth 2025-2030 (%)
Data Table on Spain - Year-over-year growth 2025-2030 (%)

12.5.6 The Netherlands - Market size and forecast 2025-2030

Chart on The Netherlands - Market size and forecast 2025-2030 ($ million)
Data Table on The Netherlands - Market size and forecast 2025-2030 ($ million)
Chart on The Netherlands - Year-over-year growth 2025-2030 (%)
Data Table on The Netherlands - Year-over-year growth 2025-2030 (%)

12.6 Middle East and Africa - Market size and forecast 2025-2030

Chart on Middle East and Africa - Market size and forecast 2025-2030 ($ million)
Data Table on Middle East and Africa - Market size and forecast 2025-2030 ($ million)
Chart on Middle East and Africa - Year-over-year growth 2025-2030 (%)
Data Table on Middle East and Africa - Year-over-year growth 2025-2030 (%)
Chart on Regional Comparison - Middle East and Africa
Data Table on Regional Comparison - Middle East and Africa

12.6.1 UAE - Market size and forecast 2025-2030

Chart on UAE - Market size and forecast 2025-2030 ($ million)
Data Table on UAE - Market size and forecast 2025-2030 ($ million)
Chart on UAE - Year-over-year growth 2025-2030 (%)
Data Table on UAE - Year-over-year growth 2025-2030 (%)

12.6.2 Saudi Arabia - Market size and forecast 2025-2030

Chart on Saudi Arabia - Market size and forecast 2025-2030 ($ million)
Data Table on Saudi Arabia - Market size and forecast 2025-2030 ($ million)
Chart on Saudi Arabia - Year-over-year growth 2025-2030 (%)
Data Table on Saudi Arabia - Year-over-year growth 2025-2030 (%)

12.6.3 South Africa - Market size and forecast 2025-2030

Chart on South Africa - Market size and forecast 2025-2030 ($ million)
Data Table on South Africa - Market size and forecast 2025-2030 ($ million)
Chart on South Africa - Year-over-year growth 2025-2030 (%)
Data Table on South Africa - Year-over-year growth 2025-2030 (%)

12.6.4 Egypt - Market size and forecast 2025-2030

Chart on Egypt - Market size and forecast 2025-2030 ($ million)
Data Table on Egypt - Market size and forecast 2025-2030 ($ million)
Chart on Egypt - Year-over-year growth 2025-2030 (%)
Data Table on Egypt - Year-over-year growth 2025-2030 (%)

12.6.5 Qatar - Market size and forecast 2025-2030

Chart on Qatar - Market size and forecast 2025-2030 ($ million)
Data Table on Qatar - Market size and forecast 2025-2030 ($ million)
Chart on Qatar - Year-over-year growth 2025-2030 (%)
Data Table on Qatar - Year-over-year growth 2025-2030 (%)

12.7 South America - Market size and forecast 2025-2030

Chart on South America - Market size and forecast 2025-2030 ($ million)
Data Table on South America - Market size and forecast 2025-2030 ($ million)
Chart on South America - Year-over-year growth 2025-2030 (%)
Data Table on South America - Year-over-year growth 2025-2030 (%)
Chart on Regional Comparison - South America
Data Table on Regional Comparison - South America

12.7.1 Brazil - Market size and forecast 2025-2030

Chart on Brazil - Market size and forecast 2025-2030 ($ million)
Data Table on Brazil - Market size and forecast 2025-2030 ($ million)
Chart on Brazil - Year-over-year growth 2025-2030 (%)
Data Table on Brazil - Year-over-year growth 2025-2030 (%)

12.7.2 Argentina - Market size and forecast 2025-2030

Chart on Argentina - Market size and forecast 2025-2030 ($ million)
Data Table on Argentina - Market size and forecast 2025-2030 ($ million)
Chart on Argentina - Year-over-year growth 2025-2030 (%)
Data Table on Argentina - Year-over-year growth 2025-2030 (%)

12.7.3 Chile - Market size and forecast 2025-2030

Chart on Chile - Market size and forecast 2025-2030 ($ million)
Data Table on Chile - Market size and forecast 2025-2030 ($ million)
Chart on Chile - Year-over-year growth 2025-2030 (%)
Data Table on Chile - Year-over-year growth 2025-2030 (%)

12.8 Market opportunity by geography

Market opportunity by geography ($ million)
Data Tables on Market opportunity by geography ($ million)

13. Drivers, Challenges, and Opportunity

13.1 Market drivers

Proliferation of AI and high-performance computing infrastructure
Electrification and advanced safety integration in automotive sector
Expansion of 5G-advanced and early-stage 6G telecommunications infrastructure

13.2 Market challenges

Volatility in material procurement and commodity pricing strategies
Technological complexity and precision engineering bottlenecks
Regulatory compliance and sustainability integration mandates

13.3 Impact of drivers and challenges

Impact of drivers and challenges in 2025 and 2030

13.4 Market opportunities

Global transition toward high-density interconnect and AI accelerated substrates
Proliferation of automotive electrification and advanced driver assistance systems
Expansion of digital infrastructure and sustainable electronics manufacturing

14. Competitive Landscape

14.1 Overview

14.2

Overview on criticality of inputs and factors of differentiation

14.3 Landscape disruption

Overview on factors of disruption

14.4 Industry risks

Impact of key risks on business

15. Competitive Analysis

15.1 Companies profiled

Companies covered

15.2 Company ranking index

15.3 Market positioning of companies

Matrix on companies position and classification

15.4 APCT

APCT - Overview
APCT - Product / Service
APCT - Key offerings
SWOT

15.5 China Circuit Technology Shantou

China Circuit Technology Shantou - Overview
China Circuit Technology Shantou - Product / Service
China Circuit Technology Shantou - Key offerings
SWOT

15.6 Compeq Manufacturing Co. Ltd.

Compeq Manufacturing Co. Ltd. - Overview
Compeq Manufacturing Co. Ltd. - Business segments
Compeq Manufacturing Co. Ltd. - Key offerings
Compeq Manufacturing Co. Ltd. - Segment focus
SWOT

15.7 Daedeok Electronics Co. Ltd.

Daedeok Electronics Co. Ltd. - Overview
Daedeok Electronics Co. Ltd. - Business segments
Daedeok Electronics Co. Ltd. - Key offerings
Daedeok Electronics Co. Ltd. - Segment focus
SWOT

15.8 Ibiden Co. Ltd.

Ibiden Co. Ltd. - Overview
Ibiden Co. Ltd. - Business segments
Ibiden Co. Ltd. - Key offerings
Ibiden Co. Ltd. - Segment focus
SWOT

15.9 Jabil Inc.

Jabil Inc. - Overview
Jabil Inc. - Business segments
Jabil Inc. - Key offerings
Jabil Inc. - Segment focus
SWOT

15.10 Murrietta Circuits

Murrietta Circuits - Overview
Murrietta Circuits - Product / Service
Murrietta Circuits - Key offerings
SWOT

15.11 NOK Corp.

NOK Corp. - Overview
NOK Corp. - Business segments
NOK Corp. - Key offerings
NOK Corp. - Segment focus
SWOT

15.12 RayMing Technology Co. Ltd.

RayMing Technology Co. Ltd. - Overview
RayMing Technology Co. Ltd. - Product / Service
RayMing Technology Co. Ltd. - Key offerings
SWOT

15.13 Shenzhen Kinwong Electronic Co

Shenzhen Kinwong Electronic Co - Overview
Shenzhen Kinwong Electronic Co - Product / Service
Shenzhen Kinwong Electronic Co - Key offerings
SWOT

15.14 ShenZhen Wonderful Technology

ShenZhen Wonderful Technology - Overview
ShenZhen Wonderful Technology - Product / Service
ShenZhen Wonderful Technology - Key offerings
SWOT

15.15 Shenzhen Zhongxinhua Electronics

Shenzhen Zhongxinhua Electronics - Overview
Shenzhen Zhongxinhua Electronics - Product / Service
Shenzhen Zhongxinhua Electronics - Key offerings
SWOT

15.16 Sumitomo Electric Industries

Sumitomo Electric Industries - Overview
Sumitomo Electric Industries - Business segments
Sumitomo Electric Industries - Key news
Sumitomo Electric Industries - Key offerings
Sumitomo Electric Industries - Segment focus
SWOT

15.17 TTM Technologies Inc.

TTM Technologies Inc. - Overview
TTM Technologies Inc. - Business segments
TTM Technologies Inc. - Key offerings
TTM Technologies Inc. - Segment focus
SWOT

15.18 Victory Giant Technology Co.

Victory Giant Technology Co. - Overview
Victory Giant Technology Co. - Product / Service
Victory Giant Technology Co. - Key offerings
SWOT

16. Appendix

16.1 Scope of the report

Market definition
Objectives
Notes and caveats

16.2 Inclusions and exclusions checklist

Inclusions checklist
Exclusions checklist

16.3 Currency conversion rates for US$

16.4 Research methodology

16.5 Data procurement

Information sources

16.6 Data validation

16.7 Validation techniques employed for market sizing

16.8 Data synthesis

16.9 360 degree market analysis

16.10 List of abbreviations

Research Methodology

Technavio presents a detailed picture of the market by way of study, synthesis, and summation of data from multiple sources. The analysts have presented the various facets of the market with a particular focus on identifying the key industry influencers. The data thus presented is comprehensive, reliable, and the result of extensive research, both primary and secondary.

INFORMATION SOURCES

Primary sources

  • Manufacturers and suppliers
  • Channel partners
  • Industry experts
  • Strategic decision makers

Secondary sources

  • Industry journals and periodicals
  • Government data
  • Financial reports of key industry players
  • Historical data
  • Press releases

DATA ANALYSIS

Data Synthesis

  • Collation of data
  • Estimation of key figures
  • Analysis of derived insights

Data Validation

  • Triangulation with data models
  • Reference against proprietary databases
  • Corroboration with industry experts

REPORT WRITING

Qualitative

  • Market drivers
  • Market challenges
  • Market trends
  • Five forces analysis

Quantitative

  • Market size and forecast
  • Market segmentation
  • Geographical insights
  • Competitive landscape

Interested in this report?

Get your sample now to see our research methodology and insights!

Download Now

Frequently Asked Questions

Printed Circuit Board (PCB) market growth will increase by USD 28569.7 million during 2026-2030.

The Printed Circuit Board (PCB) market is expected to grow at a CAGR of 6.2% during 2026-2030.

Printed Circuit Board (PCB) market is segmented by Type (Multi-layer, HDI, Single sided, Double sided) End-user (Communication network infrastructure, IT and peripherals, Automotive, Consumer electronics, Others) Component (Integrated circuits, Capacitors, Resistors, Diodes, Others)

APCT, China Circuit Technology Shantou, Compeq Manufacturing Co. Ltd., Daedeok Electronics Co. Ltd., Ibiden Co. Ltd., Jabil Inc., Korea Circuit Co. Ltd., Murrietta Circuits, NOK Corp., RayMing Technology Co. Ltd., Shenzhen Kinwong Electronic Co, Shenzhen SenYan Circuit Co, ShenZhen Wonderful Technology, Shenzhen Zhongxinhua Electronics, Sumitomo Electric Industries, TTM Technologies Inc., Victory Giant Technology Co., Vishal International are a few of the key vendors in the Printed Circuit Board (PCB) market.

APAC will register the highest growth rate of 88.4% among the other regions. Therefore, the Printed Circuit Board (PCB) market in APAC is expected to garner significant business opportunities for the vendors during the forecast period.

China, India, Japan, South Korea, Australia, Singapore, US, Canada, Mexico, Germany, UK, France, Italy, Spain, The Netherlands, UAE, Saudi Arabia, South Africa, Egypt, Qatar, Brazil, Argentina, Chile

  • Proliferation of AI and high-performance computing infrastructure is the driving factor this market.

The Printed Circuit Board (PCB) market vendors should focus on grabbing business opportunities from the Type segment as it accounted for the largest market share in the base year.
RIA - Research AI Assistant
Ask RIA