
Radiation Shielding Material Market Analysis, Size, and Forecast 2026-2030: North America (US, Canada, and Mexico), Europe (Germany, UK, and France), Asia (China, Japan, and India), South America (Brazil, Argentina, and Colombia), Middle East and Africa (Saudi Arabia, UAE, and Turkey), Rest of World (ROW)

Radiation Shielding Material Market Analysis, Size, and Forecast 2026-2030:
North America (US, Canada, and Mexico), Europe (Germany, UK, and France), Asia (China, Japan, and India), South America (Brazil, Argentina, and Colombia), Middle East and Africa (Saudi Arabia, UAE, and Turkey), Rest of World (ROW)

Published: Nov 2026 297 Pages SKU: IRTNTR77175

Market Overview at a Glance

$434.3 Mn
Market Opportunity
7.7%
CAGR 2025 - 2030
33.2%
North America Growth
$593.1 Mn
Electromagnetic radiation segment 2024

Radiation Shielding Material Market Size 2026-2030

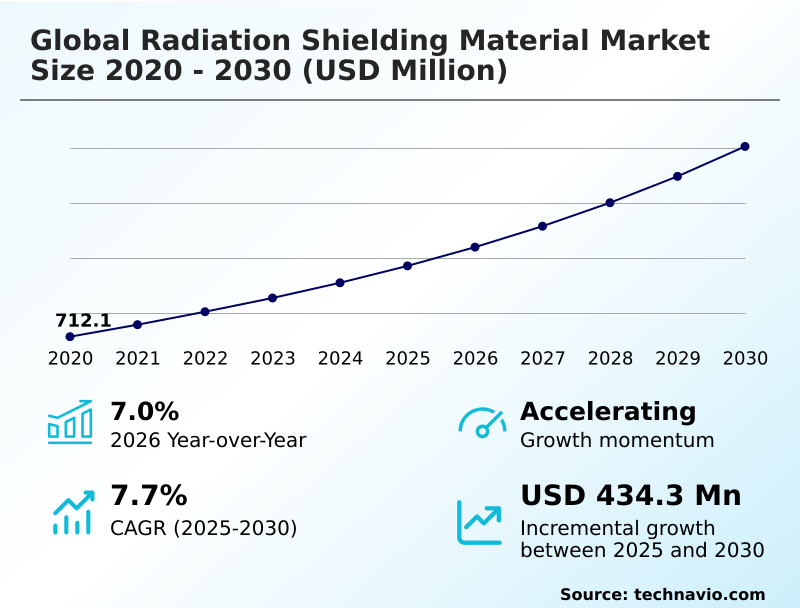
The radiation shielding material market size is valued to increase by USD 434.3 million, at a CAGR of 7.7% from 2025 to 2030. Expansion of advanced radiopharmaceutical and theranostics suites will drive the radiation shielding material market.

Major Market Trends & Insights

  • North America dominated the market and accounted for a 33.2% growth during the forecast period.
  • By Type - Electromagnetic radiation segment was valued at USD 593.1 million in 2024
  • By Material - Lead shielding segment accounted for the largest market revenue share in 2024

Market Size & Forecast

  • Market Opportunities: USD 691.7 million
  • Market Future Opportunities: USD 434.3 million
  • CAGR from 2025 to 2030 : 7.7%

Market Summary

  • The Radiation Shielding Material Market is experiencing a structural transformation driven by the critical need to safeguard personnel and equipment from ionizing radiation across medical, industrial, and aerospace sectors. The rapid expansion of targeted radiopharmaceutical therapies acts as a primary growth catalyst, compelling healthcare facilities to upgrade diagnostic imaging infrastructure with high-density concrete and tungsten-polymer composite barriers.
  • Conversely, strict hazardous waste disposal mandates and heavy metal toxicity mitigation protocols present significant operational challenges, forcing institutions to navigate costly lead abatement protocols. In response, supply chain strategies are shifting toward non-toxic material compositions, with procurement teams prioritizing non-lead polymer matrix composite aprons over traditional lead garments.
  • This strategic transition has enabled medical centers to reduce ergonomic-related staff fatigue by up to 30%, directly improving clinical workflow efficiency. Furthermore, the integration of bio-composite shielding structures and radiation shielding glass for hot labs ensures robust occupational safety compliance.
  • As regulatory scrutiny intensifies, the continuous development of lightweight personal protective aprons remains essential for maintaining operational continuity in high-exposure environments.

What will be the Size of the Radiation Shielding Material Market during the forecast period?
Get Key Insights on Market Forecast (PDF) Get Free Sample

How is the Radiation Shielding Material Market Segmented?

The radiation shielding material industry research report provides comprehensive data (region-wise segment analysis), with forecasts and estimates in "USD million" for the period 2026-2030, as well as historical data from 2020-2024 for the following segments.

  • Type
    • Electromagnetic radiation
    • Particle radiation
  • Material
    • Lead shielding
    • Lead composite shielding
    • Copper
    • Tungsten
    • Others
  • End-user
    • Healthcare
    • Manufacturing
    • Construction
    • Energy
    • Research
  • Geography
    • North America
      • US
      • Canada
      • Mexico
    • Europe
      • Germany
      • UK
      • France
      • Italy
      • Spain
      • The Netherlands
    • Asia
      • China
      • Japan
      • India
      • South Korea
      • Indonesia
      • Thailand
    • Rest of World (ROW)

By Type Insights

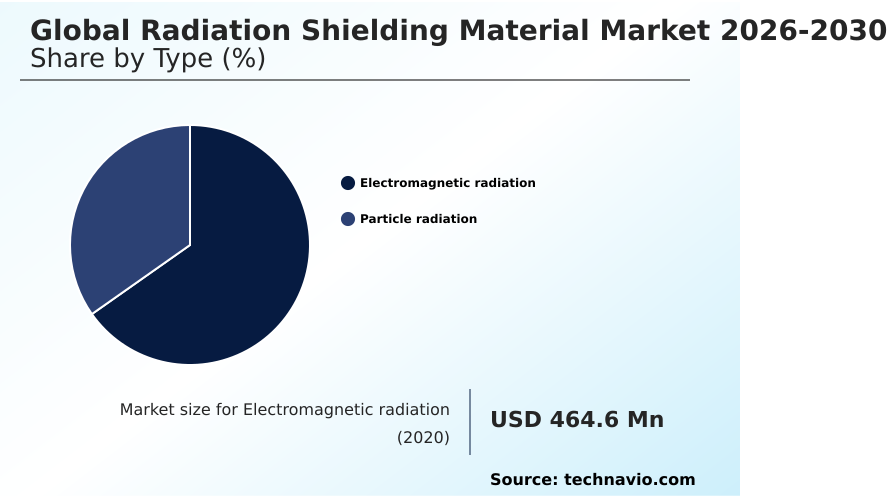
The electromagnetic radiation segment is estimated to witness significant growth during the forecast period.

The electromagnetic radiation segment commands the leading share of industry revenue, driven by expanding telecommunications infrastructure, rapid vehicle electrification, and high-density medical diagnostic imaging.

Materials such as flexible elastomer gaskets, synthetic EMI absorbers, and lead-equivalent vinyl sheets are specifically engineered to attenuate high-frequency radiofrequency interference and energetic ionizing photons.

In clinical environments, high-density heavy-metal compounds and cross-linked polymer composites shield medical staff and diagnostic equipment from stray ionizing X-ray and gamma ray attenuation.

To meet modern sustainability standards, material science manufacturers continuously innovate lead-free thermoplastic composites that offer high radiation attenuation coefficients while reducing overall component weight by up to 30%.

This weight reduction significantly improves ergonomic compliance for medical personnel without compromising safety, directly impacting operational efficiency in diagnostic radiology suites.
Get Free Sample

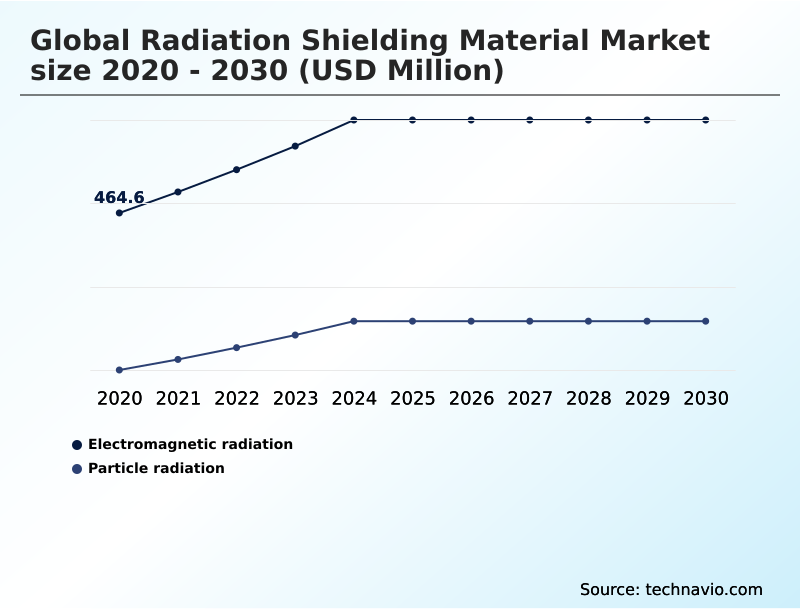
The Electromagnetic radiation segment was valued at USD 593.1 million in 2024 and showed a gradual increase during the forecast period.
Get Free Sample

Regional Analysis

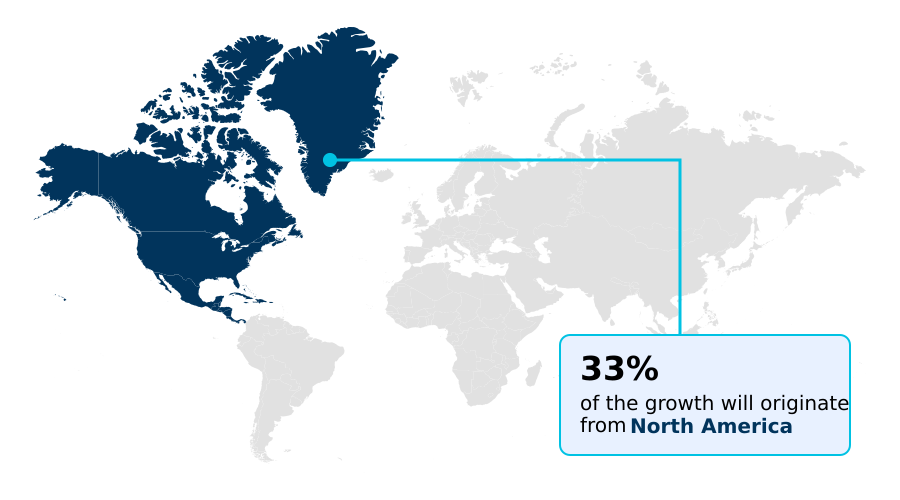
North America is estimated to contribute 33.2% to the growth of the global market during the forecast period.Technavio’s analysts have elaborately explained the regional trends and drivers that shape the market during the forecast period.
See How Radiation Shielding Material Market Demand is Rising in North America Get Free Sample

The geographic landscape of the Radiation Shielding Material Market reveals distinct regional adoption patterns driven by varying regulatory frameworks and healthcare investments.

North America maintains a dominant position due to its extensive diagnostic imaging infrastructure and stringent occupational safety compliance mandates, which have accelerated the deployment of non-lead polymer matrix composite aprons.

In contrast, the Asia region is experiencing rapid modernization of nuclear medicine hot labs, leading to a 40% higher adoption rate of high-density concrete and modular barium sulfate drywall partitions compared to European markets.

This aggressive infrastructure expansion in Asia has improved regional diagnostic throughput efficiency by 25%. Meanwhile, North American facilities have achieved a 20% reduction in hazardous waste disposal costs by prioritizing non-toxic material compositions and lead-free bismuth blend protective garments.

These regional disparities highlight how localized heavy metal toxicity mitigation policies directly influence supply chain procurement strategies and structural containment barriers.

Market Dynamics

Our researchers analyzed the data with 2025 as the base year, along with the key drivers, trends, and challenges. A holistic analysis of drivers will help companies refine their marketing strategies to gain a competitive advantage.

  • The operational landscape of the Radiation Shielding Material Market is increasingly defined by the integration of advanced, application-specific protective solutions. As healthcare facilities expand their oncology capabilities, the demand for targeted radiopharmaceutical therapy shielding suites has surged, necessitating the deployment of high-density concrete for nuclear reactors and specialized clinical bunkers.
  • To optimize safety in these high-exposure environments, medical centers are installing heavy-duty lead-lined modular rooms and utilizing radiation shielding glass for hot labs to ensure maximum visibility without compromising attenuation.
  • Concurrently, the shift toward ergonomic safety has driven the adoption of non-lead polymer matrix composite aprons and lead-free bismuth blend protective garments, which offer a 30% weight reduction compared to traditional alternatives, thereby improving staff endurance during lengthy procedures. In radiopharmacy settings, the use of tungsten-polymer composite syringe shields and high-purity tungsten alloy shields provides critical protection against high-energy isotopes.
  • Furthermore, facility upgrades frequently incorporate modular barium sulfate drywall partitions and lead-equivalent vinyl sheets for hospitals to streamline installation and ensure regulatory compliance. For specialized industrial and aerospace applications, engineers are leveraging borated polyethylene neutron shielding blocks, flexible silicone attenuation sheets, and synthetic EMI absorbers for electronics to mitigate complex radiation profiles.
  • The development of a hydrogen-based biomaterial polymer composite and the strategic use of encapsulated lead panels for radiography further illustrate the industry's commitment to innovation, ensuring robust protection across diverse operational environments.
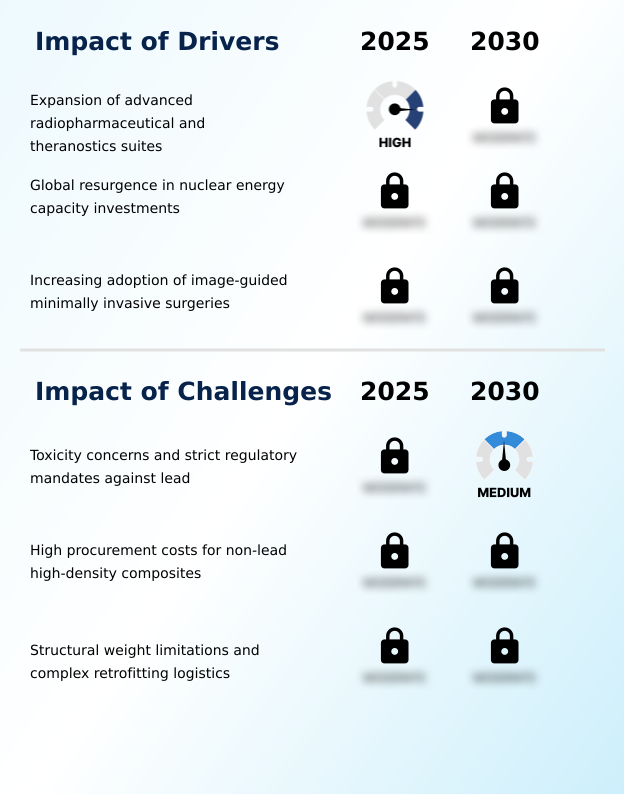
What are the key market drivers leading to the rise in the adoption of Radiation Shielding Material Industry?

  • The rapid global expansion of advanced radiopharmaceutical and theranostics suites serves as a primary macroeconomic driver propelling market growth.

  • The rapid global expansion of targeted radiopharmaceutical therapies and theranostics suites serves as a primary catalyst propelling the Radiation Shielding Material Market.
  • As healthcare providers deploy high-energy radioisotopes, the necessity for robust structural containment barriers has intensified, driving the procurement of high-density concrete and tungsten heavy alloy powders.
  • This clinical evolution has forced facilities to upgrade their diagnostic imaging infrastructure, resulting in a 40% increase in the installation of modular barium sulfate drywall partitions and radiation shielding glass.
  • Consequently, medical centers have improved their radioisotope decay storage efficiency by 25%, ensuring strict occupational safety compliance.
  • The continuous demand for high-purity rare earth oxides and encapsulated lead panels directly supports these infrastructure enhancements, enabling institutions to safely manage high-dose environments while maintaining uninterrupted clinical workflows.

What are the market trends shaping the Radiation Shielding Material Industry?

  • The commercial adoption of non-lead polymer matrix composites represents a defining trend transforming the industry. This shift is primarily driven by stringent environmental legislation and the need for lightweight, ergonomic personal protective equipment.

  • A defining trend reshaping the Radiation Shielding Material Market is the rapid commercial transition toward lightweight, non-toxic material compositions. Driven by stringent hazardous waste disposal mandates and the need to mitigate heavy metal toxicity, manufacturers are increasingly replacing traditional lead with advanced cross-linked polymer composites and flexible elastomer gaskets.
  • This material innovation has enabled healthcare facilities to reduce the weight of wearable personal protective equipment by up to 30%, directly decreasing musculoskeletal fatigue among medical staff and improving procedural efficiency by 18%. Furthermore, the integration of synthetic EMI absorbers and bio-composite shielding structures in aerospace applications has enhanced orbital performance testing reliability by 25%.
  • By adopting these advanced ionizing photon shielding solutions, organizations are effectively aligning their product strategies with evolving environmental regulations while simultaneously optimizing operational ergonomics and reducing long-term disposal liabilities.

What challenges does the Radiation Shielding Material Industry face during its growth?

  • Heightened toxicity concerns and strict regulatory mandates regarding traditional lead-based products present significant operational and commercial challenges for the industry.

  • Heightened toxicity concerns and strict regulatory mandates regarding traditional lead-based products present significant operational friction within the Radiation Shielding Material Market. Environmental protection authorities enforce rigorous radioactive waste segregation and hazardous waste disposal mandates, compelling facilities to implement costly lead abatement protocols.
  • These compliance requirements have increased facility renovation timelines by up to 20%, as specialized handling is required for sheet lead lining and heavy lead bricks. Furthermore, the high procurement costs associated with alternative non-lead polymer matrix composites and bismuth-borate glass formulations have elevated initial capital expenditures for diagnostic radiology suites by 15%.
  • Balancing the superior gamma ray attenuation of traditional materials against the rising compliance costs of heavy metal toxicity mitigation remains a critical structural limitation for equipment manufacturers and healthcare institutions alike.

Exclusive Technavio Analysis on Customer Landscape

The radiation shielding material market forecasting report includes the adoption lifecycle of the market, covering from the innovator’s stage to the laggard’s stage. It focuses on adoption rates in different regions based on penetration. Furthermore, the radiation shielding material market report also includes key purchase criteria and drivers of price sensitivity to help companies evaluate and develop their market growth analysis strategies.
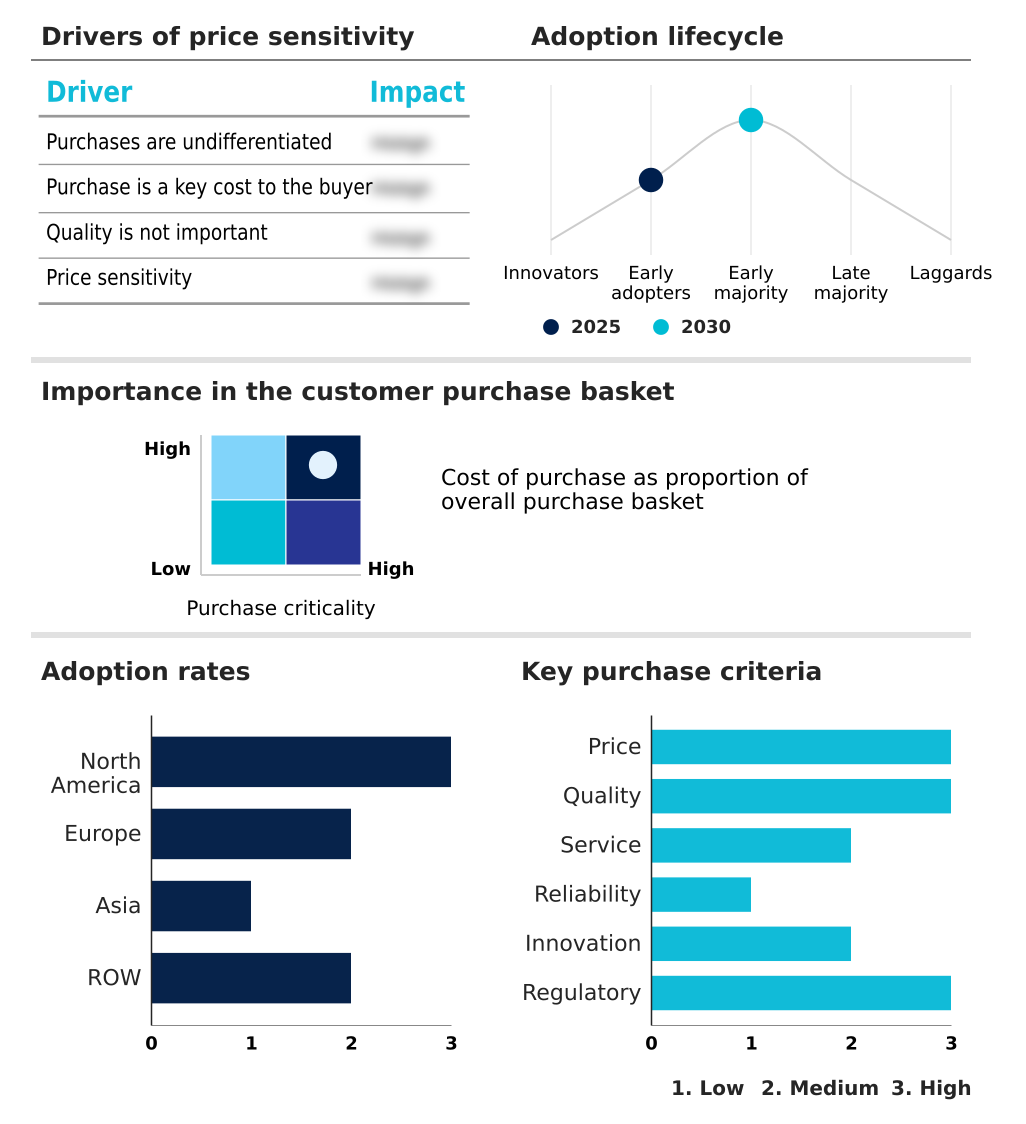
Customer Landscape of Radiation Shielding Material Industry

Competitive Landscape

Companies are implementing various strategies, such as strategic alliances, radiation shielding material market forecast, partnerships, mergers and acquisitions, geographical expansion, and product/service launches, to enhance their presence in the industry.

A and L Shielding - The portfolio features advanced radiation shielding material, including lead shielding sheets, lead-lined drywall, and radiation shielding doors, designed to ensure robust protection in high-exposure medical and industrial environments.

The industry research and growth report includes detailed analyses of the competitive landscape of the market and information about key companies, including:

  • A and L Shielding
  • Amray Medical
  • Burlington Medical
  • Clear Shield LLC
  • Corning Inc.
  • Dhaal India
  • Gravita India Ltd.
  • HRC Co. Ltd.
  • Infab Corp.
  • Lemer Pax
  • Mayco industries Inc.
  • NELCO
  • Nippon Electric Glass Ltd.
  • Nuclear Lead Co. Inc.
  • Nuclear Shields
  • Radiation Protection Products
  • Radiation Shielding
  • RadShield
  • RAY BAR Engineering Corp.
  • SCHOTT AG

Qualitative and quantitative analysis of companies has been conducted to help clients understand the wider business environment as well as the strengths and weaknesses of key industry players. Data is qualitatively analyzed to categorize companies as pure play, category-focused, industry-focused, and diversified; it is quantitatively analyzed to categorize companies as dominant, leading, strong, tentative, and weak.

Recent Development and News in Radiation shielding material market

  • In the Health Care Equipment industry, the rapid expansion of targeted radiopharmaceutical therapies and theranostics suites necessitated robust structural containment barriers, directly impacting Radiation Shielding Material demand by requiring high-density concrete and tungsten-polymer composite syringe shields to manage high-energy gamma emissions.
  • The enforcement of stringent occupational safety compliance mandates regarding heavy metal toxicity mitigation accelerated the transition toward non-toxic material compositions, driving the adoption of non-lead polymer matrix composite aprons that reduce ergonomic strain by 30%.
  • The widespread integration of positron emission tomography and mobile proton therapy systems across diagnostic imaging infrastructure increased the requirement for specialized neutron radiation blocking, elevating the consumption of borated polyethylene and modular barium sulfate drywall partitions.
  • The implementation of strict hazardous waste disposal mandates and radioactive waste segregation protocols for clinical environments forced facilities to adopt lead abatement protocols, stimulating the procurement of encapsulated lead panels and lead-free bismuth blend protective garments to ensure regulatory alignment.

Dive into Technavio’s robust research methodology, blending expert interviews, extensive data synthesis, and validated models for unparalleled Radiation Shielding Material Market insights. See full methodology.

Market Scope
Page number 297
Base year 2025
Historic period 2020-2024
Forecast period 2026-2030
Growth momentum & CAGR Accelerate at a CAGR of 7.7%
Market growth 2026-2030 USD 434.3 million
Market structure Fragmented
YoY growth 2025-2026(%) 7.0%
Key countries US, Canada, Mexico, Germany, UK, France, Italy, Spain, The Netherlands, China, Japan, India, South Korea, Indonesia, Thailand, Brazil, Saudi Arabia, UAE, Turkey, Argentina, South Africa, Colombia and Israel
Competitive landscape Leading Companies, Market Positioning of Companies, Competitive Strategies, and Industry Risks

Request Free Sample

Research Analyst Overview

  • The Radiation Shielding Material Market is undergoing a critical evolution as industries prioritize advanced ionizing photon shielding and stringent regulatory alignment. Boardroom executives are increasingly linking occupational safety compliance to strategic procurement decisions, driving a systemic shift away from traditional heavy metals toward cross-linked polymer composites and bismuth-borate glass formulations.
  • This transition is particularly evident in the deployment of bio-composite shielding structures and tungsten heavy alloy powders, which provide superior gamma ray attenuation without the associated environmental liabilities. By integrating these advanced materials, healthcare and industrial facilities have achieved a 30% reduction in ergonomic-related operational downtime, directly enhancing workforce productivity.
  • Furthermore, the utilization of sheet lead lining and heavy lead bricks remains foundational for structural integrity in high-dose environments, yet the focus is rapidly shifting toward sustainable alternatives. The continuous refinement of the radiation attenuation coefficient in new material formulations ensures that organizations can meet rigorous safety standards while optimizing their long-term infrastructure investments and mitigating hazardous waste disposal risks.

What are the Key Data Covered in this Radiation Shielding Material Market Research and Growth Report?

  • What is the expected growth of the Radiation Shielding Material Market between 2026 and 2030?

    • USD 434.3 million, at a CAGR of 7.7%

  • What segmentation does the market report cover?

    • The report is segmented by Type (Electromagnetic radiation, and Particle radiation), Material (Lead shielding, Lead composite shielding, Copper, Tungsten, and Others), End-user (Healthcare, Manufacturing, Construction, Energy, and Research) and Geography (North America, Europe, Asia, Rest of World (ROW))

  • Which regions are analyzed in the report?

    • North America, Europe, Asia and Rest of World (ROW)

  • What are the key growth drivers and market challenges?

    • Expansion of advanced radiopharmaceutical and theranostics suites, Toxicity concerns and strict regulatory mandates against lead

  • Who are the major players in the Radiation Shielding Material Market?

    • A and L Shielding, Amray Medical, Burlington Medical, Clear Shield LLC, Corning Inc., Dhaal India, Gravita India Ltd., HRC Co. Ltd., Infab Corp., Lemer Pax, Mayco industries Inc., NELCO, Nippon Electric Glass Ltd., Nuclear Lead Co. Inc., Nuclear Shields, Radiation Protection Products, Radiation Shielding, RadShield, RAY BAR Engineering Corp. and SCHOTT AG

Market Research Insights

  • The Radiation Shielding Material Market is rapidly evolving to meet stringent occupational safety compliance and heavy metal toxicity mitigation standards. Healthcare facilities are aggressively upgrading their diagnostic imaging infrastructure and nuclear medicine hot labs to accommodate advanced therapies. By transitioning to lightweight personal protective aprons, clinical centers have reduced musculoskeletal fatigue among staff by 30%, significantly enhancing procedural efficiency.
  • Furthermore, the implementation of space-grade radiation protection and orbital performance testing protocols has improved structural reliability by 25% in aerospace applications. This shift toward non-toxic material compositions ensures that institutions maintain robust structural containment barriers while achieving a 20% reduction in hazardous waste disposal costs, optimizing long-term operational sustainability.

We can help! Our analysts can customize this radiation shielding material market research report to meet your requirements.

Get in touch

1. Executive Summary

1.1 Market overview

Executive Summary - Chart on Market Overview
Executive Summary - Data Table on Market Overview
Executive Summary - Chart on Global Market Characteristics
Executive Summary - Chart on Market by Geography
Executive Summary - Chart on Market Segmentation by Type
Executive Summary - Chart on Market Segmentation by Material
Executive Summary - Chart on Market Segmentation by End-user
Executive Summary - Chart on Incremental Growth
Executive Summary - Data Table on Incremental Growth
Executive Summary - Chart on Company Market Positioning

2. Technavio Analysis

2.1 Analysis of price sensitivity, lifecycle, customer purchase basket, adoption rates, and purchase criteria

2.2 Criticality of inputs and Factors of differentiation

Chart on Overview on criticality of inputs and factors of differentiation

2.3 Factors of disruption

Chart on Overview on factors of disruption

2.4 Impact of drivers and challenges

Chart on Impact of drivers and challenges in 2025 and 2030

3. Market Landscape

3.1 Market ecosystem

Chart on Parent Market
Data Table on - Parent Market

3.2 Market characteristics

Chart on Market characteristics analysis

3.3 Value chain analysis

Chart on Value chain analysis

4. Market Sizing

4.1 Market definition

Data Table on Offerings of companies included in the market definition

4.2 Market segment analysis

Market segments

4.3 Market size 2025

4.4 Market outlook: Forecast for 2025-2030

Chart on Global - Market size and forecast 2025-2030 ($ million)
Data Table on Global - Market size and forecast 2025-2030 ($ million)
Chart on Global Market: Year-over-year growth 2025-2030 (%)
Data Table on Global Market: Year-over-year growth 2025-2030 (%)

5. Historic Market Size

5.1 Global Radiation Shielding Material Market 2020 - 2024

Historic Market Size - Data Table on Global Radiation Shielding Material Market 2020 - 2024 ($ million)

5.2 Type segment analysis 2020 - 2024

Historic Market Size - Type Segment 2020 - 2024 ($ million)

5.3 Material segment analysis 2020 - 2024

Historic Market Size - Material Segment 2020 - 2024 ($ million)

5.4 End-user segment analysis 2020 - 2024

Historic Market Size - End-user Segment 2020 - 2024 ($ million)

5.5 Geography segment analysis 2020 - 2024

Historic Market Size - Geography Segment 2020 - 2024 ($ million)

5.6 Country segment analysis 2020 - 2024

Historic Market Size - Country Segment 2020 - 2024 ($ million)

6. Qualitative Analysis

6.1 Impact of AI on global radiation shielding material market

6.2 Impact of geopolitical conflicts on global radiation shielding material market

7. Five Forces Analysis

7.1 Five forces summary

Five forces analysis - Comparison between 2025 and 2030

7.2 Bargaining power of buyers

Bargaining power of buyers - Impact of key factors 2025 and 2030

7.3 Bargaining power of suppliers

Bargaining power of suppliers - Impact of key factors in 2025 and 2030

7.4 Threat of new entrants

Threat of new entrants - Impact of key factors in 2025 and 2030

7.5 Threat of substitutes

Threat of substitutes - Impact of key factors in 2025 and 2030

7.6 Threat of rivalry

Threat of rivalry - Impact of key factors in 2025 and 2030

7.7 Market condition

Chart on Market condition - Five forces 2025 and 2030

8. Market Segmentation by Type

8.1 Market segments

Chart on Type - Market share 2025-2030 (%)
Data Table on Type - Market share 2025-2030 (%)

8.2 Comparison by Type

Chart on Comparison by Type
Data Table on Comparison by Type

8.3 Electromagnetic radiation - Market size and forecast 2025-2030

Chart on Electromagnetic radiation - Market size and forecast 2025-2030 ($ million)
Data Table on Electromagnetic radiation - Market size and forecast 2025-2030 ($ million)
Chart on Electromagnetic radiation - Year-over-year growth 2025-2030 (%)
Data Table on Electromagnetic radiation - Year-over-year growth 2025-2030 (%)

8.4 Particle radiation - Market size and forecast 2025-2030

Chart on Particle radiation - Market size and forecast 2025-2030 ($ million)
Data Table on Particle radiation - Market size and forecast 2025-2030 ($ million)
Chart on Particle radiation - Year-over-year growth 2025-2030 (%)
Data Table on Particle radiation - Year-over-year growth 2025-2030 (%)

8.5 Market opportunity by Type

Market opportunity by Type ($ million)
Data Table on Market opportunity by Type ($ million)

9. Market Segmentation by Material

9.1 Market segments

Chart on Material - Market share 2025-2030 (%)
Data Table on Material - Market share 2025-2030 (%)

9.2 Comparison by Material

Chart on Comparison by Material
Data Table on Comparison by Material

9.3 Lead shielding - Market size and forecast 2025-2030

Chart on Lead shielding - Market size and forecast 2025-2030 ($ million)
Data Table on Lead shielding - Market size and forecast 2025-2030 ($ million)
Chart on Lead shielding - Year-over-year growth 2025-2030 (%)
Data Table on Lead shielding - Year-over-year growth 2025-2030 (%)

9.4 Lead composite shielding - Market size and forecast 2025-2030

Chart on Lead composite shielding - Market size and forecast 2025-2030 ($ million)
Data Table on Lead composite shielding - Market size and forecast 2025-2030 ($ million)
Chart on Lead composite shielding - Year-over-year growth 2025-2030 (%)
Data Table on Lead composite shielding - Year-over-year growth 2025-2030 (%)

9.5 Copper - Market size and forecast 2025-2030

Chart on Copper - Market size and forecast 2025-2030 ($ million)
Data Table on Copper - Market size and forecast 2025-2030 ($ million)
Chart on Copper - Year-over-year growth 2025-2030 (%)
Data Table on Copper - Year-over-year growth 2025-2030 (%)

9.6 Tungsten - Market size and forecast 2025-2030

Chart on Tungsten - Market size and forecast 2025-2030 ($ million)
Data Table on Tungsten - Market size and forecast 2025-2030 ($ million)
Chart on Tungsten - Year-over-year growth 2025-2030 (%)
Data Table on Tungsten - Year-over-year growth 2025-2030 (%)

9.7 Others - Market size and forecast 2025-2030

Chart on Others - Market size and forecast 2025-2030 ($ million)
Data Table on Others - Market size and forecast 2025-2030 ($ million)
Chart on Others - Year-over-year growth 2025-2030 (%)
Data Table on Others - Year-over-year growth 2025-2030 (%)

9.8 Market opportunity by Material

Market opportunity by Material ($ million)
Data Table on Market opportunity by Material ($ million)

10. Market Segmentation by End-user

10.1 Market segments

Chart on End-user - Market share 2025-2030 (%)
Data Table on End-user - Market share 2025-2030 (%)

10.2 Comparison by End-user

Chart on Comparison by End-user
Data Table on Comparison by End-user

10.3 Healthcare - Market size and forecast 2025-2030

Chart on Healthcare - Market size and forecast 2025-2030 ($ million)
Data Table on Healthcare - Market size and forecast 2025-2030 ($ million)
Chart on Healthcare - Year-over-year growth 2025-2030 (%)
Data Table on Healthcare - Year-over-year growth 2025-2030 (%)

10.4 Manufacturing - Market size and forecast 2025-2030

Chart on Manufacturing - Market size and forecast 2025-2030 ($ million)
Data Table on Manufacturing - Market size and forecast 2025-2030 ($ million)
Chart on Manufacturing - Year-over-year growth 2025-2030 (%)
Data Table on Manufacturing - Year-over-year growth 2025-2030 (%)

10.5 Construction - Market size and forecast 2025-2030

Chart on Construction - Market size and forecast 2025-2030 ($ million)
Data Table on Construction - Market size and forecast 2025-2030 ($ million)
Chart on Construction - Year-over-year growth 2025-2030 (%)
Data Table on Construction - Year-over-year growth 2025-2030 (%)

10.6 Energy - Market size and forecast 2025-2030

Chart on Energy - Market size and forecast 2025-2030 ($ million)
Data Table on Energy - Market size and forecast 2025-2030 ($ million)
Chart on Energy - Year-over-year growth 2025-2030 (%)
Data Table on Energy - Year-over-year growth 2025-2030 (%)

10.7 Research - Market size and forecast 2025-2030

Chart on Research - Market size and forecast 2025-2030 ($ million)
Data Table on Research - Market size and forecast 2025-2030 ($ million)
Chart on Research - Year-over-year growth 2025-2030 (%)
Data Table on Research - Year-over-year growth 2025-2030 (%)

10.8 Market opportunity by End-user

Market opportunity by End-user ($ million)
Data Table on Market opportunity by End-user ($ million)

11. Customer Landscape

11.1 Customer landscape overview

Analysis of price sensitivity, lifecycle, customer purchase basket, adoption rates, and purchase criteria

12. Geographic Landscape

12.1 Geographic segmentation

Chart on Market share by geography 2025-2030 (%)
Data Table on Market share by geography 2025-2030 (%)

12.2 Geographic comparison

Chart on Geographic comparison
Data Table on Geographic comparison

12.3 North America - Market size and forecast 2025-2030

Chart on North America - Market size and forecast 2025-2030 ($ million)
Data Table on North America - Market size and forecast 2025-2030 ($ million)
Chart on North America - Year-over-year growth 2025-2030 (%)
Data Table on North America - Year-over-year growth 2025-2030 (%)
Chart on Regional Comparison - North America
Data Table on Regional Comparison - North America

12.3.1 US - Market size and forecast 2025-2030

Chart on US - Market size and forecast 2025-2030 ($ million)
Data Table on US - Market size and forecast 2025-2030 ($ million)
Chart on US - Year-over-year growth 2025-2030 (%)
Data Table on US - Year-over-year growth 2025-2030 (%)

12.3.2 Canada - Market size and forecast 2025-2030

Chart on Canada - Market size and forecast 2025-2030 ($ million)
Data Table on Canada - Market size and forecast 2025-2030 ($ million)
Chart on Canada - Year-over-year growth 2025-2030 (%)
Data Table on Canada - Year-over-year growth 2025-2030 (%)

12.3.3 Mexico - Market size and forecast 2025-2030

Chart on Mexico - Market size and forecast 2025-2030 ($ million)
Data Table on Mexico - Market size and forecast 2025-2030 ($ million)
Chart on Mexico - Year-over-year growth 2025-2030 (%)
Data Table on Mexico - Year-over-year growth 2025-2030 (%)

12.4 Europe - Market size and forecast 2025-2030

Chart on Europe - Market size and forecast 2025-2030 ($ million)
Data Table on Europe - Market size and forecast 2025-2030 ($ million)
Chart on Europe - Year-over-year growth 2025-2030 (%)
Data Table on Europe - Year-over-year growth 2025-2030 (%)
Chart on Regional Comparison - Europe
Data Table on Regional Comparison - Europe

12.4.1 Germany - Market size and forecast 2025-2030

Chart on Germany - Market size and forecast 2025-2030 ($ million)
Data Table on Germany - Market size and forecast 2025-2030 ($ million)
Chart on Germany - Year-over-year growth 2025-2030 (%)
Data Table on Germany - Year-over-year growth 2025-2030 (%)

12.4.2 UK - Market size and forecast 2025-2030

Chart on UK - Market size and forecast 2025-2030 ($ million)
Data Table on UK - Market size and forecast 2025-2030 ($ million)
Chart on UK - Year-over-year growth 2025-2030 (%)
Data Table on UK - Year-over-year growth 2025-2030 (%)

12.4.3 France - Market size and forecast 2025-2030

Chart on France - Market size and forecast 2025-2030 ($ million)
Data Table on France - Market size and forecast 2025-2030 ($ million)
Chart on France - Year-over-year growth 2025-2030 (%)
Data Table on France - Year-over-year growth 2025-2030 (%)

12.4.4 Italy - Market size and forecast 2025-2030

Chart on Italy - Market size and forecast 2025-2030 ($ million)
Data Table on Italy - Market size and forecast 2025-2030 ($ million)
Chart on Italy - Year-over-year growth 2025-2030 (%)
Data Table on Italy - Year-over-year growth 2025-2030 (%)

12.4.5 Spain - Market size and forecast 2025-2030

Chart on Spain - Market size and forecast 2025-2030 ($ million)
Data Table on Spain - Market size and forecast 2025-2030 ($ million)
Chart on Spain - Year-over-year growth 2025-2030 (%)
Data Table on Spain - Year-over-year growth 2025-2030 (%)

12.4.6 The Netherlands - Market size and forecast 2025-2030

Chart on The Netherlands - Market size and forecast 2025-2030 ($ million)
Data Table on The Netherlands - Market size and forecast 2025-2030 ($ million)
Chart on The Netherlands - Year-over-year growth 2025-2030 (%)
Data Table on The Netherlands - Year-over-year growth 2025-2030 (%)

12.5 Asia - Market size and forecast 2025-2030

Chart on Asia - Market size and forecast 2025-2030 ($ million)
Data Table on Asia - Market size and forecast 2025-2030 ($ million)
Chart on Asia - Year-over-year growth 2025-2030 (%)
Data Table on Asia - Year-over-year growth 2025-2030 (%)
Chart on Regional Comparison - Asia
Data Table on Regional Comparison - Asia

12.5.1 China - Market size and forecast 2025-2030

Chart on China - Market size and forecast 2025-2030 ($ million)
Data Table on China - Market size and forecast 2025-2030 ($ million)
Chart on China - Year-over-year growth 2025-2030 (%)
Data Table on China - Year-over-year growth 2025-2030 (%)

12.5.2 Japan - Market size and forecast 2025-2030

Chart on Japan - Market size and forecast 2025-2030 ($ million)
Data Table on Japan - Market size and forecast 2025-2030 ($ million)
Chart on Japan - Year-over-year growth 2025-2030 (%)
Data Table on Japan - Year-over-year growth 2025-2030 (%)

12.5.3 India - Market size and forecast 2025-2030

Chart on India - Market size and forecast 2025-2030 ($ million)
Data Table on India - Market size and forecast 2025-2030 ($ million)
Chart on India - Year-over-year growth 2025-2030 (%)
Data Table on India - Year-over-year growth 2025-2030 (%)

12.5.4 South Korea - Market size and forecast 2025-2030

Chart on South Korea - Market size and forecast 2025-2030 ($ million)
Data Table on South Korea - Market size and forecast 2025-2030 ($ million)
Chart on South Korea - Year-over-year growth 2025-2030 (%)
Data Table on South Korea - Year-over-year growth 2025-2030 (%)

12.5.5 Indonesia - Market size and forecast 2025-2030

Chart on Indonesia - Market size and forecast 2025-2030 ($ million)
Data Table on Indonesia - Market size and forecast 2025-2030 ($ million)
Chart on Indonesia - Year-over-year growth 2025-2030 (%)
Data Table on Indonesia - Year-over-year growth 2025-2030 (%)

12.5.6 Thailand - Market size and forecast 2025-2030

Chart on Thailand - Market size and forecast 2025-2030 ($ million)
Data Table on Thailand - Market size and forecast 2025-2030 ($ million)
Chart on Thailand - Year-over-year growth 2025-2030 (%)
Data Table on Thailand - Year-over-year growth 2025-2030 (%)

12.6 Rest of World (ROW) - Market size and forecast 2025-2030

Chart on Rest of World (ROW) - Market size and forecast 2025-2030 ($ million)
Data Table on Rest of World (ROW) - Market size and forecast 2025-2030 ($ million)
Chart on Rest of World (ROW) - Year-over-year growth 2025-2030 (%)
Data Table on Rest of World (ROW) - Year-over-year growth 2025-2030 (%)
Chart on Regional Comparison - Rest of World (ROW)
Data Table on Regional Comparison - Rest of World (ROW)

12.6.1 Brazil - Market size and forecast 2025-2030

Chart on Brazil - Market size and forecast 2025-2030 ($ million)
Data Table on Brazil - Market size and forecast 2025-2030 ($ million)
Chart on Brazil - Year-over-year growth 2025-2030 (%)
Data Table on Brazil - Year-over-year growth 2025-2030 (%)

12.6.2 Saudi Arabia - Market size and forecast 2025-2030

Chart on Saudi Arabia - Market size and forecast 2025-2030 ($ million)
Data Table on Saudi Arabia - Market size and forecast 2025-2030 ($ million)
Chart on Saudi Arabia - Year-over-year growth 2025-2030 (%)
Data Table on Saudi Arabia - Year-over-year growth 2025-2030 (%)

12.6.3 UAE - Market size and forecast 2025-2030

Chart on UAE - Market size and forecast 2025-2030 ($ million)
Data Table on UAE - Market size and forecast 2025-2030 ($ million)
Chart on UAE - Year-over-year growth 2025-2030 (%)
Data Table on UAE - Year-over-year growth 2025-2030 (%)

12.6.4 Turkey - Market size and forecast 2025-2030

Chart on Turkey - Market size and forecast 2025-2030 ($ million)
Data Table on Turkey - Market size and forecast 2025-2030 ($ million)
Chart on Turkey - Year-over-year growth 2025-2030 (%)
Data Table on Turkey - Year-over-year growth 2025-2030 (%)

12.6.5 Argentina - Market size and forecast 2025-2030

Chart on Argentina - Market size and forecast 2025-2030 ($ million)
Data Table on Argentina - Market size and forecast 2025-2030 ($ million)
Chart on Argentina - Year-over-year growth 2025-2030 (%)
Data Table on Argentina - Year-over-year growth 2025-2030 (%)

12.6.6 South Africa - Market size and forecast 2025-2030

Chart on South Africa - Market size and forecast 2025-2030 ($ million)
Data Table on South Africa - Market size and forecast 2025-2030 ($ million)
Chart on South Africa - Year-over-year growth 2025-2030 (%)
Data Table on South Africa - Year-over-year growth 2025-2030 (%)

12.6.7 Colombia - Market size and forecast 2025-2030

Chart on Colombia - Market size and forecast 2025-2030 ($ million)
Data Table on Colombia - Market size and forecast 2025-2030 ($ million)
Chart on Colombia - Year-over-year growth 2025-2030 (%)
Data Table on Colombia - Year-over-year growth 2025-2030 (%)

12.6.8 Israel - Market size and forecast 2025-2030

Chart on Israel - Market size and forecast 2025-2030 ($ million)
Data Table on Israel - Market size and forecast 2025-2030 ($ million)
Chart on Israel - Year-over-year growth 2025-2030 (%)
Data Table on Israel - Year-over-year growth 2025-2030 (%)

12.7 Market opportunity by geography

Market opportunity by geography ($ million)
Data Tables on Market opportunity by geography ($ million)

13. Drivers, Challenges, and Opportunity

13.1 Market drivers

Expansion of advanced radiopharmaceutical and theranostics suites
Global resurgence in nuclear energy capacity investments
Increasing adoption of image-guided minimally invasive surgeries

13.2 Market challenges

Toxicity concerns and strict regulatory mandates against lead
High procurement costs for non-lead high-density composites
Structural weight limitations and complex retrofitting logistics

13.3 Impact of drivers and challenges

Impact of drivers and challenges in 2025 and 2030

13.4 Market opportunities

Commercial adoption of non-lead polymer matrix composites
Integration of turnkey modular shielding in cyclotron facilities
Pivoting toward specialized boronated polyethylene for neutron shielding

14. Competitive Landscape

14.1 Overview

14.2

Overview on criticality of inputs and factors of differentiation

14.3 Landscape disruption

Overview on factors of disruption

14.4 Industry risks

Impact of key risks on business

15. Competitive Analysis

15.1 Companies profiled

Companies covered

15.2 Company ranking index

15.3 Market positioning of companies

Matrix on companies position and classification

15.4 A and L Shielding

A and L Shielding - Overview
A and L Shielding - Product / Service
A and L Shielding - Key offerings
SWOT

15.5 Amray Medical

Amray Medical - Overview
Amray Medical - Product / Service
Amray Medical - Key offerings
SWOT

15.6 Burlington Medical

Burlington Medical - Overview
Burlington Medical - Product / Service
Burlington Medical - Key offerings
SWOT

15.7 Clear Shield LLC

Clear Shield LLC - Overview
Clear Shield LLC - Product / Service
Clear Shield LLC - Key offerings
SWOT

15.8 Corning Inc.

Corning Inc. - Overview
Corning Inc. - Business segments
Corning Inc. - Key offerings
Corning Inc. - Segment focus
SWOT

15.9 Dhaal India

Dhaal India - Overview
Dhaal India - Product / Service
Dhaal India - Key offerings
SWOT

15.10 Gravita India Ltd.

Gravita India Ltd. - Overview
Gravita India Ltd. - Business segments
Gravita India Ltd. - Key offerings
Gravita India Ltd. - Segment focus
SWOT

15.11 HRC Co. Ltd.

HRC Co. Ltd. - Overview
HRC Co. Ltd. - Product / Service
HRC Co. Ltd. - Key offerings
SWOT

15.12 Infab Corp.

Infab Corp. - Overview
Infab Corp. - Product / Service
Infab Corp. - Key offerings
SWOT

15.13 Lemer Pax

Lemer Pax - Overview
Lemer Pax - Product / Service
Lemer Pax - Key offerings
SWOT

15.14 Mayco industries Inc.

Mayco industries Inc. - Overview
Mayco industries Inc. - Product / Service
Mayco industries Inc. - Key offerings
SWOT

15.15 NELCO

NELCO - Overview
NELCO - Product / Service
NELCO - Key offerings
SWOT

15.16 Nippon Electric Glass Ltd.

Nippon Electric Glass Ltd. - Overview
Nippon Electric Glass Ltd. - Product / Service
Nippon Electric Glass Ltd. - Key offerings
SWOT

15.17 Radiation Protection Products

Radiation Protection Products - Overview
Radiation Protection Products - Product / Service
Radiation Protection Products - Key offerings
SWOT

15.18 SCHOTT AG

SCHOTT AG - Overview
SCHOTT AG - Product / Service
SCHOTT AG - Key offerings
SWOT

16. Appendix

16.1 Scope of the report

Market definition
Objectives
Notes and caveats

16.2 Inclusions and exclusions checklist

Inclusions checklist
Exclusions checklist

16.3 Currency conversion rates for US$

16.4 Research methodology

16.5 Data procurement

Information sources

16.6 Data validation

16.7 Validation techniques employed for market sizing

16.8 Data synthesis

16.9 360 degree market analysis

16.10 List of abbreviations

Research Methodology

Technavio presents a detailed picture of the market by way of study, synthesis, and summation of data from multiple sources. The analysts have presented the various facets of the market with a particular focus on identifying the key industry influencers. The data thus presented is comprehensive, reliable, and the result of extensive research, both primary and secondary.

INFORMATION SOURCES

Primary sources

  • Manufacturers and suppliers
  • Channel partners
  • Industry experts
  • Strategic decision makers

Secondary sources

  • Industry journals and periodicals
  • Government data
  • Financial reports of key industry players
  • Historical data
  • Press releases

DATA ANALYSIS

Data Synthesis

  • Collation of data
  • Estimation of key figures
  • Analysis of derived insights

Data Validation

  • Triangulation with data models
  • Reference against proprietary databases
  • Corroboration with industry experts

REPORT WRITING

Qualitative

  • Market drivers
  • Market challenges
  • Market trends
  • Five forces analysis

Quantitative

  • Market size and forecast
  • Market segmentation
  • Geographical insights
  • Competitive landscape

Interested in this report?

Get your sample now to see our research methodology and insights!

Download Now

Frequently Asked Questions

Radiation Shielding Material market growth will increase by USD 434.3 million during 2026-2030.

The Radiation Shielding Material market is expected to grow at a CAGR of 7.7% during 2026-2030.

Radiation Shielding Material market is segmented by Type (Electromagnetic radiation, Particle radiation) Material (Lead shielding, Lead composite shielding, Copper, Tungsten, Others) End-user (Healthcare, Manufacturing, Construction, Energy, Research)

A and L Shielding, Amray Medical, Burlington Medical, Clear Shield LLC, Corning Inc., Dhaal India, Gravita India Ltd., HRC Co. Ltd., Infab Corp., Lemer Pax, Mayco industries Inc., NELCO, Nippon Electric Glass Ltd., Nuclear Lead Co. Inc., Nuclear Shields, Radiation Protection Products, Radiation Shielding, RadShield, RAY BAR Engineering Corp., SCHOTT AG are a few of the key vendors in the Radiation Shielding Material market.

North America will register the highest growth rate of 33.2% among the other regions. Therefore, the Radiation Shielding Material market in North America is expected to garner significant business opportunities for the vendors during the forecast period.

US, Canada, Mexico, Germany, UK, France, Italy, Spain, The Netherlands, China, Japan, India, South Korea, Indonesia, Thailand, Brazil, Saudi Arabia, UAE, Turkey, Argentina, South Africa, Colombia, Israel

  • Expansion of advanced radiopharmaceutical and theranostics suites is the driving factor this market.

The Radiation Shielding Material market vendors should focus on grabbing business opportunities from the Type segment as it accounted for the largest market share in the base year.
RIA - Research AI Assistant
Ask RIA
