
Real Estate Software Market Analysis, Size, and Forecast 2026-2030: North America (US, Canada, and Mexico), Europe (Germany, UK, and France), APAC (China, Japan, and India), South America (Brazil, Argentina, and Chile), Middle East and Africa (Saudi Arabia, UAE, and South Africa), and Rest of World (ROW)

Real Estate Software Market Analysis, Size, and Forecast 2026-2030:
North America (US, Canada, and Mexico), Europe (Germany, UK, and France), APAC (China, Japan, and India), South America (Brazil, Argentina, and Chile), Middle East and Africa (Saudi Arabia, UAE, and South Africa), and Rest of World (ROW)

Published: Oct 2026 301 Pages SKU: IRTNTR40543

Market Overview at a Glance

$9.48 B
Market Opportunity
11%
CAGR 2025 - 2030
31%
North America Growth
$7.90 B
Cloud-based segment 2024

Real Estate Software Market Size 2026-2030

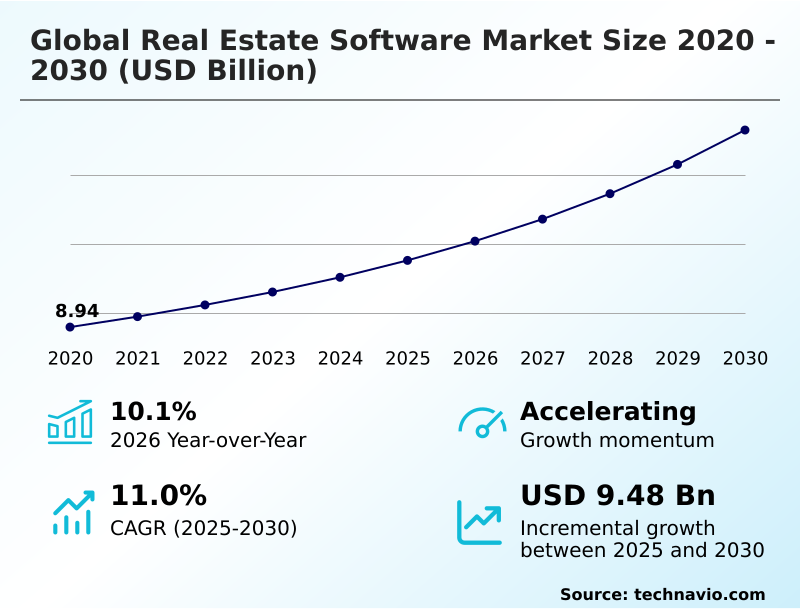
The real estate software market size is valued to increase by USD 9.48 billion, at a CAGR of 11% from 2025 to 2030. Adoption of AI tools will drive the real estate software market.

Major Market Trends & Insights

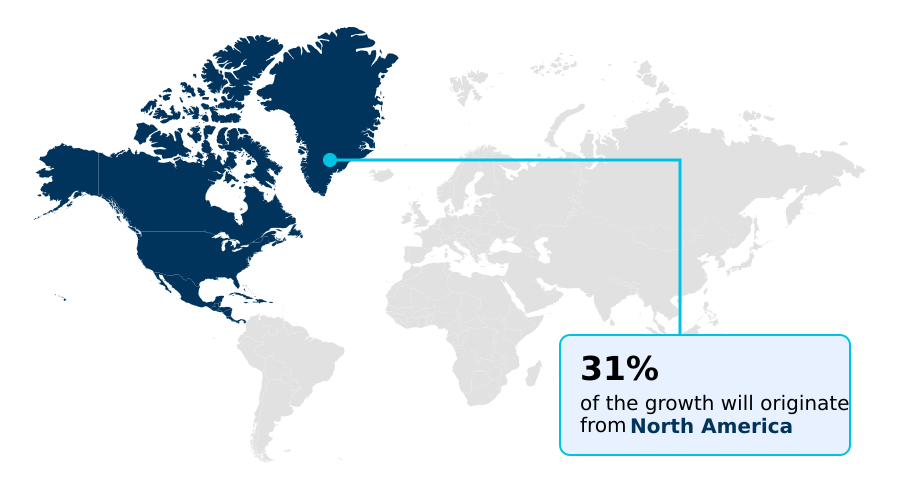
  • North America dominated the market and accounted for a 31% growth during the forecast period.
  • By Deployment - Cloud-based segment was valued at USD 7.90 billion in 2024
  • By Application - Residential segment accounted for the largest market revenue share in 2024

Market Size & Forecast

  • Market Opportunities: USD 14.33 billion
  • Market Future Opportunities: USD 9.48 billion
  • CAGR from 2025 to 2030 : 11%

Market Summary

  • The Real Estate Software Market exhibits robust expansion driven by the rapid transition toward centralized digital workflows and intelligent property analytics. Modern asset managers increasingly rely on cloud-based ecosystems to oversee multi-family residential units and sprawling commercial complexes, replacing isolated legacy systems with unified operational dashboards.
  • By adopting advanced property platforms, large-scale commercial operators optimized their supply chain logistics for facility maintenance, resulting in operational overhead costs dropping by 22% compared to manual scheduling processes. This transformation is heavily propelled by the continuous integration of artificial intelligence tools, which actively interpret large datasets to predict market trends and automate routine tenant communications.
  • Conversely, substantial implementation complexity and high switching costs pose a notable operational challenge, as migrating decades of historical financial records to modern architectures requires intensive data cleansing and extensive employee retraining. Nevertheless, the continuous demand for rigorous sustainability reporting and automated rent collections ensures that comprehensive digital solutions remain indispensable for maximizing long-term asset valuations.

What will be the Size of the Real Estate Software Market during the forecast period?
Get Key Insights on Market Forecast (PDF) Get Free Sample

How is the Real Estate Software Market Segmented?

The real estate software industry research report provides comprehensive data (region-wise segment analysis), with forecasts and estimates in "USD million" for the period 2026-2030, as well as historical data from 2020-2024 for the following segments.

  • Deployment
    • Cloud-based
    • On-premises
  • Application
    • Residential
    • Commercial
  • Type
    • Property management software
    • ERP software
    • CRM software
    • Contract software
    • Others
  • Geography
    • North America
      • US
      • Canada
      • Mexico
    • Europe
      • Germany
      • UK
      • France
      • Italy
      • Spain
      • The Netherlands
    • APAC
      • China
      • Japan
      • India
      • Australia
      • South Korea
      • Indonesia
    • South America
      • Brazil
      • Argentina
      • Chile
    • Middle East and Africa
      • Saudi Arabia
      • UAE
      • South Africa
      • Israel
      • Turkey

By Deployment Insights

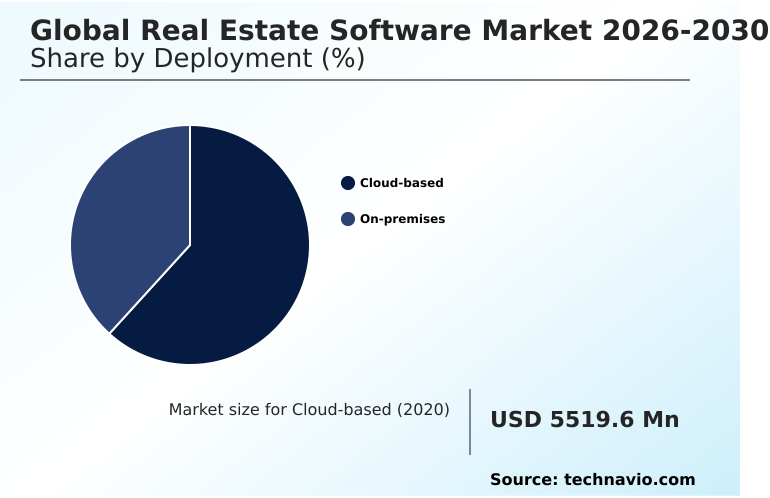
The cloud-based segment is estimated to witness significant growth during the forecast period.

Cloud-based infrastructure represents the dominant architectural framework reshaping how operational workflows are executed across property portfolios. Organizations increasingly transition to centralized platforms, utilizing machine learning integration to evaluate large datasets and execute predictive rent forecasting with high precision.

This architectural shift enables automated lease abstraction and sophisticated multi-entity accounting, directly accelerating transaction velocity. By leveraging cloud environments, asset managers achieve seamless electronic signature integration and efficient work order dispatching, which ensures rapid response times for critical maintenance.

Consequently, firms utilizing centralized digital escrow automation and vendor compliance tracking report that contract processing errors decreased by 14% across high-volume commercial portfolios. Ultimately, CAM reconciliation engines function far more reliably within cloud-native systems, granting financial controllers unparalleled administrative control.
Get Free Sample

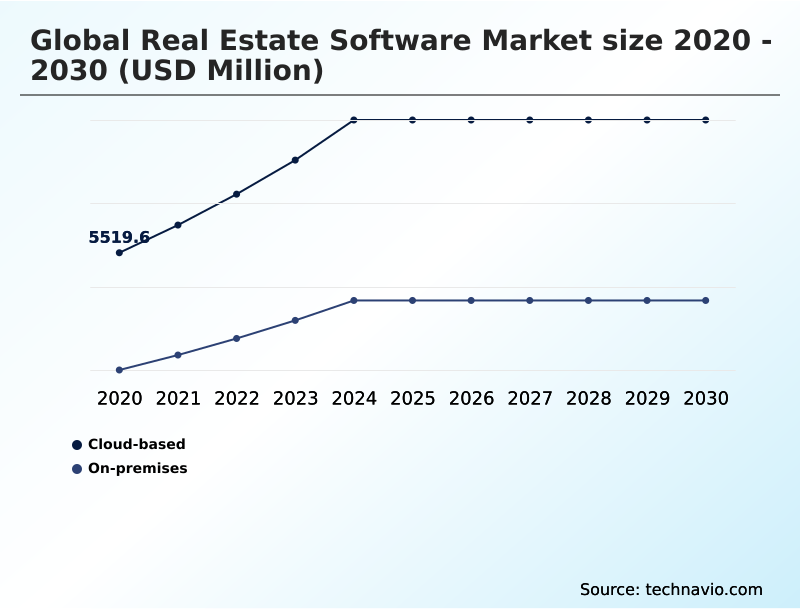
The Cloud-based segment was valued at USD 7.90 billion in 2024 and showed a gradual increase during the forecast period.
Get Free Sample

Regional Analysis

North America is estimated to contribute 31% to the growth of the global market during the forecast period.Technavio’s analysts have elaborately explained the regional trends and drivers that shape the market during the forecast period.
See How Real Estate Software Market Demand is Rising in North America Get Free Sample

The geographic distribution of the real estate software sector reveals distinct regional adoption strategies shaped by regulatory pressures and technological maturity.

North America consistently outpaces Europe in deploying advanced property portfolio analytics, capturing a 31% higher volume of cloud-based integrations across large-scale commercial developments.

This disparity stems from intense competitive pressure in North American urban centers, driving asset managers to heavily utilize tenant engagement portals and tenant retention strategies to maximize yield.

Conversely, European markets prioritize rigorous ESG compliance frameworks and strict carbon emission reporting, leading to a 28% increase in the deployment of specialized facility lifecycle management modules to meet regulatory benchmarks.

To manage these diverse requirements, multinational firms rely on multi-currency accounting and real-time financial dashboards, which successfully reduce cross-border reporting discrepancies by 17%.

By adapting their strategies to local legal and environmental mandates, organizations achieve optimal occupancy rate optimization while ensuring seamless adherence to varied international standards.

Market Dynamics

Our researchers analyzed the data with 2025 as the base year, along with the key drivers, trends, and challenges. A holistic analysis of drivers will help companies refine their marketing strategies to gain a competitive advantage.

  • The integration of sophisticated digital infrastructure fundamentally alters how large-scale property assets are operated, monitored, and monetized globally. Asset operators recognize that fragmented legacy databases can no longer support the rapid decision-making required in today's competitive environment.
  • Consequently, enterprise-grade commercial real estate portfolio management solutions have become indispensable for institutional investors seeking to balance risk, evaluate market trends, and maximize overall asset yields. Simultaneously, organizations specializing in high-density housing developments heavily rely on specialized multi-family residential property accounting systems to streamline complex rent ledgers, manage security deposits, and ensure absolute financial transparency.
  • When property managers deploy comprehensive IoT based building maintenance systems, they successfully lower facility energy consumption and mechanical repair costs by nearly 20% compared to traditional reactive maintenance schedules. This strategic technological adoption directly enhances supply chain predictability for replacement parts and optimizing technician dispatch routes.
  • Furthermore, the implementation of automated lease administration and abstraction tools mitigates critical legal risks by rapidly identifying obscure contractual clauses and critical renewal deadlines hidden within massive document archives. To complete this digital ecosystem, modern brokerages continuously leverage cloud deployed tenant relationship platforms, which drastically improve communication transparency and expedite routine service requests.
  • Ultimately, the synergistic application of these specialized software tools ensures operational resilience, prolonged asset lifecycles, and sustained profitability across diverse property networks.
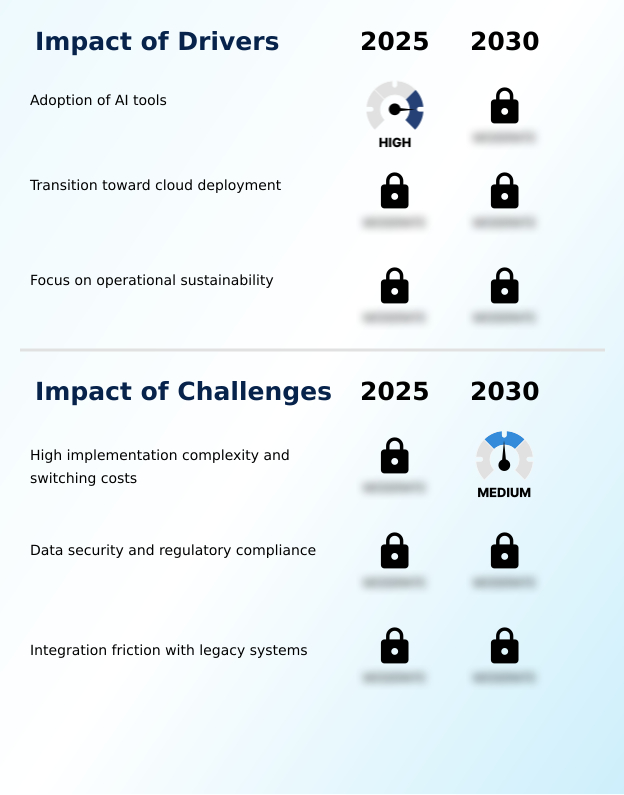
What are the key market drivers leading to the rise in the adoption of Real Estate Software Industry?

  • The widespread adoption of artificial intelligence tools serves as a primary catalyst accelerating market expansion.

  • Organizations are rapidly expanding their digital capabilities as the necessity for centralized portfolio oversight and accelerated transaction velocity intensifies globally. The fundamental shift toward cloud-native architecture serves as a primary catalyst, eliminating the geographical constraints associated with localized servers.
  • By implementing flexible SaaS deployment models and mobile-optimized applications, property managers empower their field agents to access critical operational data instantaneously, which has reduced administrative processing delays by 22%.
  • Furthermore, intense market competition compels brokerages to utilize predictive pricing analytics and commercial real estate intelligence, boosting their lead conversion rates by 15%.
  • This modernization is strongly supported by automated workflow agents and conversational virtual assistants that handle initial inquiries seamlessly. Ultimately, deploying advanced tenant screening algorithms, automated rent collection, and automated lead prioritization actively safeguards institutional revenues against market volatility.

What are the market trends shaping the Real Estate Software Industry?

  • The adoption of digital twin technology serves as a prominent emerging trend within the market. This advanced virtual replication enables operators to proactively manage structural assets and optimize spatial layouts.

  • The real estate software landscape is undergoing a massive transformation driven by the rapid assimilation of predictive physical modeling and spatial analytics. Property developers increasingly rely on digital twin simulations and building information modeling to create highly accurate virtual replicas of unbuilt commercial assets. This technological transition occurs because proactive structural monitoring drastically minimizes unforeseen mechanical failures.
  • Consequently, organizations utilizing smart building IoT integration alongside real-time telemetry data have reduced their unexpected equipment downtime by 30%. Furthermore, the incorporation of thermal anomaly detection and preventive maintenance scheduling allows facility managers to dispatch technicians exactly when needed, lowering overall maintenance overhead by 18%.
  • To cater to remote investors, brokerages now deploy virtual property walkthroughs and generative AI workflows to streamline the discovery phase. Ultimately, the adoption of energy performance tracking and spatial layout optimization ensures that large-scale physical assets remain highly competitive and ecologically compliant.

What challenges does the Real Estate Software Industry face during its growth?

  • High implementation complexity and substantial switching costs represent significant barriers restraining overall industry adoption.

  • Despite rapid technological advancements, massive structural hurdles regarding legacy infrastructure and cybersecurity vulnerabilities severely restrict frictionless enterprise adoption. Real estate conglomerates face intense operational disruptions during legacy system migration, as porting decades of historical financial records into modern databases requires extensive recalibration.
  • Consequently, organizations attempting complex data siloing mitigation without proper API interoperability middleware experience a 24% increase in accidental data duplication during peak leasing cycles. Furthermore, the rising sophistication of cyber threats forces companies to invest heavily in data encryption protocols and multi-factor authentication to protect sensitive tenant portfolios.
  • Because international privacy laws impose steep penalties, implementing audit-ready architectures and tamper-proof digital registries remains incredibly expensive. These steep compliance costs surrounding cross-border transaction handling, role-based access controls, and decentralized ledger ledgers ultimately lower immediate profit margins by 11% for mid-sized firms transitioning their tech stacks.

Exclusive Technavio Analysis on Customer Landscape

The real estate software market forecasting report includes the adoption lifecycle of the market, covering from the innovator’s stage to the laggard’s stage. It focuses on adoption rates in different regions based on penetration. Furthermore, the real estate software market report also includes key purchase criteria and drivers of price sensitivity to help companies evaluate and develop their market growth analysis strategies.
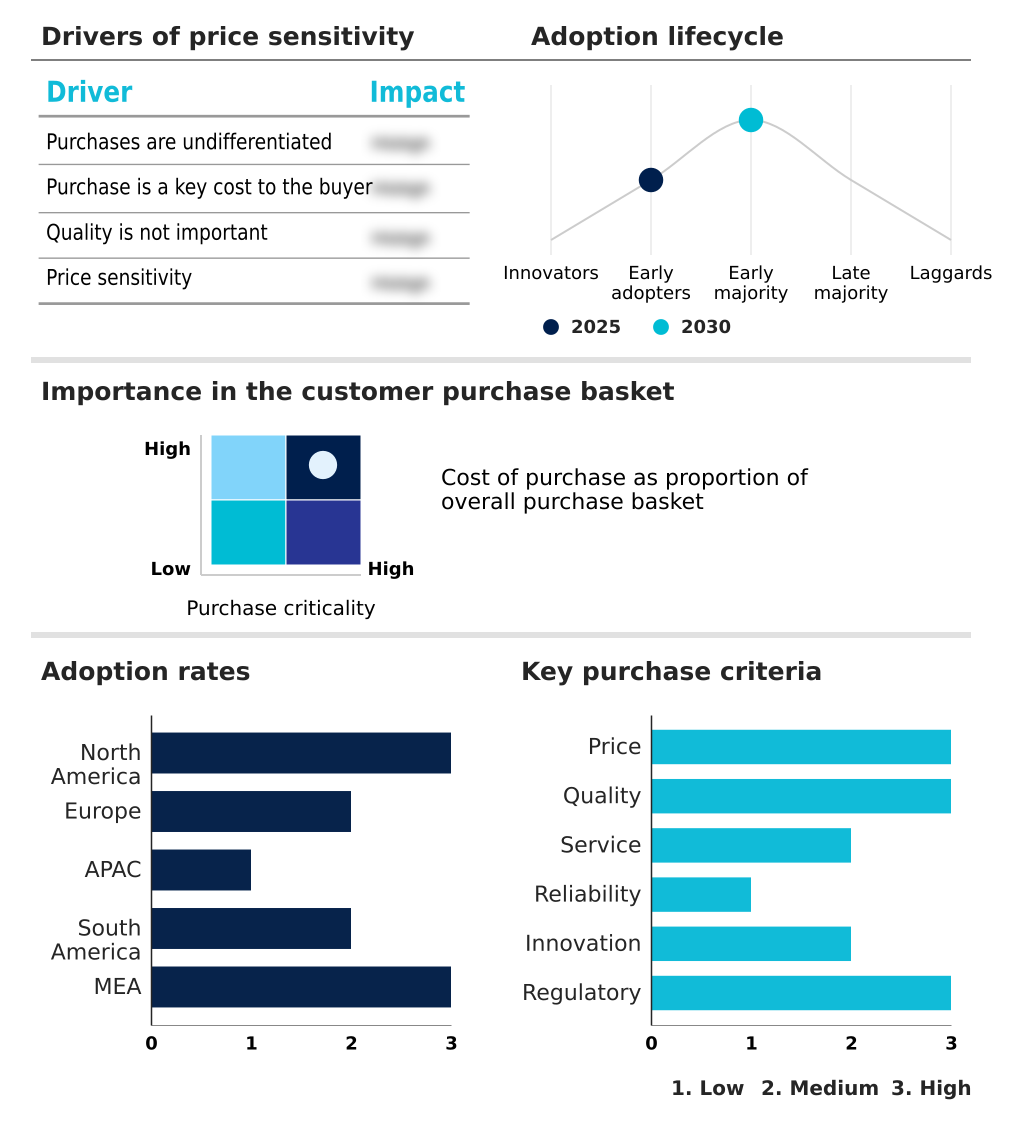
Customer Landscape of Real Estate Software Industry

Competitive Landscape

Companies are implementing various strategies, such as strategic alliances, real estate software market forecast, partnerships, mergers and acquisitions, geographical expansion, and product/service launches, to enhance their presence in the industry.

Altus Group Ltd. - The prominent provider delivers advanced real estate software, equipping enterprises with integrated property management modules, scalable investment analytics platforms, and comprehensive commercial asset administration tools.

The industry research and growth report includes detailed analyses of the competitive landscape of the market and information about key companies, including:

  • Altus Group Ltd.
  • AppFolio Inc.
  • CoStar Group
  • Entrata Inc.
  • Eptura Inc.
  • Facilio Inc.
  • IBM Corp.
  • Inside Real Estate
  • MRI Software LLC
  • Oracle Corp.
  • Planon Group
  • Procore Technologies Inc.
  • Re Leased
  • RealPage Inc.
  • ResMan LLC
  • SAP SE
  • Spacewell International NV
  • TenantCloud LLC
  • Trimble Inc.
  • VTS Inc.
  • Yardi Systems Inc.

Qualitative and quantitative analysis of companies has been conducted to help clients understand the wider business environment as well as the strengths and weaknesses of key industry players. Data is qualitatively analyzed to categorize companies as pure play, category-focused, industry-focused, and diversified; it is quantitatively analyzed to categorize companies as dominant, leading, strong, tentative, and weak.

Recent Development and News in Real estate software market

  • In the Application Software industry, the widespread adoption of AI infrastructure and generative natural language processing algorithms has accelerated complex data interpretation, directly impacting Real Estate Software demand by enabling highly automated lead prioritization and precise property valuation analytics.
  • Stringent data privacy regulations, including the European Union General Data Protection Regulation, have mandated secure data encryption protocols across enterprise applications, compelling property management platforms to upgrade their audit-ready architectures and role-based access controls.
  • The proliferation of cloud-based delivery models and API interoperability middleware has eliminated fragmented legacy data silos, heavily driving the adoption of centralized real-time financial dashboards within commercial property software ecosystems.
  • Stringent environmental mandates such as the EU Corporate Sustainability Reporting Directive have forced enterprise automation tools to include precise energy performance tracking, significantly expanding the necessity for comprehensive ESG compliance frameworks in specialized property management systems.

Dive into Technavio’s robust research methodology, blending expert interviews, extensive data synthesis, and validated models for unparalleled Real Estate Software Market insights. See full methodology.

Market Scope
Page number 301
Base year 2025
Historic period 2020-2024
Forecast period 2026-2030
Growth momentum & CAGR Accelerate at a CAGR of 11%
Market growth 2026-2030 USD 9480.7 million
Market structure Fragmented
YoY growth 2025-2026(%) 10.1%
Key countries US, Canada, Mexico, Germany, UK, France, Italy, Spain, The Netherlands, China, Japan, India, Australia, South Korea, Indonesia, Brazil, Argentina, Chile, Saudi Arabia, UAE, South Africa, Israel and Turkey
Competitive landscape Leading Companies, Market Positioning of Companies, Competitive Strategies, and Industry Risks

Request Free Sample

Research Analyst Overview

  • Real estate software solutions are aggressively reshaping traditional property administration by merging robust financial control mechanisms with intelligent automation capabilities. Commercial asset managers transition rapidly toward unified enterprise platforms, successfully eliminating the administrative friction inherent in decentralized spreadsheet management.
  • As regulatory scrutiny surrounding sustainable operations intensifies, corporate boards increasingly mandate the integration of precise carbon emission reporting tools into their core strategic planning, directly influencing compliance and long-term product viability. This boardroom-level shift toward environmental accountability ensures that organizations can align their operational efficiency with strict global mandates.
  • Organizations utilizing advanced building information modeling and property portfolio analytics report that their strategic forecasting accuracy improved by 25%, drastically enhancing capital allocation precision. Furthermore, the integration of virtual property walkthroughs accelerates the leasing lifecycle, allowing prospective tenants to evaluate spaces remotely with high confidence.
  • By embedding sophisticated modules for automated lease abstraction, automated rent collection, and predictive rent forecasting, technology providers empower multinational firms to standardize cross-border operations. Consequently, digital ecosystem adoption remains an imperative strategy for mitigating systemic risks and securing continuous operational stability.

What are the Key Data Covered in this Real Estate Software Market Research and Growth Report?

  • What is the expected growth of the Real Estate Software Market between 2026 and 2030?

    • USD 9.48 billion, at a CAGR of 11%

  • What segmentation does the market report cover?

    • The report is segmented by Deployment (Cloud-based, and On-premises), Application (Residential, and Commercial), Type (Property management software, ERP software, CRM software, Contract software, and Others) and Geography (North America, Europe, APAC, South America, Middle East and Africa)

  • Which regions are analyzed in the report?

    • North America, Europe, APAC, South America and Middle East and Africa

  • What are the key growth drivers and market challenges?

    • Adoption of AI tools, High implementation complexity and switching costs

  • Who are the major players in the Real Estate Software Market?

    • Altus Group Ltd., AppFolio Inc., CoStar Group, Entrata Inc., Eptura Inc., Facilio Inc., IBM Corp., Inside Real Estate, MRI Software LLC, Oracle Corp., Planon Group, Procore Technologies Inc., Re Leased, RealPage Inc., ResMan LLC, SAP SE, Spacewell International NV, TenantCloud LLC, Trimble Inc., VTS Inc. and Yardi Systems Inc.

Market Research Insights

  • The Real Estate Software Market demonstrates profound operational shifts as commercial property firms transition away from fragmented spreadsheets toward unified, cloud-native architecture. Asset managers increasingly deploy predictive pricing analytics to optimize rental yields, successfully boosting overall revenue margins by 12% across competitive urban portfolios.
  • By leveraging SaaS deployment models, residential brokerages have streamlined their administrative workflows, thereby accelerating their tenant onboarding processes by 18%. Furthermore, the incorporation of mobile-optimized applications enables maintenance technicians to update work logs remotely, reducing facility response times by 25%.
  • This continuous evolution ensures that data siloing mitigation remains a primary objective, allowing diverse operational teams to coordinate effortlessly and maintain exceptional service delivery standards globally.

We can help! Our analysts can customize this real estate software market research report to meet your requirements.

Get in touch

1. Executive Summary

1.1 Market overview

Executive Summary - Chart on Market Overview
Executive Summary - Data Table on Market Overview
Executive Summary - Chart on Global Market Characteristics
Executive Summary - Chart on Market by Geography
Executive Summary - Chart on Market Segmentation by Deployment
Executive Summary - Chart on Market Segmentation by Application
Executive Summary - Chart on Market Segmentation by Type
Executive Summary - Chart on Incremental Growth
Executive Summary - Data Table on Incremental Growth
Executive Summary - Chart on Company Market Positioning

2. Technavio Analysis

2.1 Analysis of price sensitivity, lifecycle, customer purchase basket, adoption rates, and purchase criteria

2.2 Criticality of inputs and Factors of differentiation

Chart on Overview on criticality of inputs and factors of differentiation

2.3 Factors of disruption

Chart on Overview on factors of disruption

2.4 Impact of drivers and challenges

Chart on Impact of drivers and challenges in 2025 and 2030

3. Market Landscape

3.1 Market ecosystem

Chart on Parent Market
Data Table on - Parent Market

3.2 Market characteristics

Chart on Market characteristics analysis

3.3 Value chain analysis

Chart on Value chain analysis

4. Market Sizing

4.1 Market definition

Data Table on Offerings of companies included in the market definition

4.2 Market segment analysis

Market segments

4.3 Market size 2025

4.4 Market outlook: Forecast for 2025-2030

Chart on Global - Market size and forecast 2025-2030 ($ million)
Data Table on Global - Market size and forecast 2025-2030 ($ million)
Chart on Global Market: Year-over-year growth 2025-2030 (%)
Data Table on Global Market: Year-over-year growth 2025-2030 (%)

5. Historic Market Size

5.1 Global Real Estate Software Market 2020 - 2024

Historic Market Size - Data Table on Global Real Estate Software Market 2020 - 2024 ($ million)

5.2 Deployment segment analysis 2020 - 2024

Historic Market Size - Deployment Segment 2020 - 2024 ($ million)

5.3 Application segment analysis 2020 - 2024

Historic Market Size - Application Segment 2020 - 2024 ($ million)

5.4 Type segment analysis 2020 - 2024

Historic Market Size - Type Segment 2020 - 2024 ($ million)

5.5 Geography segment analysis 2020 - 2024

Historic Market Size - Geography Segment 2020 - 2024 ($ million)

5.6 Country segment analysis 2020 - 2024

Historic Market Size - Country Segment 2020 - 2024 ($ million)

6. Qualitative Analysis

6.1 Impact of AI on Global Real Estate Software Market

6.2 Impact of geopolitical conflicts on Global Real Estate Software Market

7. Five Forces Analysis

7.1 Five forces summary

Five forces analysis - Comparison between 2025 and 2030

7.2 Bargaining power of buyers

Bargaining power of buyers - Impact of key factors 2025 and 2030

7.3 Bargaining power of suppliers

Bargaining power of suppliers - Impact of key factors in 2025 and 2030

7.4 Threat of new entrants

Threat of new entrants - Impact of key factors in 2025 and 2030

7.5 Threat of substitutes

Threat of substitutes - Impact of key factors in 2025 and 2030

7.6 Threat of rivalry

Threat of rivalry - Impact of key factors in 2025 and 2030

7.7 Market condition

Chart on Market condition - Five forces 2025 and 2030

8. Market Segmentation by Deployment

8.1 Market segments

Chart on Deployment - Market share 2025-2030 (%)
Data Table on Deployment - Market share 2025-2030 (%)

8.2 Comparison by Deployment

Chart on Comparison by Deployment
Data Table on Comparison by Deployment

8.3 Cloud-based - Market size and forecast 2025-2030

Chart on Cloud-based - Market size and forecast 2025-2030 ($ million)
Data Table on Cloud-based - Market size and forecast 2025-2030 ($ million)
Chart on Cloud-based - Year-over-year growth 2025-2030 (%)
Data Table on Cloud-based - Year-over-year growth 2025-2030 (%)

8.4 On-premises - Market size and forecast 2025-2030

Chart on On-premises - Market size and forecast 2025-2030 ($ million)
Data Table on On-premises - Market size and forecast 2025-2030 ($ million)
Chart on On-premises - Year-over-year growth 2025-2030 (%)
Data Table on On-premises - Year-over-year growth 2025-2030 (%)

8.5 Market opportunity by Deployment

Market opportunity by Deployment ($ million)
Data Table on Market opportunity by Deployment ($ million)

9. Market Segmentation by Application

9.1 Market segments

Chart on Application - Market share 2025-2030 (%)
Data Table on Application - Market share 2025-2030 (%)

9.2 Comparison by Application

Chart on Comparison by Application
Data Table on Comparison by Application

9.3 Residential - Market size and forecast 2025-2030

Chart on Residential - Market size and forecast 2025-2030 ($ million)
Data Table on Residential - Market size and forecast 2025-2030 ($ million)
Chart on Residential - Year-over-year growth 2025-2030 (%)
Data Table on Residential - Year-over-year growth 2025-2030 (%)

9.4 Commercial - Market size and forecast 2025-2030

Chart on Commercial - Market size and forecast 2025-2030 ($ million)
Data Table on Commercial - Market size and forecast 2025-2030 ($ million)
Chart on Commercial - Year-over-year growth 2025-2030 (%)
Data Table on Commercial - Year-over-year growth 2025-2030 (%)

9.5 Market opportunity by Application

Market opportunity by Application ($ million)
Data Table on Market opportunity by Application ($ million)

10. Market Segmentation by Type

10.1 Market segments

Chart on Type - Market share 2025-2030 (%)
Data Table on Type - Market share 2025-2030 (%)

10.2 Comparison by Type

Chart on Comparison by Type
Data Table on Comparison by Type

10.3 Property management software - Market size and forecast 2025-2030

Chart on Property management software - Market size and forecast 2025-2030 ($ million)
Data Table on Property management software - Market size and forecast 2025-2030 ($ million)
Chart on Property management software - Year-over-year growth 2025-2030 (%)
Data Table on Property management software - Year-over-year growth 2025-2030 (%)

10.4 ERP software - Market size and forecast 2025-2030

Chart on ERP software - Market size and forecast 2025-2030 ($ million)
Data Table on ERP software - Market size and forecast 2025-2030 ($ million)
Chart on ERP software - Year-over-year growth 2025-2030 (%)
Data Table on ERP software - Year-over-year growth 2025-2030 (%)

10.5 CRM software - Market size and forecast 2025-2030

Chart on CRM software - Market size and forecast 2025-2030 ($ million)
Data Table on CRM software - Market size and forecast 2025-2030 ($ million)
Chart on CRM software - Year-over-year growth 2025-2030 (%)
Data Table on CRM software - Year-over-year growth 2025-2030 (%)

10.6 Contract software - Market size and forecast 2025-2030

Chart on Contract software - Market size and forecast 2025-2030 ($ million)
Data Table on Contract software - Market size and forecast 2025-2030 ($ million)
Chart on Contract software - Year-over-year growth 2025-2030 (%)
Data Table on Contract software - Year-over-year growth 2025-2030 (%)

10.7 Others - Market size and forecast 2025-2030

Chart on Others - Market size and forecast 2025-2030 ($ million)
Data Table on Others - Market size and forecast 2025-2030 ($ million)
Chart on Others - Year-over-year growth 2025-2030 (%)
Data Table on Others - Year-over-year growth 2025-2030 (%)

10.8 Market opportunity by Type

Market opportunity by Type ($ million)
Data Table on Market opportunity by Type ($ million)

11. Customer Landscape

11.1 Customer landscape overview

Analysis of price sensitivity, lifecycle, customer purchase basket, adoption rates, and purchase criteria

12. Geographic Landscape

12.1 Geographic segmentation

Chart on Market share by geography 2025-2030 (%)
Data Table on Market share by geography 2025-2030 (%)

12.2 Geographic comparison

Chart on Geographic comparison
Data Table on Geographic comparison

12.3 North America - Market size and forecast 2025-2030

Chart on North America - Market size and forecast 2025-2030 ($ million)
Data Table on North America - Market size and forecast 2025-2030 ($ million)
Chart on North America - Year-over-year growth 2025-2030 (%)
Data Table on North America - Year-over-year growth 2025-2030 (%)
Chart on Regional Comparison - North America
Data Table on Regional Comparison - North America

12.3.1 US - Market size and forecast 2025-2030

Chart on US - Market size and forecast 2025-2030 ($ million)
Data Table on US - Market size and forecast 2025-2030 ($ million)
Chart on US - Year-over-year growth 2025-2030 (%)
Data Table on US - Year-over-year growth 2025-2030 (%)

12.3.2 Canada - Market size and forecast 2025-2030

Chart on Canada - Market size and forecast 2025-2030 ($ million)
Data Table on Canada - Market size and forecast 2025-2030 ($ million)
Chart on Canada - Year-over-year growth 2025-2030 (%)
Data Table on Canada - Year-over-year growth 2025-2030 (%)

12.3.3 Mexico - Market size and forecast 2025-2030

Chart on Mexico - Market size and forecast 2025-2030 ($ million)
Data Table on Mexico - Market size and forecast 2025-2030 ($ million)
Chart on Mexico - Year-over-year growth 2025-2030 (%)
Data Table on Mexico - Year-over-year growth 2025-2030 (%)

12.4 Europe - Market size and forecast 2025-2030

Chart on Europe - Market size and forecast 2025-2030 ($ million)
Data Table on Europe - Market size and forecast 2025-2030 ($ million)
Chart on Europe - Year-over-year growth 2025-2030 (%)
Data Table on Europe - Year-over-year growth 2025-2030 (%)
Chart on Regional Comparison - Europe
Data Table on Regional Comparison - Europe

12.4.1 Germany - Market size and forecast 2025-2030

Chart on Germany - Market size and forecast 2025-2030 ($ million)
Data Table on Germany - Market size and forecast 2025-2030 ($ million)
Chart on Germany - Year-over-year growth 2025-2030 (%)
Data Table on Germany - Year-over-year growth 2025-2030 (%)

12.4.2 UK - Market size and forecast 2025-2030

Chart on UK - Market size and forecast 2025-2030 ($ million)
Data Table on UK - Market size and forecast 2025-2030 ($ million)
Chart on UK - Year-over-year growth 2025-2030 (%)
Data Table on UK - Year-over-year growth 2025-2030 (%)

12.4.3 France - Market size and forecast 2025-2030

Chart on France - Market size and forecast 2025-2030 ($ million)
Data Table on France - Market size and forecast 2025-2030 ($ million)
Chart on France - Year-over-year growth 2025-2030 (%)
Data Table on France - Year-over-year growth 2025-2030 (%)

12.4.4 Italy - Market size and forecast 2025-2030

Chart on Italy - Market size and forecast 2025-2030 ($ million)
Data Table on Italy - Market size and forecast 2025-2030 ($ million)
Chart on Italy - Year-over-year growth 2025-2030 (%)
Data Table on Italy - Year-over-year growth 2025-2030 (%)

12.4.5 Spain - Market size and forecast 2025-2030

Chart on Spain - Market size and forecast 2025-2030 ($ million)
Data Table on Spain - Market size and forecast 2025-2030 ($ million)
Chart on Spain - Year-over-year growth 2025-2030 (%)
Data Table on Spain - Year-over-year growth 2025-2030 (%)

12.4.6 The Netherlands - Market size and forecast 2025-2030

Chart on The Netherlands - Market size and forecast 2025-2030 ($ million)
Data Table on The Netherlands - Market size and forecast 2025-2030 ($ million)
Chart on The Netherlands - Year-over-year growth 2025-2030 (%)
Data Table on The Netherlands - Year-over-year growth 2025-2030 (%)

12.5 APAC - Market size and forecast 2025-2030

Chart on APAC - Market size and forecast 2025-2030 ($ million)
Data Table on APAC - Market size and forecast 2025-2030 ($ million)
Chart on APAC - Year-over-year growth 2025-2030 (%)
Data Table on APAC - Year-over-year growth 2025-2030 (%)
Chart on Regional Comparison - APAC
Data Table on Regional Comparison - APAC

12.5.1 China - Market size and forecast 2025-2030

Chart on China - Market size and forecast 2025-2030 ($ million)
Data Table on China - Market size and forecast 2025-2030 ($ million)
Chart on China - Year-over-year growth 2025-2030 (%)
Data Table on China - Year-over-year growth 2025-2030 (%)

12.5.2 Japan - Market size and forecast 2025-2030

Chart on Japan - Market size and forecast 2025-2030 ($ million)
Data Table on Japan - Market size and forecast 2025-2030 ($ million)
Chart on Japan - Year-over-year growth 2025-2030 (%)
Data Table on Japan - Year-over-year growth 2025-2030 (%)

12.5.3 India - Market size and forecast 2025-2030

Chart on India - Market size and forecast 2025-2030 ($ million)
Data Table on India - Market size and forecast 2025-2030 ($ million)
Chart on India - Year-over-year growth 2025-2030 (%)
Data Table on India - Year-over-year growth 2025-2030 (%)

12.5.4 Australia - Market size and forecast 2025-2030

Chart on Australia - Market size and forecast 2025-2030 ($ million)
Data Table on Australia - Market size and forecast 2025-2030 ($ million)
Chart on Australia - Year-over-year growth 2025-2030 (%)
Data Table on Australia - Year-over-year growth 2025-2030 (%)

12.5.5 South Korea - Market size and forecast 2025-2030

Chart on South Korea - Market size and forecast 2025-2030 ($ million)
Data Table on South Korea - Market size and forecast 2025-2030 ($ million)
Chart on South Korea - Year-over-year growth 2025-2030 (%)
Data Table on South Korea - Year-over-year growth 2025-2030 (%)

12.5.6 Indonesia - Market size and forecast 2025-2030

Chart on Indonesia - Market size and forecast 2025-2030 ($ million)
Data Table on Indonesia - Market size and forecast 2025-2030 ($ million)
Chart on Indonesia - Year-over-year growth 2025-2030 (%)
Data Table on Indonesia - Year-over-year growth 2025-2030 (%)

12.6 South America - Market size and forecast 2025-2030

Chart on South America - Market size and forecast 2025-2030 ($ million)
Data Table on South America - Market size and forecast 2025-2030 ($ million)
Chart on South America - Year-over-year growth 2025-2030 (%)
Data Table on South America - Year-over-year growth 2025-2030 (%)
Chart on Regional Comparison - South America
Data Table on Regional Comparison - South America

12.6.1 Brazil - Market size and forecast 2025-2030

Chart on Brazil - Market size and forecast 2025-2030 ($ million)
Data Table on Brazil - Market size and forecast 2025-2030 ($ million)
Chart on Brazil - Year-over-year growth 2025-2030 (%)
Data Table on Brazil - Year-over-year growth 2025-2030 (%)

12.6.2 Argentina - Market size and forecast 2025-2030

Chart on Argentina - Market size and forecast 2025-2030 ($ million)
Data Table on Argentina - Market size and forecast 2025-2030 ($ million)
Chart on Argentina - Year-over-year growth 2025-2030 (%)
Data Table on Argentina - Year-over-year growth 2025-2030 (%)

12.6.3 Chile - Market size and forecast 2025-2030

Chart on Chile - Market size and forecast 2025-2030 ($ million)
Data Table on Chile - Market size and forecast 2025-2030 ($ million)
Chart on Chile - Year-over-year growth 2025-2030 (%)
Data Table on Chile - Year-over-year growth 2025-2030 (%)

12.7 Middle East and Africa - Market size and forecast 2025-2030

Chart on Middle East and Africa - Market size and forecast 2025-2030 ($ million)
Data Table on Middle East and Africa - Market size and forecast 2025-2030 ($ million)
Chart on Middle East and Africa - Year-over-year growth 2025-2030 (%)
Data Table on Middle East and Africa - Year-over-year growth 2025-2030 (%)
Chart on Regional Comparison - Middle East and Africa
Data Table on Regional Comparison - Middle East and Africa

12.7.1 Saudi Arabia - Market size and forecast 2025-2030

Chart on Saudi Arabia - Market size and forecast 2025-2030 ($ million)
Data Table on Saudi Arabia - Market size and forecast 2025-2030 ($ million)
Chart on Saudi Arabia - Year-over-year growth 2025-2030 (%)
Data Table on Saudi Arabia - Year-over-year growth 2025-2030 (%)

12.7.2 UAE - Market size and forecast 2025-2030

Chart on UAE - Market size and forecast 2025-2030 ($ million)
Data Table on UAE - Market size and forecast 2025-2030 ($ million)
Chart on UAE - Year-over-year growth 2025-2030 (%)
Data Table on UAE - Year-over-year growth 2025-2030 (%)

12.7.3 South Africa - Market size and forecast 2025-2030

Chart on South Africa - Market size and forecast 2025-2030 ($ million)
Data Table on South Africa - Market size and forecast 2025-2030 ($ million)
Chart on South Africa - Year-over-year growth 2025-2030 (%)
Data Table on South Africa - Year-over-year growth 2025-2030 (%)

12.7.4 Israel - Market size and forecast 2025-2030

Chart on Israel - Market size and forecast 2025-2030 ($ million)
Data Table on Israel - Market size and forecast 2025-2030 ($ million)
Chart on Israel - Year-over-year growth 2025-2030 (%)
Data Table on Israel - Year-over-year growth 2025-2030 (%)

12.7.5 Turkey - Market size and forecast 2025-2030

Chart on Turkey - Market size and forecast 2025-2030 ($ million)
Data Table on Turkey - Market size and forecast 2025-2030 ($ million)
Chart on Turkey - Year-over-year growth 2025-2030 (%)
Data Table on Turkey - Year-over-year growth 2025-2030 (%)

12.8 Market opportunity by geography

Market opportunity by geography ($ million)
Data Tables on Market opportunity by geography ($ million)

13. Drivers, Challenges, and Opportunity

13.1 Market drivers

Adoption of AI tools
Transition toward cloud deployment
Focus on operational sustainability

13.2 Market challenges

High implementation complexity and switching costs
Data security and regulatory compliance
Integration friction with legacy systems

13.3 Impact of drivers and challenges

Impact of drivers and challenges in 2025 and 2030

13.4 Market opportunities

Adoption of digital twin technology
Blockchain and smart contracts
Automated predictive maintenance systems

14. Competitive Landscape

14.1 Overview

14.2

Overview on criticality of inputs and factors of differentiation

14.3 Landscape disruption

Overview on factors of disruption

14.4 Industry risks

Impact of key risks on business

15. Competitive Analysis

15.1 Companies profiled

Companies covered

15.2 Company ranking index

15.3 Market positioning of companies

Matrix on companies position and classification

15.4 Altus Group Ltd.

Altus Group Ltd. - Overview
Altus Group Ltd. - Business segments
Altus Group Ltd. - Key offerings
Altus Group Ltd. - Segment focus
SWOT

15.5 AppFolio Inc.

AppFolio Inc. - Overview
AppFolio Inc. - Product / Service
AppFolio Inc. - Key offerings
SWOT

15.6 CoStar Group

CoStar Group - Overview
CoStar Group - Business segments
CoStar Group - Key offerings
CoStar Group - Segment focus
SWOT

15.7 Entrata Inc.

Entrata Inc. - Overview
Entrata Inc. - Product / Service
Entrata Inc. - Key offerings
SWOT

15.8 Eptura Inc.

Eptura Inc. - Overview
Eptura Inc. - Product / Service
Eptura Inc. - Key offerings
SWOT

15.9 Facilio Inc.

Facilio Inc. - Overview
Facilio Inc. - Product / Service
Facilio Inc. - Key offerings
SWOT

15.10 IBM Corp.

IBM Corp. - Overview
IBM Corp. - Business segments
IBM Corp. - Key news
IBM Corp. - Key offerings
IBM Corp. - Segment focus
SWOT

15.11 MRI Software LLC

MRI Software LLC - Overview
MRI Software LLC - Product / Service
MRI Software LLC - Key offerings
SWOT

15.12 Oracle Corp.

Oracle Corp. - Overview
Oracle Corp. - Business segments
Oracle Corp. - Key news
Oracle Corp. - Key offerings
Oracle Corp. - Segment focus
SWOT

15.13 Planon Group

Planon Group - Overview
Planon Group - Product / Service
Planon Group - Key offerings
SWOT

15.14 ResMan LLC

ResMan LLC - Overview
ResMan LLC - Product / Service
ResMan LLC - Key offerings
SWOT

15.15 SAP SE

SAP SE - Overview
SAP SE - Business segments
SAP SE - Key news
SAP SE - Key offerings
SAP SE - Segment focus
SWOT

15.16 Spacewell International NV

Spacewell International NV - Overview
Spacewell International NV - Product / Service
Spacewell International NV - Key offerings
SWOT

15.17 TenantCloud LLC

TenantCloud LLC - Overview
TenantCloud LLC - Product / Service
TenantCloud LLC - Key offerings
SWOT

15.18 Trimble Inc.

Trimble Inc. - Overview
Trimble Inc. - Business segments
Trimble Inc. - Key news
Trimble Inc. - Key offerings
Trimble Inc. - Segment focus
SWOT

16. Appendix

16.1 Scope of the report

Market definition
Objectives
Notes and caveats

16.2 Inclusions and exclusions checklist

Inclusions checklist
Exclusions checklist

16.3 Currency conversion rates for US$

16.4 Research methodology

16.5 Data procurement

Information sources

16.6 Data validation

16.7 Validation techniques employed for market sizing

16.8 Data synthesis

16.9 360 degree market analysis

16.10 List of abbreviations

Research Methodology

Technavio presents a detailed picture of the market by way of study, synthesis, and summation of data from multiple sources. The analysts have presented the various facets of the market with a particular focus on identifying the key industry influencers. The data thus presented is comprehensive, reliable, and the result of extensive research, both primary and secondary.

INFORMATION SOURCES

Primary sources

  • Manufacturers and suppliers
  • Channel partners
  • Industry experts
  • Strategic decision makers

Secondary sources

  • Industry journals and periodicals
  • Government data
  • Financial reports of key industry players
  • Historical data
  • Press releases

DATA ANALYSIS

Data Synthesis

  • Collation of data
  • Estimation of key figures
  • Analysis of derived insights

Data Validation

  • Triangulation with data models
  • Reference against proprietary databases
  • Corroboration with industry experts

REPORT WRITING

Qualitative

  • Market drivers
  • Market challenges
  • Market trends
  • Five forces analysis

Quantitative

  • Market size and forecast
  • Market segmentation
  • Geographical insights
  • Competitive landscape

Interested in this report?

Get your sample now to see our research methodology and insights!

Download Now

Frequently Asked Questions

Real Estate Software market growth will increase by USD 9480.7 million during 2026-2030.

The Real Estate Software market is expected to grow at a CAGR of 11% during 2026-2030.

Real Estate Software market is segmented by Deployment (Cloud-based, On-premises) Application (Residential, Commercial) Type (Property management software, ERP software, CRM software, Contract software, Others)

Altus Group Ltd., AppFolio Inc., CoStar Group, Entrata Inc., Eptura Inc., Facilio Inc., IBM Corp., Inside Real Estate, MRI Software LLC, Oracle Corp., Planon Group, Procore Technologies Inc., Re Leased, RealPage Inc., ResMan LLC, SAP SE, Spacewell International NV, TenantCloud LLC, Trimble Inc., VTS Inc., Yardi Systems Inc. are a few of the key vendors in the Real Estate Software market.

North America will register the highest growth rate of 31% among the other regions. Therefore, the Real Estate Software market in North America is expected to garner significant business opportunities for the vendors during the forecast period.

US, Canada, Mexico, Germany, UK, France, Italy, Spain, The Netherlands, China, Japan, India, Australia, South Korea, Indonesia, Brazil, Argentina, Chile, Saudi Arabia, UAE, South Africa, Israel, Turkey

  • Adoption of AI tools is the driving factor this market.

The Real Estate Software market vendors should focus on grabbing business opportunities from the Deployment segment as it accounted for the largest market share in the base year.
RIA - Research AI Assistant
Ask RIA
