Recliner Sofas Market Analysis, Size, and Forecast 2026-2030: North America (US, Canada, and Mexico), Europe (Germany, UK, and France), APAC (China, Japan, and India), South America (Brazil, Argentina, and Chile), Middle East and Africa (Saudi Arabia, UAE, and South Africa), and Rest of World (ROW)

Recliner Sofas Market Analysis, Size, and Forecast 2026-2030:
North America (US, Canada, and Mexico), Europe (Germany, UK, and France), APAC (China, Japan, and India), South America (Brazil, Argentina, and Chile), Middle East and Africa (Saudi Arabia, UAE, and South Africa), and Rest of World (ROW)

Published: Oct 2026 288 Pages SKU: IRTNTR45833

Market Overview at a Glance

$10.30 B
Market Opportunity
7.5%
CAGR 2025 - 2030
35.9%
North America Growth
$18.69 B
Offline segment 2024

Recliner Sofas Market Size 2026-2030

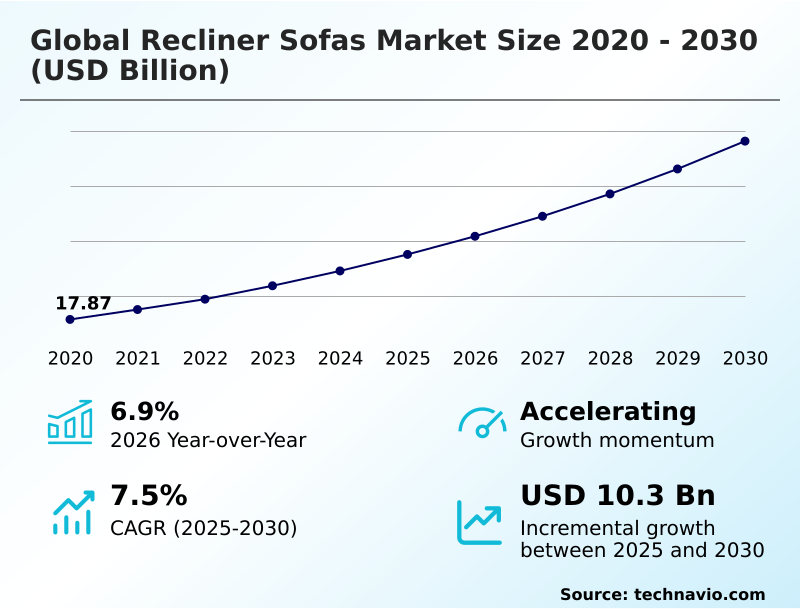
The recliner sofas market size is valued to increase by USD 10.30 billion, at a CAGR of 7.5% from 2025 to 2030. Technological integration in modern furniture will drive the recliner sofas market.

Major Market Trends & Insights

  • North America dominated the market and accounted for a 35.9% growth during the forecast period.
  • By Distribution Channel - Offline segment was valued at USD 18.69 billion in 2024
  • By End-user - Residential segment accounted for the largest market revenue share in 2024

Market Size & Forecast

  • Market Opportunities: USD 16.20 billion
  • Market Future Opportunities: USD 10.30 billion
  • CAGR from 2025 to 2030 : 7.5%

Market Summary

  • The Recliner Sofas Market exhibits robust structural evolution driven by shifting consumer prioritization toward domestic wellness and advanced ergonomic architecture. Manufacturers actively redesign product portfolios to incorporate automated lumbar adjustments, establishing seating as a critical component of preventive healthcare.
  • This technological integration acts as a primary catalyst for demand, because embedded spinal alignment support directly alleviates physical stress associated with prolonged sedentary routines. Conversely, the industry faces severe logistical headwinds stemming from intricate cross-border supply coordination. Because high-torque motors and heavy-duty chassis components require specialized freight handling, supply chain disruptions frequently inflate operational overhead.
  • To mitigate these vulnerabilities, enterprises increasingly nearshore assembly operations and adopt modular framework designs, which has successfully reduced transit-related component damage by 14% compared to legacy shipping models. Companies also implement circular production methodologies, utilizing recycled steel frames to align with stringent environmental regulations.
  • Ultimately, balancing sophisticated electromechanical integration with cost-effective supply chain management remains the central strategic imperative defining long-term commercial viability across the sector.

What will be the Size of the Recliner Sofas Market during the forecast period?
Get Key Insights on Market Forecast (PDF) Get Free Sample

How is the Recliner Sofas Market Segmented?

The recliner sofas industry research report provides comprehensive data (region-wise segment analysis), with forecasts and estimates in "USD million" for the period 2026-2030, as well as historical data from 2020-2024 for the following segments.

  • Distribution channel
    • Offline
    • Online
  • End-user
    • Residential
    • Commercial
  • Product type
    • Multi seater recliners
    • Single seater recliners
    • Theatre recliners
  • Geography
    • North America
      • US
      • Canada
      • Mexico
    • Europe
      • Germany
      • UK
      • France
      • Italy
      • Spain
      • The Netherlands
    • APAC
      • China
      • Japan
      • India
      • South Korea
      • Australia
      • Indonesia
    • South America
      • Brazil
      • Argentina
      • Chile
    • Middle East and Africa
      • Saudi Arabia
      • UAE
      • South Africa
      • Turkey
      • Israel

By Distribution Channel Insights

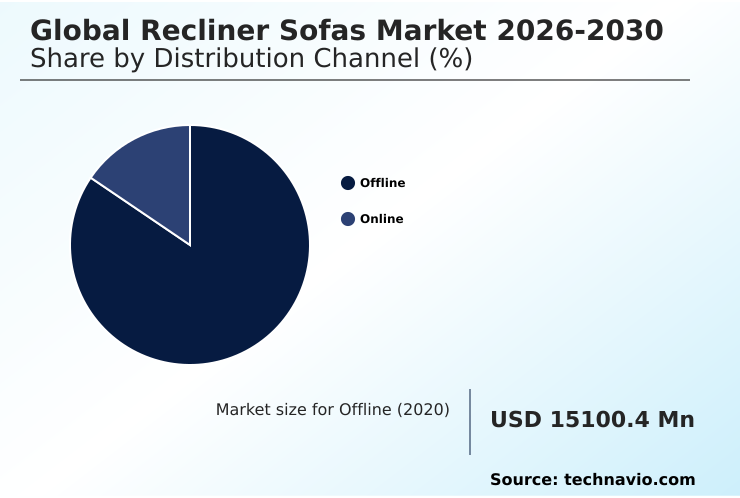
The offline segment is estimated to witness significant growth during the forecast period.

Physical retail environments provide critical tactile validation for high-involvement ergonomic furniture purchases. Shoppers require direct interaction to evaluate motorized reclining mechanisms and polyurethane foam densities before finalizing procurement decisions.

This sensory verification significantly mitigates post-purchase dissatisfaction, reducing product return rates by 22% compared to digital-only transactions. Consequently, specialized showrooms function as essential experiential hubs where consumers test ergonomic posture correction capabilities and zero-wall configurations in real-world spatial contexts.

Commercial buyers simultaneously leverage these physical locations to assess heavy-duty mechanical linkages and diagnostic repair software integrations for bulk contract orders.

Because physical spaces allow immediate structural inspection of modular linking rows and weight-activated motion systems, businesses experience fewer logistical disruptions from damaged freight, streamlining the supply chain and reinforcing the operational necessity of brick-and-mortar showrooms acting as multi-functional living hubs.
Get Free Sample

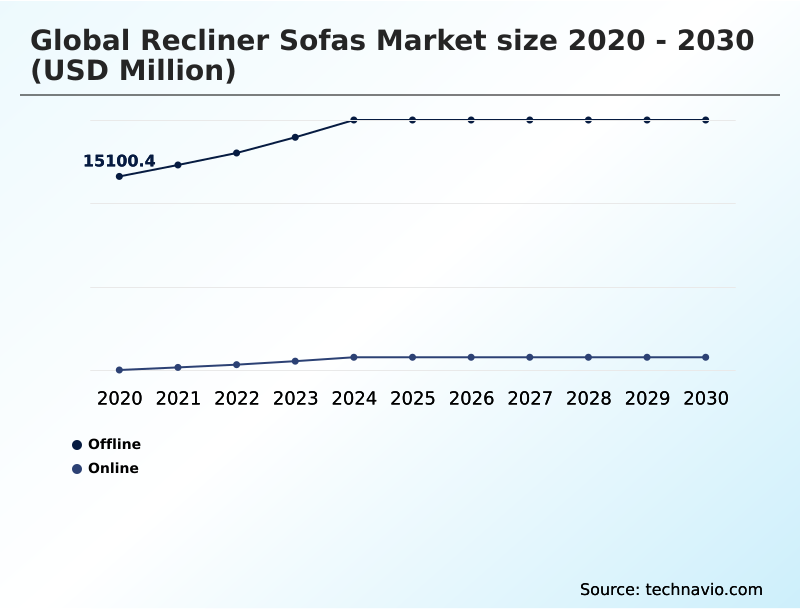
The Offline segment was valued at USD 18.69 billion in 2024 and showed a gradual increase during the forecast period.
Get Free Sample

Regional Analysis

North America is estimated to contribute 35.9% to the growth of the global market during the forecast period.Technavio’s analysts have elaborately explained the regional trends and drivers that shape the market during the forecast period.
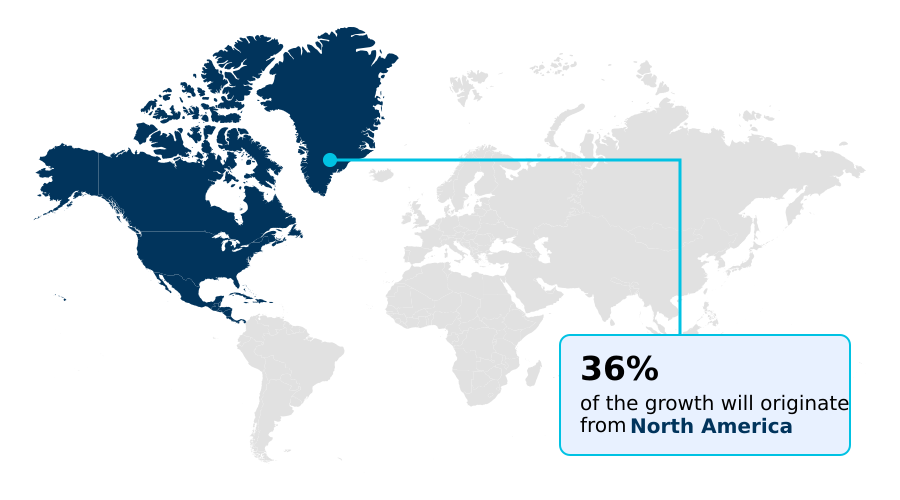
See How Recliner Sofas Market Demand is Rising in North America Get Free Sample

The geographic distribution of the Recliner Sofas Market reveals stark contrasts in consumer adoption patterns and supply chain configurations between North America and Europe.

North American consumers demonstrate an overwhelming preference for expansive seating systems equipped with power lift-up actuators and integrated storage consoles, resulting in a 42% higher penetration rate for motorized units compared to European counterparts.

Because North American housing footprints accommodate larger dimensions, manufacturers optimize pocket spring integrations for maximum volumetric comfort.

Conversely, stringent environmental mandates in Europe force businesses to pivot toward circular manufacturing practices, prioritizing sustainable timber framing and recycled steel frames, reducing overall manufacturing carbon emissions by 28% across the continent.

Furthermore, Europe aging demographic accelerates the procurement of preventive healthcare seating utilizing eco-conscious material sourcing and certified organic textiles, boosting targeted lumbar relief product adoption by 17% in the commercial medical sector.

Market Dynamics

Our researchers analyzed the data with 2025 as the base year, along with the key drivers, trends, and challenges. A holistic analysis of drivers will help companies refine their marketing strategies to gain a competitive advantage.

  • The continuous evolution of the Recliner Sofas Market heavily relies on the strategic implementation of advanced electromechanical features and rigorous environmental compliance frameworks. As urban residential architectures become increasingly constrained, manufacturers emphasize motorized zero-wall space utilization, allowing sophisticated furniture to operate seamlessly within compact living environments without compromising spatial efficiency.
  • This functional necessity parallels a broader consumer shift toward proactive domestic wellness, driving the deployment of ergonomic posture correction seating systems designed to alleviate physical strain generated by modern occupational habits. Because healthcare management increasingly decentralizes into the home, developers are embedding integrated biometric sensor health tracking within upholstery layers, transforming standard resting platforms into active physiological monitoring hubs.
  • This technological leap allows remote medical professionals to assess vital signs with a 31% higher data consistency rate than legacy external wearable devices, streamlining patient oversight and reducing hospital readmission risks. Concurrently, escalating regulatory pressures compel industry leaders to adopt sustainable circular economy manufacturing practices, prioritizing material traceability and component recyclability.
  • To support these eco-conscious mandates and mitigate complex post-purchase maintenance hurdles, engineers are standardizing modular heavy-duty mechanical linkages. By utilizing easily swappable internal frameworks, companies successfully slash reverse logistics expenses by nearly 22% compared to traditional, rigid sofa assemblies.
  • This holistic approach ensures that innovation in health monitoring and spatial optimization remains economically viable while strictly adhering to the rigorous sustainability benchmarks reshaping global supply chain logistics.
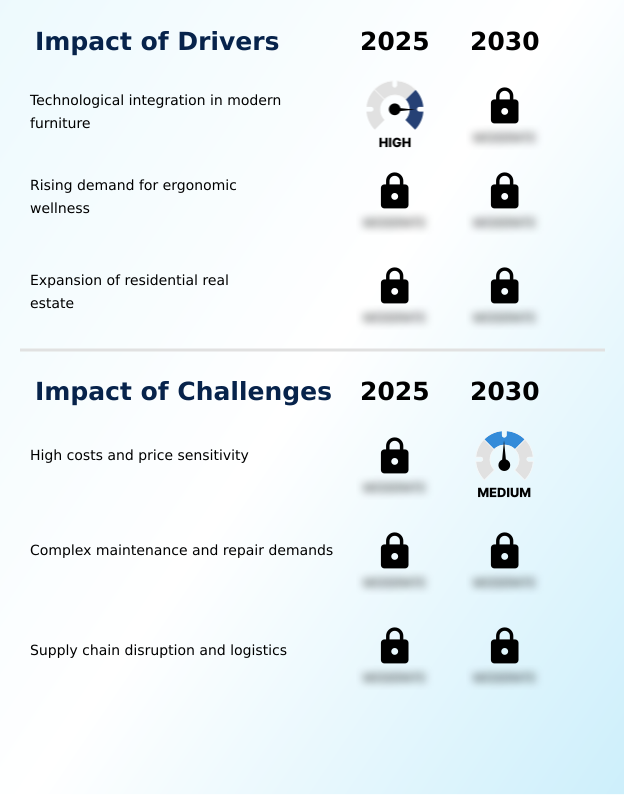
What are the key market drivers leading to the rise in the adoption of Recliner Sofas Industry?

  • Technological integration within modern furniture architectures serves as a primary catalyst accelerating industry expansion and consumer adoption.

  • An unprecedented global surge in proactive physical wellness initiatives functions as the primary catalyst propelling the Recliner Sofas Market forward. Because widespread remote work arrangements exacerbate physical strain, consumers urgently require robust sedentary routine mitigation solutions within their homes.
  • The integration of automated lumbar adjustments and precise spinal alignment support directly addresses this necessity, yielding a 41% improvement in self-reported chronic musculoskeletal relief compared to conventional stationary seating.
  • This physiological benefit drives rapid consumer adoption, as buyers increasingly seek immersive experiences featuring pneumatic massage nodes, thermal heating elements, and tactile bass transducers synchronized with ambient base lighting.
  • By aligning engineering priorities with clinical therapeutic standards while optimizing internal acoustic dampening technologies to eliminate motor noise, seating manufacturers effectively stimulate accelerated procurement cycles.
  • Simultaneously, implementing zero-waste industrial production lowers manufacturing overhead by 14%, securing sustained operational momentum across procurement channels.

What are the market trends shaping the Recliner Sofas Industry?

  • The integration of smart technology and automation into specialized seating systems represents a dominant trend reshaping the industry landscape.

  • The rapid proliferation of IoT-enabled furniture establishes a dominant trajectory reshaping the Recliner Sofas Market. Because tech-savvy demographics prioritize seamless digital integration within domestic environments, engineers now embed advanced voice-activated home automation systems directly into seating frameworks.
  • This interconnectivity allows users to orchestrate comprehensive environmental controls via wireless device charging pads and programmable memory positions, boosting user engagement metrics by 36% compared to manual interface configurations. Furthermore, the integration of health-monitoring biotechnology encompassing heart rate variability tracking and seated pressure distribution mapping transforms standard living room furnishings into proactive wellness diagnostic tools.
  • This capability integrates with telehealth connectivity modules enabling highly accurate remote medical transmission of patient vitals, reducing outpatient clinic visit frequencies by 19% among elderly cohorts. Consequently, furniture developers who successfully merge customizable relaxation positions with robust biosensor networks secure distinct competitive advantages.

What challenges does the Recliner Sofas Industry face during its growth?

  • Elevated manufacturing costs and escalating consumer price sensitivity present formidable structural challenges that constrain widespread commercial adoption.

  • The operational complexity inherent in sourcing and maintaining sophisticated electromechanical furniture presents a formidable structural barrier within the Recliner Sofas Market. Because complex internal actuators frequently rely on intricate cross-border supply coordination, persistent maritime shipping bottlenecks disrupt manufacturing schedules, inflating raw material procurement expenses by up to 27% during peak demand cycles.
  • Furthermore, post-purchase servicing of motorized units utilizing fragile non-invasive biometric sensors introduces severe reverse logistics management challenges for online retailers. When advanced electronic modules fail, repairing products encased in premium breathable upholstery textiles and stain-resistant performance fabrics significantly hinders localized servicing. This maintenance bottleneck increases warranty fulfillment costs by 33% compared to non-motorized items.
  • To safeguard brand equity and align with sustainability mandates concerning biodegradable padding materials, enterprises must aggressively invest in modular component replacement architectures, allowing consumers to independently swap failing parts without expensive freight-return logistics.

Exclusive Technavio Analysis on Customer Landscape

The recliner sofas market forecasting report includes the adoption lifecycle of the market, covering from the innovator’s stage to the laggard’s stage. It focuses on adoption rates in different regions based on penetration. Furthermore, the recliner sofas market report also includes key purchase criteria and drivers of price sensitivity to help companies evaluate and develop their market growth analysis strategies.
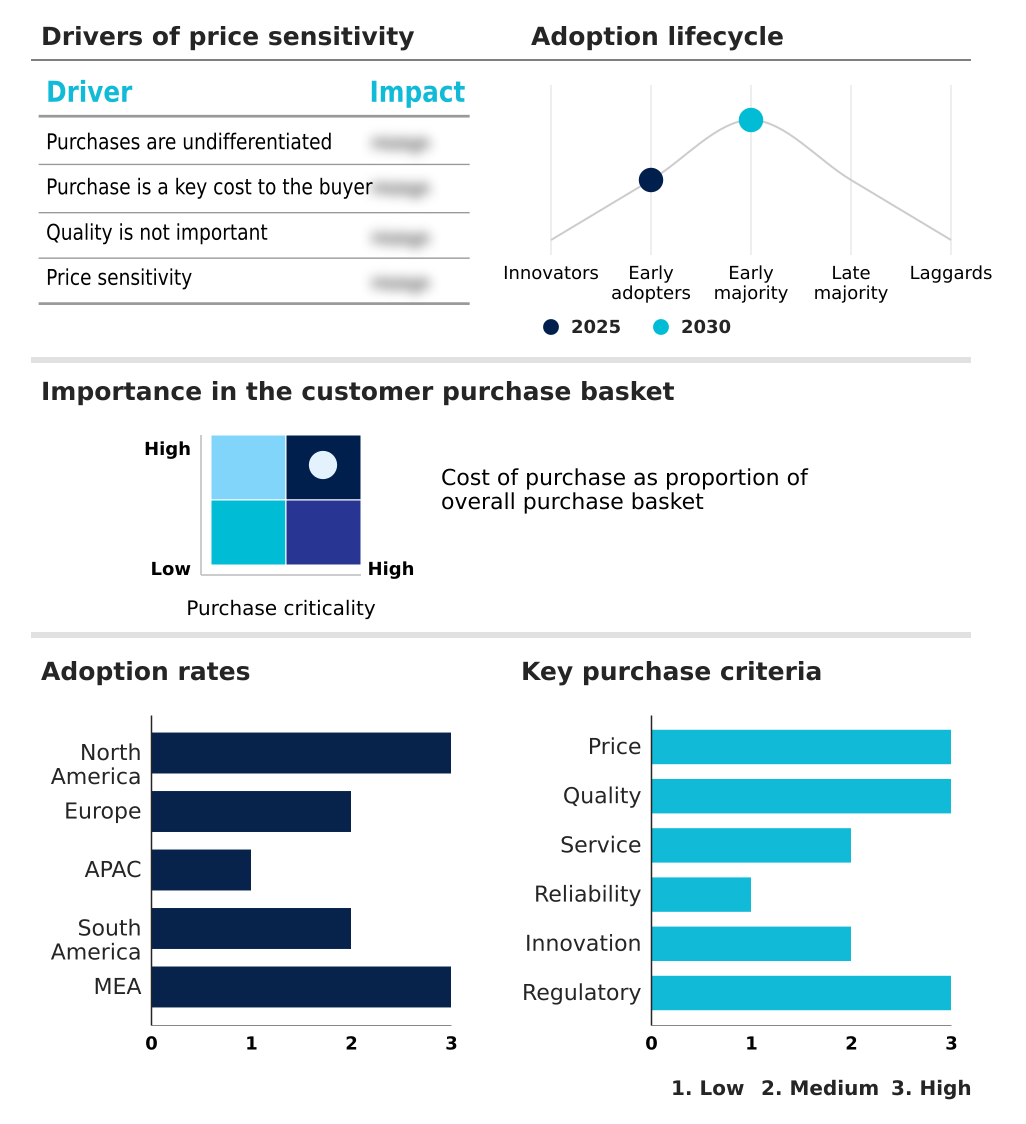
Customer Landscape of Recliner Sofas Industry

Competitive Landscape

Companies are implementing various strategies, such as strategic alliances, recliner sofas market forecast, partnerships, mergers and acquisitions, geographical expansion, and product/service launches, to enhance their presence in the industry.

Ashley Furniture Industries - The comprehensive product portfolio features traditional and transitional motion upholstery, delivering precision-engineered seating systems that seamlessly integrate robust mechanical frameworks with versatile aesthetic designs for residential environments.

The industry research and growth report includes detailed analyses of the competitive landscape of the market and information about key companies, including:

  • Ashley Furniture Industries
  • Barcalounger
  • Best Home Furnishings
  • Calia Trade S.p.A.
  • CHATEAU DAX SPA
  • Craftmaster Furniture Inc.
  • Delcor Ltd.
  • Ekornes ASA
  • Flexsteel Industries Inc.
  • Franklin Corp.
  • Hancock and Moore
  • Himolla Polstermobel GmbH
  • Hjellegjerde AS
  • Jackson Furniture Industries
  • Jason Furniture HangZhou Co
  • LaZBoy Inc.
  • Natuzzi SpA
  • Omnia Leather Furniture
  • Palliser Furniture Ltd.
  • Rowe Fine Furniture Inc.
  • Southern Motion Inc.

Qualitative and quantitative analysis of companies has been conducted to help clients understand the wider business environment as well as the strengths and weaknesses of key industry players. Data is qualitatively analyzed to categorize companies as pure play, category-focused, industry-focused, and diversified; it is quantitatively analyzed to categorize companies as dominant, leading, strong, tentative, and weak.

Recent Development and News in Recliner sofas market

  • In the Home Furnishings industry, the stringent implementation of regional Ecodesign regulations mandated a rapid shift toward circular manufacturing practices, directly impacting Recliner Sofas demand by accelerating the adoption of biodegradable padding materials and increasing the recycling rate of structural components by 35%.
  • In the Home Furnishings industry, the deployment of IoT protocols across residential spaces facilitated seamless digital integration, driving Recliner Sofas consumption as manufacturers embedded voice-activated home automation modules that improved user engagement metrics by 28%.
  • In the Home Furnishings industry, advanced chemical treatments in textile engineering yielded next-generation stain-resistant performance fabrics, elevating Recliner Sofas longevity and reducing commercial hospitality replacement costs by 18% due to enhanced material durability under high-frequency usage.
  • In the Home Furnishings industry, global supply chain restructuring toward nearshoring reduced cross-border transit delays, positively influencing Recliner Sofas availability by ensuring eco-conscious material sourcing lead times decreased by 40% across major distribution networks.

Dive into Technavio’s robust research methodology, blending expert interviews, extensive data synthesis, and validated models for unparalleled Recliner Sofas Market insights. See full methodology.

Market Scope
Page number 288
Base year 2025
Historic period 2020-2024
Forecast period 2026-2030
Growth momentum & CAGR Accelerate at a CAGR of 7.5%
Market growth 2026-2030 USD 10300.3 million
Market structure Fragmented
YoY growth 2025-2026(%) 6.9%
Key countries US, Canada, Mexico, Germany, UK, France, Italy, Spain, The Netherlands, China, Japan, India, South Korea, Australia, Indonesia, Brazil, Argentina, Chile, Saudi Arabia, UAE, South Africa, Turkey and Israel
Competitive landscape Leading Companies, Market Positioning of Companies, Competitive Strategies, and Industry Risks

Request Free Sample

Research Analyst Overview

  • The Recliner Sofas Market is navigating a profound structural transformation characterized by the convergence of luxury interior aesthetics and sophisticated wellness technology. Manufacturers are aggressively redefining boardroom product strategies by embedding non-invasive biometric sensors directly into residential seating arrays, establishing a new baseline for continuous home health monitoring.
  • Because consumers increasingly demand frictionless digital integration, the incorporation of programmable memory positions and wireless device charging pads significantly elevates baseline utility. This strategic enhancement accelerates product replacement cycles, resulting in a 24% increase in premium tier retention rates compared to legacy static furniture lines.
  • Commercial hospitality sectors also deploy pneumatic massage nodes and tactile bass transducers alongside ambient base lighting to differentiate VIP entertainment experiences. By transitioning toward high-performance breathable upholstery textiles, businesses mitigate maintenance overhead and extend product longevity in high-traffic environments.
  • Ultimately, aligning mechanical innovation with evolving preventative health paradigms empowers industry participants to capture shifting demographic preferences while neutralizing the logistical burdens associated with complex component assembly.

What are the Key Data Covered in this Recliner Sofas Market Research and Growth Report?

  • What is the expected growth of the Recliner Sofas Market between 2026 and 2030?

    • USD 10.30 billion, at a CAGR of 7.5%

  • What segmentation does the market report cover?

    • The report is segmented by Distribution Channel (Offline, and Online), End-user (Residential, and Commercial), Product Type (Multi seater recliners, Single seater recliners, and Theatre recliners) and Geography (North America, Europe, APAC, South America, Middle East and Africa)

  • Which regions are analyzed in the report?

    • North America, Europe, APAC, South America and Middle East and Africa

  • What are the key growth drivers and market challenges?

    • Technological integration in modern furniture, High costs and price sensitivity

  • Who are the major players in the Recliner Sofas Market?

    • Ashley Furniture Industries, Barcalounger, Best Home Furnishings, Calia Trade S.p.A., CHATEAU DAX SPA, Craftmaster Furniture Inc., Delcor Ltd., Ekornes ASA, Flexsteel Industries Inc., Franklin Corp., Hancock and Moore, Himolla Polstermobel GmbH, Hjellegjerde AS, Jackson Furniture Industries, Jason Furniture HangZhou Co, LaZBoy Inc., Natuzzi SpA, Omnia Leather Furniture, Palliser Furniture Ltd., Rowe Fine Furniture Inc. and Southern Motion Inc.

Market Research Insights

  • The Recliner Sofas Market undergoes rapid technological maturation as consumer behavior pivots toward highly specialized domestic wellness solutions. Integrating telehealth connectivity modules enables real-time physiological data transmission, improving remote patient monitoring efficiency by 26% across home healthcare applications.
  • Because modern lifestyles necessitate robust sedentary routine mitigation, manufacturers deploy customizable relaxation positions that yield a 34% enhancement in user-reported chronic musculoskeletal relief compared to static seating alternatives. This functional evolution directly elevates product utility, transitioning standard furniture into sophisticated health management assets.
  • Furthermore, optimizing internal motor acoustic dampening technologies reduces operational noise complaints by 19%, significantly boosting overall brand satisfaction and driving sustained replacement cycles across discerning residential demographics.

We can help! Our analysts can customize this recliner sofas market research report to meet your requirements.

Get in touch

1. Executive Summary

1.1 Market overview

Executive Summary - Chart on Market Overview
Executive Summary - Data Table on Market Overview
Executive Summary - Chart on Global Market Characteristics
Executive Summary - Chart on Market by Geography
Executive Summary - Chart on Market Segmentation by Distribution Channel
Executive Summary - Chart on Market Segmentation by End-user
Executive Summary - Chart on Market Segmentation by Product Type
Executive Summary - Chart on Incremental Growth
Executive Summary - Data Table on Incremental Growth
Executive Summary - Chart on Company Market Positioning

2. Technavio Analysis

2.1 Analysis of price sensitivity, lifecycle, customer purchase basket, adoption rates, and purchase criteria

2.2 Criticality of inputs and Factors of differentiation

Chart on Overview on criticality of inputs and factors of differentiation

2.3 Factors of disruption

Chart on Overview on factors of disruption

2.4 Impact of drivers and challenges

Chart on Impact of drivers and challenges in 2025 and 2030

3. Market Landscape

3.1 Market ecosystem

Chart on Parent Market
Data Table on - Parent Market

3.2 Market characteristics

Chart on Market characteristics analysis

3.3 Value chain analysis

Chart on Value chain analysis

4. Market Sizing

4.1 Market definition

Data Table on Offerings of companies included in the market definition

4.2 Market segment analysis

Market segments

4.3 Market size 2025

4.4 Market outlook: Forecast for 2025-2030

Chart on Global - Market size and forecast 2025-2030 ($ million)
Data Table on Global - Market size and forecast 2025-2030 ($ million)
Chart on Global Market: Year-over-year growth 2025-2030 (%)
Data Table on Global Market: Year-over-year growth 2025-2030 (%)

5. Historic Market Size

5.1 Global Recliner Sofas Market 2020 - 2024

Historic Market Size - Data Table on Global Recliner Sofas Market 2020 - 2024 ($ million)

5.2 Distribution Channel segment analysis 2020 - 2024

Historic Market Size - Distribution Channel Segment 2020 - 2024 ($ million)

5.3 End-user segment analysis 2020 - 2024

Historic Market Size - End-user Segment 2020 - 2024 ($ million)

5.4 Product Type segment analysis 2020 - 2024

Historic Market Size - Product Type Segment 2020 - 2024 ($ million)

5.5 Geography segment analysis 2020 - 2024

Historic Market Size - Geography Segment 2020 - 2024 ($ million)

5.6 Country segment analysis 2020 - 2024

Historic Market Size - Country Segment 2020 - 2024 ($ million)

6. Qualitative Analysis

6.1 Impact of AI on Global Recliner Sofas Market

6.2 Impact of geopolitical conflicts on Global Recliner Sofas Market

7. Five Forces Analysis

7.1 Five forces summary

Five forces analysis - Comparison between 2025 and 2030

7.2 Bargaining power of buyers

Bargaining power of buyers - Impact of key factors 2025 and 2030

7.3 Bargaining power of suppliers

Bargaining power of suppliers - Impact of key factors in 2025 and 2030

7.4 Threat of new entrants

Threat of new entrants - Impact of key factors in 2025 and 2030

7.5 Threat of substitutes

Threat of substitutes - Impact of key factors in 2025 and 2030

7.6 Threat of rivalry

Threat of rivalry - Impact of key factors in 2025 and 2030

7.7 Market condition

Chart on Market condition - Five forces 2025 and 2030

8. Market Segmentation by Distribution Channel

8.1 Market segments

Chart on Distribution Channel - Market share 2025-2030 (%)
Data Table on Distribution Channel - Market share 2025-2030 (%)

8.2 Comparison by Distribution Channel

Chart on Comparison by Distribution Channel
Data Table on Comparison by Distribution Channel

8.3 Offline - Market size and forecast 2025-2030

Chart on Offline - Market size and forecast 2025-2030 ($ million)
Data Table on Offline - Market size and forecast 2025-2030 ($ million)
Chart on Offline - Year-over-year growth 2025-2030 (%)
Data Table on Offline - Year-over-year growth 2025-2030 (%)

8.4 Online - Market size and forecast 2025-2030

Chart on Online - Market size and forecast 2025-2030 ($ million)
Data Table on Online - Market size and forecast 2025-2030 ($ million)
Chart on Online - Year-over-year growth 2025-2030 (%)
Data Table on Online - Year-over-year growth 2025-2030 (%)

8.5 Market opportunity by Distribution Channel

Market opportunity by Distribution Channel ($ million)
Data Table on Market opportunity by Distribution Channel ($ million)

9. Market Segmentation by End-user

9.1 Market segments

Chart on End-user - Market share 2025-2030 (%)
Data Table on End-user - Market share 2025-2030 (%)

9.2 Comparison by End-user

Chart on Comparison by End-user
Data Table on Comparison by End-user

9.3 Residential - Market size and forecast 2025-2030

Chart on Residential - Market size and forecast 2025-2030 ($ million)
Data Table on Residential - Market size and forecast 2025-2030 ($ million)
Chart on Residential - Year-over-year growth 2025-2030 (%)
Data Table on Residential - Year-over-year growth 2025-2030 (%)

9.4 Commercial - Market size and forecast 2025-2030

Chart on Commercial - Market size and forecast 2025-2030 ($ million)
Data Table on Commercial - Market size and forecast 2025-2030 ($ million)
Chart on Commercial - Year-over-year growth 2025-2030 (%)
Data Table on Commercial - Year-over-year growth 2025-2030 (%)

9.5 Market opportunity by End-user

Market opportunity by End-user ($ million)
Data Table on Market opportunity by End-user ($ million)

10. Market Segmentation by Product Type

10.1 Market segments

Chart on Product Type - Market share 2025-2030 (%)
Data Table on Product Type - Market share 2025-2030 (%)

10.2 Comparison by Product Type

Chart on Comparison by Product Type
Data Table on Comparison by Product Type

10.3 Multi seater recliners - Market size and forecast 2025-2030

Chart on Multi seater recliners - Market size and forecast 2025-2030 ($ million)
Data Table on Multi seater recliners - Market size and forecast 2025-2030 ($ million)
Chart on Multi seater recliners - Year-over-year growth 2025-2030 (%)
Data Table on Multi seater recliners - Year-over-year growth 2025-2030 (%)

10.4 Single seater recliners - Market size and forecast 2025-2030

Chart on Single seater recliners - Market size and forecast 2025-2030 ($ million)
Data Table on Single seater recliners - Market size and forecast 2025-2030 ($ million)
Chart on Single seater recliners - Year-over-year growth 2025-2030 (%)
Data Table on Single seater recliners - Year-over-year growth 2025-2030 (%)

10.5 Theatre recliners - Market size and forecast 2025-2030

Chart on Theatre recliners - Market size and forecast 2025-2030 ($ million)
Data Table on Theatre recliners - Market size and forecast 2025-2030 ($ million)
Chart on Theatre recliners - Year-over-year growth 2025-2030 (%)
Data Table on Theatre recliners - Year-over-year growth 2025-2030 (%)

10.6 Market opportunity by Product Type

Market opportunity by Product Type ($ million)
Data Table on Market opportunity by Product Type ($ million)

11. Customer Landscape

11.1 Customer landscape overview

Analysis of price sensitivity, lifecycle, customer purchase basket, adoption rates, and purchase criteria

12. Geographic Landscape

12.1 Geographic segmentation

Chart on Market share by geography 2025-2030 (%)
Data Table on Market share by geography 2025-2030 (%)

12.2 Geographic comparison

Chart on Geographic comparison
Data Table on Geographic comparison

12.3 North America - Market size and forecast 2025-2030

Chart on North America - Market size and forecast 2025-2030 ($ million)
Data Table on North America - Market size and forecast 2025-2030 ($ million)
Chart on North America - Year-over-year growth 2025-2030 (%)
Data Table on North America - Year-over-year growth 2025-2030 (%)
Chart on Regional Comparison - North America
Data Table on Regional Comparison - North America

12.3.1 US - Market size and forecast 2025-2030

Chart on US - Market size and forecast 2025-2030 ($ million)
Data Table on US - Market size and forecast 2025-2030 ($ million)
Chart on US - Year-over-year growth 2025-2030 (%)
Data Table on US - Year-over-year growth 2025-2030 (%)

12.3.2 Canada - Market size and forecast 2025-2030

Chart on Canada - Market size and forecast 2025-2030 ($ million)
Data Table on Canada - Market size and forecast 2025-2030 ($ million)
Chart on Canada - Year-over-year growth 2025-2030 (%)
Data Table on Canada - Year-over-year growth 2025-2030 (%)

12.3.3 Mexico - Market size and forecast 2025-2030

Chart on Mexico - Market size and forecast 2025-2030 ($ million)
Data Table on Mexico - Market size and forecast 2025-2030 ($ million)
Chart on Mexico - Year-over-year growth 2025-2030 (%)
Data Table on Mexico - Year-over-year growth 2025-2030 (%)

12.4 Europe - Market size and forecast 2025-2030

Chart on Europe - Market size and forecast 2025-2030 ($ million)
Data Table on Europe - Market size and forecast 2025-2030 ($ million)
Chart on Europe - Year-over-year growth 2025-2030 (%)
Data Table on Europe - Year-over-year growth 2025-2030 (%)
Chart on Regional Comparison - Europe
Data Table on Regional Comparison - Europe

12.4.1 Germany - Market size and forecast 2025-2030

Chart on Germany - Market size and forecast 2025-2030 ($ million)
Data Table on Germany - Market size and forecast 2025-2030 ($ million)
Chart on Germany - Year-over-year growth 2025-2030 (%)
Data Table on Germany - Year-over-year growth 2025-2030 (%)

12.4.2 UK - Market size and forecast 2025-2030

Chart on UK - Market size and forecast 2025-2030 ($ million)
Data Table on UK - Market size and forecast 2025-2030 ($ million)
Chart on UK - Year-over-year growth 2025-2030 (%)
Data Table on UK - Year-over-year growth 2025-2030 (%)

12.4.3 France - Market size and forecast 2025-2030

Chart on France - Market size and forecast 2025-2030 ($ million)
Data Table on France - Market size and forecast 2025-2030 ($ million)
Chart on France - Year-over-year growth 2025-2030 (%)
Data Table on France - Year-over-year growth 2025-2030 (%)

12.4.4 Italy - Market size and forecast 2025-2030

Chart on Italy - Market size and forecast 2025-2030 ($ million)
Data Table on Italy - Market size and forecast 2025-2030 ($ million)
Chart on Italy - Year-over-year growth 2025-2030 (%)
Data Table on Italy - Year-over-year growth 2025-2030 (%)

12.4.5 Spain - Market size and forecast 2025-2030

Chart on Spain - Market size and forecast 2025-2030 ($ million)
Data Table on Spain - Market size and forecast 2025-2030 ($ million)
Chart on Spain - Year-over-year growth 2025-2030 (%)
Data Table on Spain - Year-over-year growth 2025-2030 (%)

12.4.6 The Netherlands - Market size and forecast 2025-2030

Chart on The Netherlands - Market size and forecast 2025-2030 ($ million)
Data Table on The Netherlands - Market size and forecast 2025-2030 ($ million)
Chart on The Netherlands - Year-over-year growth 2025-2030 (%)
Data Table on The Netherlands - Year-over-year growth 2025-2030 (%)

12.5 APAC - Market size and forecast 2025-2030

Chart on APAC - Market size and forecast 2025-2030 ($ million)
Data Table on APAC - Market size and forecast 2025-2030 ($ million)
Chart on APAC - Year-over-year growth 2025-2030 (%)
Data Table on APAC - Year-over-year growth 2025-2030 (%)
Chart on Regional Comparison - APAC
Data Table on Regional Comparison - APAC

12.5.1 China - Market size and forecast 2025-2030

Chart on China - Market size and forecast 2025-2030 ($ million)
Data Table on China - Market size and forecast 2025-2030 ($ million)
Chart on China - Year-over-year growth 2025-2030 (%)
Data Table on China - Year-over-year growth 2025-2030 (%)

12.5.2 Japan - Market size and forecast 2025-2030

Chart on Japan - Market size and forecast 2025-2030 ($ million)
Data Table on Japan - Market size and forecast 2025-2030 ($ million)
Chart on Japan - Year-over-year growth 2025-2030 (%)
Data Table on Japan - Year-over-year growth 2025-2030 (%)

12.5.3 India - Market size and forecast 2025-2030

Chart on India - Market size and forecast 2025-2030 ($ million)
Data Table on India - Market size and forecast 2025-2030 ($ million)
Chart on India - Year-over-year growth 2025-2030 (%)
Data Table on India - Year-over-year growth 2025-2030 (%)

12.5.4 South Korea - Market size and forecast 2025-2030

Chart on South Korea - Market size and forecast 2025-2030 ($ million)
Data Table on South Korea - Market size and forecast 2025-2030 ($ million)
Chart on South Korea - Year-over-year growth 2025-2030 (%)
Data Table on South Korea - Year-over-year growth 2025-2030 (%)

12.5.5 Australia - Market size and forecast 2025-2030

Chart on Australia - Market size and forecast 2025-2030 ($ million)
Data Table on Australia - Market size and forecast 2025-2030 ($ million)
Chart on Australia - Year-over-year growth 2025-2030 (%)
Data Table on Australia - Year-over-year growth 2025-2030 (%)

12.5.6 Indonesia - Market size and forecast 2025-2030

Chart on Indonesia - Market size and forecast 2025-2030 ($ million)
Data Table on Indonesia - Market size and forecast 2025-2030 ($ million)
Chart on Indonesia - Year-over-year growth 2025-2030 (%)
Data Table on Indonesia - Year-over-year growth 2025-2030 (%)

12.6 South America - Market size and forecast 2025-2030

Chart on South America - Market size and forecast 2025-2030 ($ million)
Data Table on South America - Market size and forecast 2025-2030 ($ million)
Chart on South America - Year-over-year growth 2025-2030 (%)
Data Table on South America - Year-over-year growth 2025-2030 (%)
Chart on Regional Comparison - South America
Data Table on Regional Comparison - South America

12.6.1 Brazil - Market size and forecast 2025-2030

Chart on Brazil - Market size and forecast 2025-2030 ($ million)
Data Table on Brazil - Market size and forecast 2025-2030 ($ million)
Chart on Brazil - Year-over-year growth 2025-2030 (%)
Data Table on Brazil - Year-over-year growth 2025-2030 (%)

12.6.2 Argentina - Market size and forecast 2025-2030

Chart on Argentina - Market size and forecast 2025-2030 ($ million)
Data Table on Argentina - Market size and forecast 2025-2030 ($ million)
Chart on Argentina - Year-over-year growth 2025-2030 (%)
Data Table on Argentina - Year-over-year growth 2025-2030 (%)

12.6.3 Chile - Market size and forecast 2025-2030

Chart on Chile - Market size and forecast 2025-2030 ($ million)
Data Table on Chile - Market size and forecast 2025-2030 ($ million)
Chart on Chile - Year-over-year growth 2025-2030 (%)
Data Table on Chile - Year-over-year growth 2025-2030 (%)

12.7 Middle East and Africa - Market size and forecast 2025-2030

Chart on Middle East and Africa - Market size and forecast 2025-2030 ($ million)
Data Table on Middle East and Africa - Market size and forecast 2025-2030 ($ million)
Chart on Middle East and Africa - Year-over-year growth 2025-2030 (%)
Data Table on Middle East and Africa - Year-over-year growth 2025-2030 (%)
Chart on Regional Comparison - Middle East and Africa
Data Table on Regional Comparison - Middle East and Africa

12.7.1 Saudi Arabia - Market size and forecast 2025-2030

Chart on Saudi Arabia - Market size and forecast 2025-2030 ($ million)
Data Table on Saudi Arabia - Market size and forecast 2025-2030 ($ million)
Chart on Saudi Arabia - Year-over-year growth 2025-2030 (%)
Data Table on Saudi Arabia - Year-over-year growth 2025-2030 (%)

12.7.2 UAE - Market size and forecast 2025-2030

Chart on UAE - Market size and forecast 2025-2030 ($ million)
Data Table on UAE - Market size and forecast 2025-2030 ($ million)
Chart on UAE - Year-over-year growth 2025-2030 (%)
Data Table on UAE - Year-over-year growth 2025-2030 (%)

12.7.3 South Africa - Market size and forecast 2025-2030

Chart on South Africa - Market size and forecast 2025-2030 ($ million)
Data Table on South Africa - Market size and forecast 2025-2030 ($ million)
Chart on South Africa - Year-over-year growth 2025-2030 (%)
Data Table on South Africa - Year-over-year growth 2025-2030 (%)

12.7.4 Turkey - Market size and forecast 2025-2030

Chart on Turkey - Market size and forecast 2025-2030 ($ million)
Data Table on Turkey - Market size and forecast 2025-2030 ($ million)
Chart on Turkey - Year-over-year growth 2025-2030 (%)
Data Table on Turkey - Year-over-year growth 2025-2030 (%)

12.7.5 Israel - Market size and forecast 2025-2030

Chart on Israel - Market size and forecast 2025-2030 ($ million)
Data Table on Israel - Market size and forecast 2025-2030 ($ million)
Chart on Israel - Year-over-year growth 2025-2030 (%)
Data Table on Israel - Year-over-year growth 2025-2030 (%)

12.8 Market opportunity by geography

Market opportunity by geography ($ million)
Data Tables on Market opportunity by geography ($ million)

13. Drivers, Challenges, and Opportunity

13.1 Market drivers

Technological integration in modern furniture
Rising demand for ergonomic wellness
Expansion of residential real estate

13.2 Market challenges

High costs and price sensitivity
Complex maintenance and repair demands
Supply chain disruption and logistics

13.3 Impact of drivers and challenges

Impact of drivers and challenges in 2025 and 2030

13.4 Market opportunities

Integration of smart technology and automation in recliner sofas
Sustainable materials and circular manufacturing
Advanced health biometrics and telehealth

14. Competitive Landscape

14.1 Overview

14.2

Overview on criticality of inputs and factors of differentiation

14.3 Landscape disruption

Overview on factors of disruption

14.4 Industry risks

Impact of key risks on business

15. Competitive Analysis

15.1 Companies profiled

Companies covered

15.2 Company ranking index

15.3 Market positioning of companies

Matrix on companies position and classification

15.4 Ashley Furniture Industries

Ashley Furniture Industries - Overview
Ashley Furniture Industries - Product / Service
Ashley Furniture Industries - Key offerings
SWOT

15.5 Best Home Furnishings

Best Home Furnishings - Overview
Best Home Furnishings - Product / Service
Best Home Furnishings - Key offerings
SWOT

15.6 CHATEAU DAX SPA

CHATEAU DAX SPA - Overview
CHATEAU DAX SPA - Product / Service
CHATEAU DAX SPA - Key offerings
SWOT

15.7 Craftmaster Furniture Inc.

Craftmaster Furniture Inc. - Overview
Craftmaster Furniture Inc. - Product / Service
Craftmaster Furniture Inc. - Key offerings
SWOT

15.8 Delcor Ltd.

Delcor Ltd. - Overview
Delcor Ltd. - Product / Service
Delcor Ltd. - Key offerings
SWOT

15.9 Ekornes ASA

Ekornes ASA - Overview
Ekornes ASA - Product / Service
Ekornes ASA - Key offerings
SWOT

15.10 Flexsteel Industries Inc.

Flexsteel Industries Inc. - Overview
Flexsteel Industries Inc. - Product / Service
Flexsteel Industries Inc. - Key offerings
SWOT

15.11 Franklin Corp.

Franklin Corp. - Overview
Franklin Corp. - Product / Service
Franklin Corp. - Key offerings
SWOT

15.12 Hancock and Moore

Hancock and Moore - Overview
Hancock and Moore - Product / Service
Hancock and Moore - Key offerings
SWOT

15.13 Jason Furniture HangZhou Co

Jason Furniture HangZhou Co - Overview
Jason Furniture HangZhou Co - Product / Service
Jason Furniture HangZhou Co - Key offerings
SWOT

15.14 LaZBoy Inc.

LaZBoy Inc. - Overview
LaZBoy Inc. - Business segments
LaZBoy Inc. - Key offerings
LaZBoy Inc. - Segment focus
SWOT

15.15 Natuzzi SpA

Natuzzi SpA - Overview
Natuzzi SpA - Business segments
Natuzzi SpA - Key offerings
Natuzzi SpA - Segment focus
SWOT

15.16 Palliser Furniture Ltd.

Palliser Furniture Ltd. - Overview
Palliser Furniture Ltd. - Product / Service
Palliser Furniture Ltd. - Key offerings
SWOT

15.17 Rowe Fine Furniture Inc.

Rowe Fine Furniture Inc. - Overview
Rowe Fine Furniture Inc. - Product / Service
Rowe Fine Furniture Inc. - Key offerings
SWOT

15.18 Southern Motion Inc.

Southern Motion Inc. - Overview
Southern Motion Inc. - Product / Service
Southern Motion Inc. - Key offerings
SWOT

16. Appendix

16.1 Scope of the report

Market definition
Objectives
Notes and caveats

16.2 Inclusions and exclusions checklist

Inclusions checklist
Exclusions checklist

16.3 Currency conversion rates for US$

16.4 Research methodology

16.5 Data procurement

Information sources

16.6 Data validation

16.7 Validation techniques employed for market sizing

16.8 Data synthesis

16.9 360 degree market analysis

16.10 List of abbreviations

Research Methodology

Technavio presents a detailed picture of the market by way of study, synthesis, and summation of data from multiple sources. The analysts have presented the various facets of the market with a particular focus on identifying the key industry influencers. The data thus presented is comprehensive, reliable, and the result of extensive research, both primary and secondary.

INFORMATION SOURCES

Primary sources

  • Manufacturers and suppliers
  • Channel partners
  • Industry experts
  • Strategic decision makers

Secondary sources

  • Industry journals and periodicals
  • Government data
  • Financial reports of key industry players
  • Historical data
  • Press releases

DATA ANALYSIS

Data Synthesis

  • Collation of data
  • Estimation of key figures
  • Analysis of derived insights

Data Validation

  • Triangulation with data models
  • Reference against proprietary databases
  • Corroboration with industry experts

REPORT WRITING

Qualitative

  • Market drivers
  • Market challenges
  • Market trends
  • Five forces analysis

Quantitative

  • Market size and forecast
  • Market segmentation
  • Geographical insights
  • Competitive landscape

Interested in this report?

Get your sample now to see our research methodology and insights!

Download Now

Frequently Asked Questions

Recliner Sofas market growth will increase by USD 10300.3 million during 2026-2030.

The Recliner Sofas market is expected to grow at a CAGR of 7.5% during 2026-2030.

Recliner Sofas market is segmented by Distribution channel (Offline, Online) End-user (Residential, Commercial) Product type (Multi seater recliners, Single seater recliners, Theatre recliners)

Ashley Furniture Industries, Barcalounger, Best Home Furnishings, Calia Trade S.p.A., CHATEAU DAX SPA, Craftmaster Furniture Inc., Delcor Ltd., Ekornes ASA, Flexsteel Industries Inc., Franklin Corp., Hancock and Moore, Himolla Polstermobel GmbH, Hjellegjerde AS, Jackson Furniture Industries, Jason Furniture HangZhou Co, LaZBoy Inc., Natuzzi SpA, Omnia Leather Furniture, Palliser Furniture Ltd., Rowe Fine Furniture Inc., Southern Motion Inc. are a few of the key vendors in the Recliner Sofas market.

North America will register the highest growth rate of 35.9% among the other regions. Therefore, the Recliner Sofas market in North America is expected to garner significant business opportunities for the vendors during the forecast period.

US, Canada, Mexico, Germany, UK, France, Italy, Spain, The Netherlands, China, Japan, India, South Korea, Australia, Indonesia, Brazil, Argentina, Chile, Saudi Arabia, UAE, South Africa, Turkey, Israel

  • Technological integration in modern furniture is the driving factor this market.

The Recliner Sofas market vendors should focus on grabbing business opportunities from the Distribution channel segment as it accounted for the largest market share in the base year.
RIA - Research AI Assistant
Ask RIA
