Remote Microgrid Market Analysis, Size, and Forecast 2026-2030: APAC (China, India, and Japan), North America (US, Canada, and Mexico), Europe (UK, Germany, and France), Middle East and Africa (South Africa, Saudi Arabia, and Turkey), South America (Brazil, Argentina, and Colombia), and Rest of World (ROW)

Remote Microgrid Market Analysis, Size, and Forecast 2026-2030:
APAC (China, India, and Japan), North America (US, Canada, and Mexico), Europe (UK, Germany, and France), Middle East and Africa (South Africa, Saudi Arabia, and Turkey), South America (Brazil, Argentina, and Colombia), and Rest of World (ROW)

Published: Oct 2026 320 Pages SKU: IRTNTR81658

Market Overview at a Glance

$14.60 B
Market Opportunity
17.9%
CAGR 2025 - 2030
37.1%
APAC Growth
$5.78 B
Off-grid microgrid segment 2024

Remote Microgrid Market Size 2026-2030

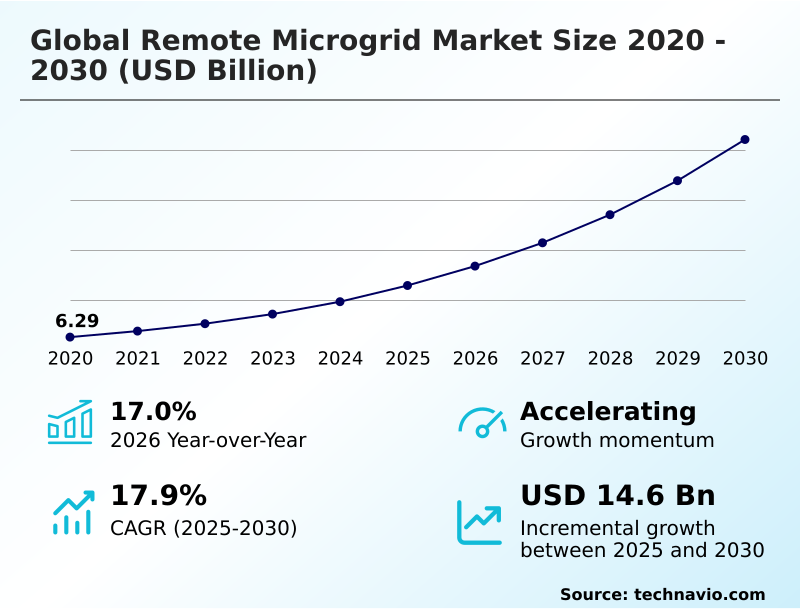
The remote microgrid market size is valued to increase by USD 14.60 billion, at a CAGR of 17.9% from 2025 to 2030. Increasing demand for uninterrupted power in off-grid mining and industrial operations will drive the remote microgrid market.

Major Market Trends & Insights

  • APAC dominated the market and accounted for a 37.1% growth during the forecast period.
  • By Type - Off-grid microgrid segment was valued at USD 5.78 billion in 2024
  • By End-user - Remote communities segment accounted for the largest market revenue share in 2024

Market Size & Forecast

  • Market Opportunities: USD 19.76 billion
  • Market Future Opportunities: USD 14.60 billion
  • CAGR from 2025 to 2030 : 17.9%

Market Summary

  • Remote Microgrid deployments represent a critical structural shift in decentralized energy architectures, providing autonomous power resilience for geographically isolated industrial and residential applications. Mining extraction operators increasingly utilize these localized networks to completely bypass vulnerable logistical supply chains, directly integrating solar generation with battery buffers to eliminate heavy diesel dependency.
  • This strategic pivot allows extractive facilities to maintain continuous production schedules, ultimately reducing cumulative energy expenditure by 40% over a typical project lifecycle. The increasing demand for uninterrupted power in off-grid mining and operations acts as a major driver, compelling continuous investment in sophisticated load-balancing technologies to secure asset uptime.
  • However, substantial capital costs and logistical obstacles in distant locations present formidable deployment barriers, requiring extensive upfront financing that delays project execution in developing regions. By deploying edge-enabled management controllers, operators overcome localized latency issues, maintaining critical system stability even during prolonged telecommunication outages.
  • These highly integrated power systems remain essential for ensuring industrial reliability, accelerating remote electrification mandates, and achieving stringent decarbonization objectives without compromising operational continuity.

What will be the Size of the Remote Microgrid Market during the forecast period?
Get Key Insights on Market Forecast (PDF) Get Free Sample

How is the Remote Microgrid Market Segmented?

The remote microgrid industry research report provides comprehensive data (region-wise segment analysis), with forecasts and estimates in "USD million" for the period 2026-2030, as well as historical data from 2020-2024 for the following segments.

  • Type
    • Off-grid microgrid
    • Hybrid microgrid
    • Grid-connected microgrid
  • End-user
    • Remote communities
    • Mining
    • Military and defense
    • Oil and gas
    • Others
  • Source
    • Diesel
    • Solar PV
    • Hybrid
    • Wind
    • Hydro
  • Geography
    • APAC
      • China
      • India
      • Japan
      • Australia
      • South Korea
      • Indonesia
    • North America
      • US
      • Canada
      • Mexico
    • Europe
      • UK
      • Germany
      • France
      • Italy
      • Spain
      • The Netherlands
    • Middle East and Africa
      • South Africa
      • Saudi Arabia
      • Turkey
      • UAE
      • Israel
    • South America
      • Brazil
      • Argentina
      • Colombia

By Type Insights

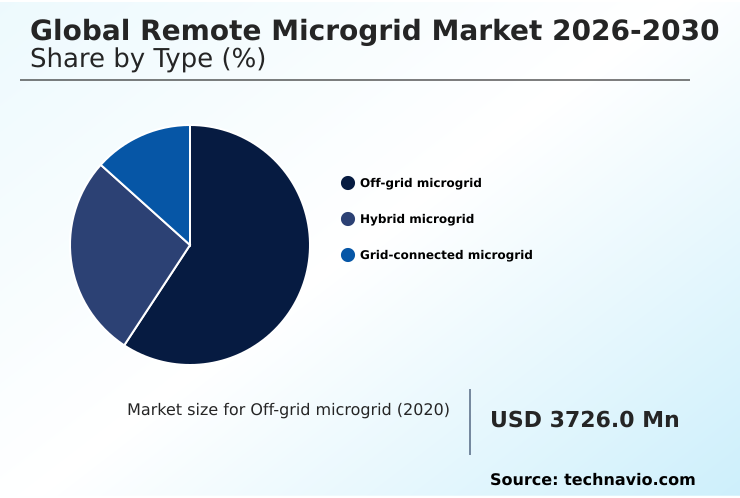
The off-grid microgrid segment is estimated to witness significant growth during the forecast period.

Off-grid power infrastructure functions entirely independent of centralized transmission networks, ensuring continuous operations for remote industrial and residential applications. The integration of smart switchgear automation and solid-state battery integration allows facilities to capture surplus generation, resolving intermittent supply issues.

In harsh climates requiring sub-zero temperature operation, robust thermal management enclosures prevent component degradation, lowering maintenance interventions by 35%. Second-life electric vehicle batteries are increasingly deployed to enhance localized buffering, directly contributing to substantial fuel logistics cost reduction.

Navigating evolving distributed generation regulation requires cyber-secure network control to balance localized output dynamically.

By prioritizing local capacity building, operators can minimize external engineering dependencies and support continuous agricultural processing energy without relying on centralized utilities, making these decentralized networks critical for disaster recovery redeployment strategies.
Get Free Sample

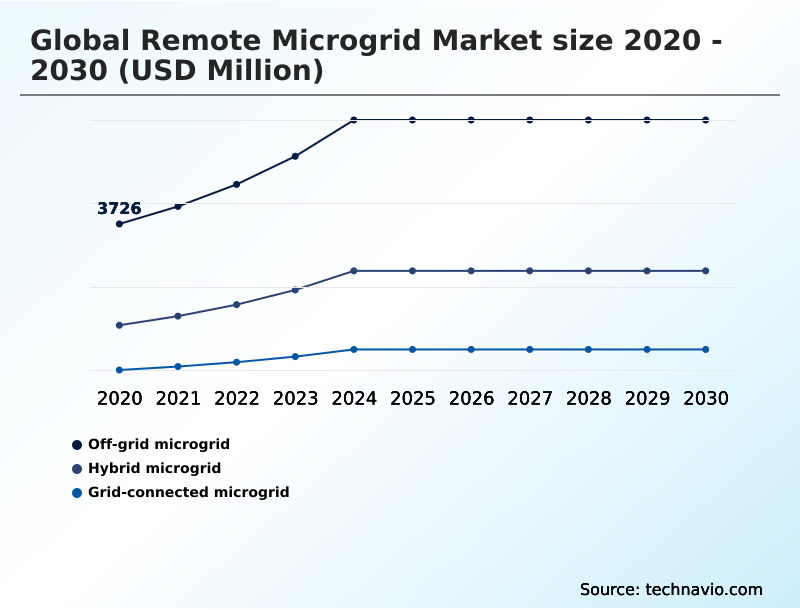
The Off-grid microgrid segment was valued at USD 5.78 billion in 2024 and showed a gradual increase during the forecast period.
Get Free Sample

Regional Analysis

APAC is estimated to contribute 37.1% to the growth of the global market during the forecast period.Technavio’s analysts have elaborately explained the regional trends and drivers that shape the market during the forecast period.
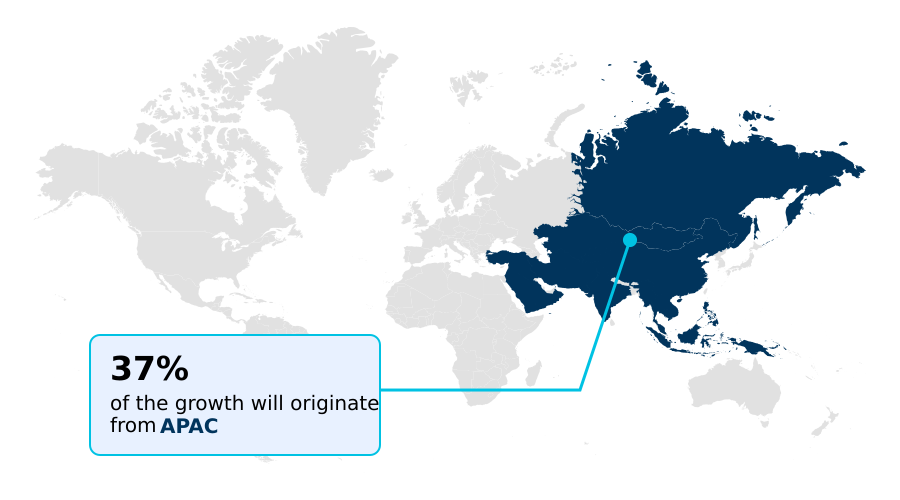
See How Remote Microgrid Market Demand is Rising in APAC Get Free Sample

The deployment of decentralized energy assets varies sharply between regions based on demographic needs and industrial density.

APAC leads widespread adoption, leveraging solar photovoltaic arrays and micro-hydro turbines to fulfill aggressive rural electrification targets, effectively providing continuous power to thousands of isolated island communities.

In contrast, North American deployments focus heavily on industrial resource extraction and defense infrastructure resilience.

Stand-alone power systems in North America prioritize extreme weather resilience and active power synchronization, yielding a 25% higher initial capital expenditure compared to standard APAC installations.

To satisfy strict zero-emission mandates, North American mining facilities actively implement seasonal long-duration storage to combat variable renewable inputs during harsh winters. High-altitude deployment across both geographies necessitates advanced transient power spike management protocols to prevent component failure.

By integrating corrosive marine air protection, coastal APAC installations achieve a 30% reduction in long-term maintenance costs, highlighting distinct regional engineering requirements for optimal reliability.

Market Dynamics

Our researchers analyzed the data with 2025 as the base year, along with the key drivers, trends, and challenges. A holistic analysis of drivers will help companies refine their marketing strategies to gain a competitive advantage.

  • Decentralized energy networks constitute a foundational element for ensuring operational continuity across isolated operations. To maintain strict voltage stability in islanded operation mode, industrial operators rely heavily on autonomous load balancing control algorithms that actively resolve sudden demand fluctuations without requiring centralized grid support.
  • When companies implement modular containerized energy system installation, they fundamentally streamline complex supply chain logistics, minimizing site preparation time and lowering associated deployment overhead by nearly 25% compared to custom-built structures. Telecommunications tower continuous power resilience is critical for maintaining digital connectivity in remote regions, prompting network providers to utilize predictive dispatch algorithms for microgrids.
  • These advanced configurations optimize localized energy output and maximize lithium-ion battery storage capacity optimization. For extreme environments, incorporating extreme weather durable energy assets prevents catastrophic hardware failure during severe storms. The execution of heavy fuel oil displacement techniques requires robust hybrid energy architecture deployment strategies that seamlessly blend decentralized solar photovoltaic array coordination with advanced green hydrogen fuel cell integration.
  • To ensure high-quality power delivery, grid-forming inverter frequency regulation manages localized power quality, while cyber-secure edge computing control units protect these critical networks against malicious digital intrusion. Additionally, transient power spike management protocols prevent equipment degradation during heavy machinery startup sequences.
  • Ultimately, the expansion of fringe-of-grid support service provision allows remote facilities to operate autonomously while maintaining superior asset utilization and operational safety.
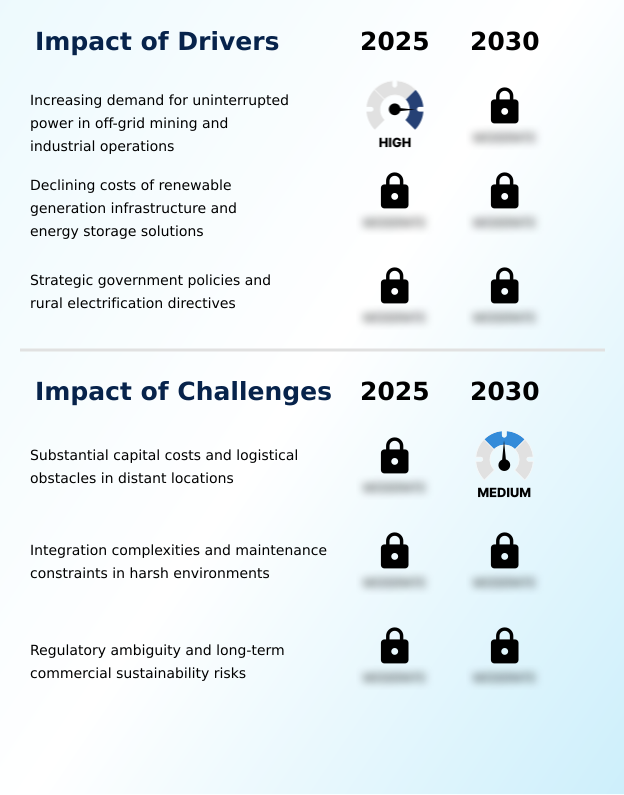
What are the key market drivers leading to the rise in the adoption of Remote Microgrid Industry?

  • The increasing demand for uninterrupted power in off-grid mining and industrial operations serves as the primary driver propelling infrastructure investments across isolated geographic regions.

  • Securing uninterrupted energy supply in isolated operations forces companies to continually adopt highly sophisticated, self-sustaining power architectures. The deployment of autonomous load balancing networks resolves critical power fluctuations, simultaneously facilitating offshore platform decarbonization and reducing hazardous fuel transport.
  • Implementing advanced predictive dispatch algorithms maximizes the performance of green hydrogen electrolyzers, cutting overall operational downtime by 35%. Integrating highly responsive fuel cell backup generators and maximum power point tracking technology provides unparalleled baseline stability, directly enhancing extreme weather durability.
  • These robust deployments support lucrative pay-as-you-go financial schemes in developing regions while delivering essential fringe-of-grid support.
  • Furthermore, dynamic frequency regulation buffers allow isolated utilities to capitalize on ancillary service provision, establishing a 20% improvement in revenue generation efficiency by optimizing decentralized electrical output.

What are the market trends shaping the Remote Microgrid Industry?

  • The integration of edge computing and AI for autonomous microgrid control represents a dominant market trend, optimizing dynamic generation dispatch and component degradation prediction to ensure operational stability.

  • The transition toward autonomous decentralized energy platforms reveals a critical shift toward highly responsive operational frameworks. To support mining extraction facility power requirements, operators are actively transitioning to hybrid energy architecture configurations that displace legacy thermal generation. This shift ensures continuous islanded operation mode functionality while satisfying stringent rural electrification mandates across developing territories.
  • Integrating advanced energy management controllers allows facilities to harmonize variable inputs, directly improving overall generation efficiency by 22%. Furthermore, the combined utilization of bi-directional inverters and specialized grid-forming inverters stabilizes localized loads immediately, ensuring uninterrupted telecommunications tower resilience. As communities prioritize island community energy equity, the accelerated rollout of lithium-ion energy storage systems guarantees resilient baseload delivery.
  • Defense outpost autonomy also benefits significantly from these hybridized networks, reducing reliance on vulnerable supply chains and lowering field fuel consumption by up to 40%.

What challenges does the Remote Microgrid Industry face during its growth?

  • Substantial capital costs and complex logistical obstacles in distant locations pose severe challenges to the widespread deployment of decentralized power systems.

  • Executing off-grid energy projects requires addressing severe structural integration and logistical financing complexities. Maintaining dynamic voltage stability without centralized utility backing necessitates implementing rigorous weather forecast integration, adding substantial engineering complexity. Establishing secure black-start recovery protocols demands specialized edge computing control units, elevating initial hardware procurement costs by 28% for commercial operators.
  • Furthermore, while modular containerized systems simplify physical transport, navigating arduous logistical supply line optimization remains inefficient across isolated terrains. Achieving complete heavy fuel oil displacement is hindered by complex grid encroachment risk mitigation strategies that threaten asset profitability.
  • Unless companies strictly optimize load shedding management and respond to predictive maintenance alerts, unexpected component failure triggers severe carbon emission penalties, reducing expected operational margins by 15%.

Exclusive Technavio Analysis on Customer Landscape

The remote microgrid market forecasting report includes the adoption lifecycle of the market, covering from the innovator’s stage to the laggard’s stage. It focuses on adoption rates in different regions based on penetration. Furthermore, the remote microgrid market report also includes key purchase criteria and drivers of price sensitivity to help companies evaluate and develop their market growth analysis strategies.
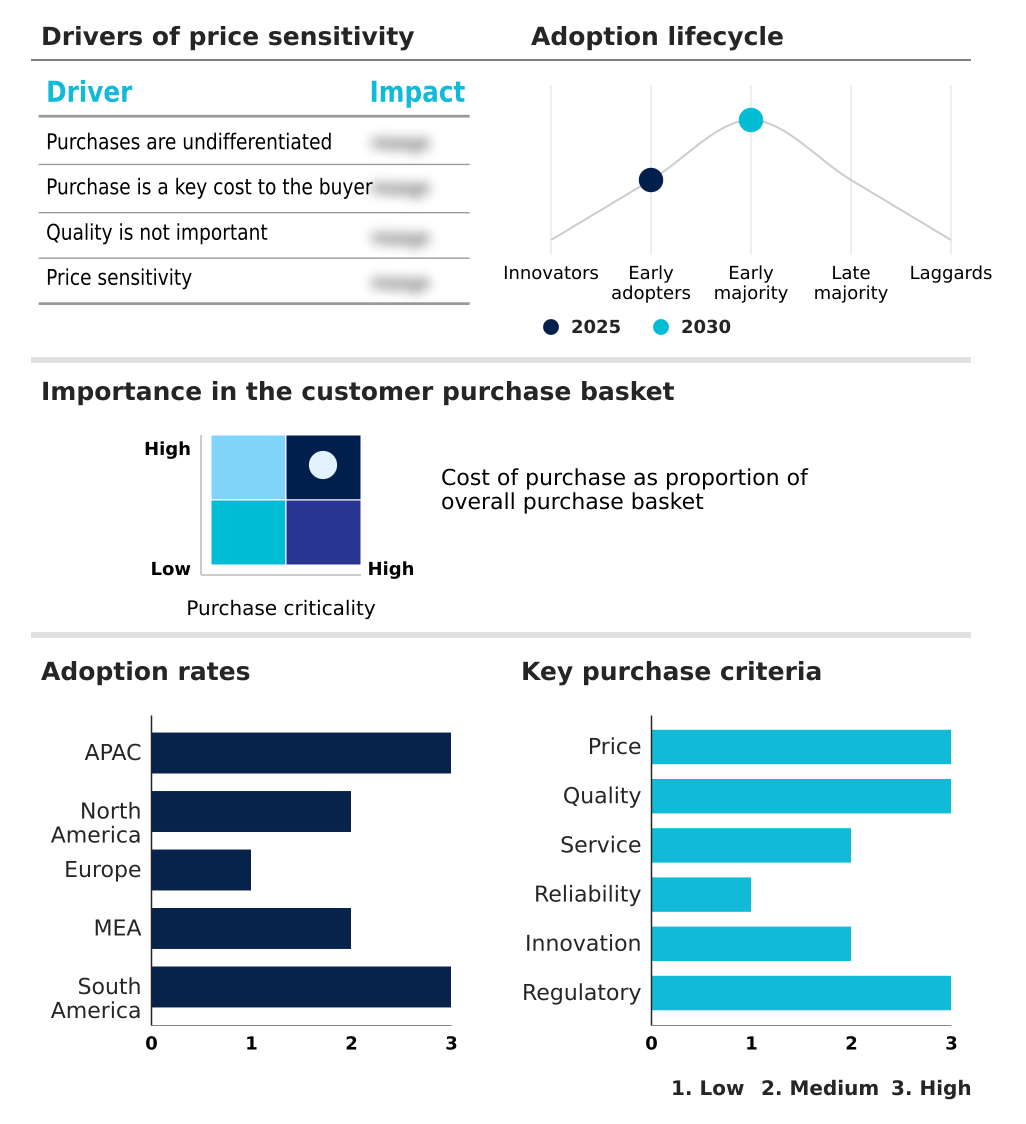
Customer Landscape of Remote Microgrid Industry

Competitive Landscape

Companies are implementing various strategies, such as strategic alliances, remote microgrid market forecast, partnerships, mergers and acquisitions, geographical expansion, and product/service launches, to enhance their presence in the industry.

ABB Ltd. - The organization delivers advanced digital control frameworks and energy management platforms designed to optimize decentralized power networks for isolated industrial facilities and mining operations globally.

The industry research and growth report includes detailed analyses of the competitive landscape of the market and information about key companies, including:

  • ABB Ltd.
  • Aggreko Plc
  • Bloom Energy Corp.
  • Caterpillar Inc.
  • Cummins Inc.
  • Discovery Energy LLC
  • ENGIE SA
  • Generac Power Systems Inc.
  • Hitachi Energy India Ltd.
  • OMC Power Pvt. Ltd.
  • Powerhive Inc.
  • Rolls Royce Holdings Plc
  • S and C Electric Co.
  • Saft Groupe SAS
  • Schneider Electric SE
  • Siemens AG
  • Tesla Inc.
  • Victron Energy BV
  • Wartsila Corp.
  • Yanmar Holdings Co. Ltd.

Qualitative and quantitative analysis of companies has been conducted to help clients understand the wider business environment as well as the strengths and weaknesses of key industry players. Data is qualitatively analyzed to categorize companies as pure play, category-focused, industry-focused, and diversified; it is quantitatively analyzed to categorize companies as dominant, leading, strong, tentative, and weak.

Recent Development and News in Remote microgrid market

  • In the Renewable Electricity industry, advancements in high-density lithium-ion cell manufacturing and cathode chemistry optimization have driven down bulk energy storage costs, directly impacting Remote Microgrid demand by making hybrid power architectures financially viable for off-grid operations.
  • The standardization of interoperability protocols for distributed energy resources has enabled seamless active power synchronization, improving the operational stability of isolated localized networks while reducing system integration costs by up to 20% for commercial installations.
  • Rising implementation of stringent supply chain emission tracking frameworks like the EU CBAM has compelled multinational extraction companies to pursue heavy fuel oil displacement, accelerating the deployment of localized hybrid power networks at remote extraction facilities.
  • The commercial maturation of green hydrogen electrolyzers paired with specialized thermal management enclosures has introduced reliable seasonal long-duration storage capabilities, resolving winter capacity shortfalls for autonomous decentralized energy assets in high-latitude environments.

Dive into Technavio’s robust research methodology, blending expert interviews, extensive data synthesis, and validated models for unparalleled Remote Microgrid Market insights. See full methodology.

Market Scope
Page number 320
Base year 2025
Historic period 2020-2024
Forecast period 2026-2030
Growth momentum & CAGR Accelerate at a CAGR of 17.9%
Market growth 2026-2030 USD 14601.9 million
Market structure Fragmented
YoY growth 2025-2026(%) 17.0%
Key countries China, India, Japan, Australia, South Korea, Indonesia, US, Canada, Mexico, UK, Germany, France, Italy, Spain, The Netherlands, South Africa, Saudi Arabia, Turkey, UAE, Israel, Brazil, Argentina and Colombia
Competitive landscape Leading Companies, Market Positioning of Companies, Competitive Strategies, and Industry Risks

Request Free Sample

Research Analyst Overview

  • Advanced decentralized power networks are rapidly maturing to support the complex energy requirements of isolated industrial and residential applications. The transition toward intelligent edge computing control units empowers operational leaders to optimize power generation dynamically, ensuring continuous asset uptime across hostile geographic locations.
  • Strategically, the integration of green hydrogen electrolyzers shifts boardroom discussions from short-term fuel procurement to long-term operational sustainability, fundamentally altering compliance strategies across the resource extraction sector. Enterprise adoption of modular containerized systems has accelerated infrastructure deployment, directly resulting in a 30% reduction in upfront site engineering hours.
  • Furthermore, sophisticated energy management controllers interpret real-time generation variables, utilizing advanced bi-directional inverters and grid-forming inverters to maintain absolute network equilibrium. By combining these digital advancements with robust lithium-ion energy storage systems, enterprises maintain absolute power continuity. Implementing comprehensive black-start recovery protocols ensures rapid facility restoration following catastrophic isolated failures, securing essential production quotas.
  • Ultimately, these localized power architectures resolve systemic fuel dependency vulnerabilities while optimizing total capital asset utilization.

What are the Key Data Covered in this Remote Microgrid Market Research and Growth Report?

  • What is the expected growth of the Remote Microgrid Market between 2026 and 2030?

    • USD 14.60 billion, at a CAGR of 17.9%

  • What segmentation does the market report cover?

    • The report is segmented by Type (Off-grid microgrid, Hybrid microgrid, and Grid-connected microgrid), End-user (Remote communities, Mining, Military and defense, Oil and gas, and Others), Source (Diesel, Solar PV, Hybrid, Wind, and Hydro) and Geography (APAC, North America, Europe, Middle East and Africa, South America)

  • Which regions are analyzed in the report?

    • APAC, North America, Europe, Middle East and Africa and South America

  • What are the key growth drivers and market challenges?

    • Increasing demand for uninterrupted power in off-grid mining and industrial operations, Substantial capital costs and logistical obstacles in distant locations

  • Who are the major players in the Remote Microgrid Market?

    • ABB Ltd., Aggreko Plc, Bloom Energy Corp., Caterpillar Inc., Cummins Inc., Discovery Energy LLC, ENGIE SA, Generac Power Systems Inc., Hitachi Energy India Ltd., OMC Power Pvt. Ltd., Powerhive Inc., Rolls Royce Holdings Plc, S and C Electric Co., Saft Groupe SAS, Schneider Electric SE, Siemens AG, Tesla Inc., Victron Energy BV, Wartsila Corp. and Yanmar Holdings Co. Ltd.

Market Research Insights

  • Remote Microgrid architectures deliver vital power autonomy for operations situated beyond the reach of centralized transmission networks. To guarantee telecommunications tower resilience and support off-grid industrial loads, developers are scaling localized generation capabilities. Implementing rigorous load shedding management enables facilities to reduce operational downtime by 28% during severe weather events.
  • Additionally, predictive maintenance alerts identify component degradation early, lowering emergency repair costs by 15% annually. Utilizing these systems for fringe-of-grid support minimizes utility constraint penalties, offering a strong return on investment while resolving complex logistical supply line optimization challenges.
  • By accelerating the deployment of hybridized networks, companies can proactively avoid carbon emission penalties and achieve robust operational independence in increasingly volatile geopolitical climates.

We can help! Our analysts can customize this remote microgrid market research report to meet your requirements.

Get in touch

1. Executive Summary

1.1 Market overview

Executive Summary - Chart on Market Overview
Executive Summary - Data Table on Market Overview
Executive Summary - Chart on Global Market Characteristics
Executive Summary - Chart on Market by Geography
Executive Summary - Chart on Market Segmentation by Type
Executive Summary - Chart on Market Segmentation by End-user
Executive Summary - Chart on Market Segmentation by Source
Executive Summary - Chart on Incremental Growth
Executive Summary - Data Table on Incremental Growth
Executive Summary - Chart on Company Market Positioning

2. Technavio Analysis

2.1 Analysis of price sensitivity, lifecycle, customer purchase basket, adoption rates, and purchase criteria

2.2 Criticality of inputs and Factors of differentiation

Chart on Overview on criticality of inputs and factors of differentiation

2.3 Factors of disruption

Chart on Overview on factors of disruption

2.4 Impact of drivers and challenges

Chart on Impact of drivers and challenges in 2025 and 2030

3. Market Landscape

3.1 Market ecosystem

Chart on Parent Market
Data Table on - Parent Market

3.2 Market characteristics

Chart on Market characteristics analysis

3.3 Value chain analysis

Chart on Value chain analysis

4. Market Sizing

4.1 Market definition

Data Table on Offerings of companies included in the market definition

4.2 Market segment analysis

Market segments

4.3 Market size 2025

4.4 Market outlook: Forecast for 2025-2030

Chart on Global - Market size and forecast 2025-2030 ($ million)
Data Table on Global - Market size and forecast 2025-2030 ($ million)
Chart on Global Market: Year-over-year growth 2025-2030 (%)
Data Table on Global Market: Year-over-year growth 2025-2030 (%)

5. Historic Market Size

5.1 Global Remote Microgrid Market 2020 - 2024

Historic Market Size - Data Table on Global Remote Microgrid Market 2020 - 2024 ($ million)

5.2 Type segment analysis 2020 - 2024

Historic Market Size - Type Segment 2020 - 2024 ($ million)

5.3 End-user segment analysis 2020 - 2024

Historic Market Size - End-user Segment 2020 - 2024 ($ million)

5.4 Source segment analysis 2020 - 2024

Historic Market Size - Source Segment 2020 - 2024 ($ million)

5.5 Geography segment analysis 2020 - 2024

Historic Market Size - Geography Segment 2020 - 2024 ($ million)

5.6 Country segment analysis 2020 - 2024

Historic Market Size - Country Segment 2020 - 2024 ($ million)

6. Qualitative Analysis

6.1 Impact of AI on Global Remote Microgrid Market

6.2 Impact of Geopolitical Conflicts on Global Remote Microgrid Market

7. Five Forces Analysis

7.1 Five forces summary

Five forces analysis - Comparison between 2025 and 2030

7.2 Bargaining power of buyers

Bargaining power of buyers - Impact of key factors 2025 and 2030

7.3 Bargaining power of suppliers

Bargaining power of suppliers - Impact of key factors in 2025 and 2030

7.4 Threat of new entrants

Threat of new entrants - Impact of key factors in 2025 and 2030

7.5 Threat of substitutes

Threat of substitutes - Impact of key factors in 2025 and 2030

7.6 Threat of rivalry

Threat of rivalry - Impact of key factors in 2025 and 2030

7.7 Market condition

Chart on Market condition - Five forces 2025 and 2030

8. Market Segmentation by Type

8.1 Market segments

Chart on Type - Market share 2025-2030 (%)
Data Table on Type - Market share 2025-2030 (%)

8.2 Comparison by Type

Chart on Comparison by Type
Data Table on Comparison by Type

8.3 Off-grid microgrid - Market size and forecast 2025-2030

Chart on Off-grid microgrid - Market size and forecast 2025-2030 ($ million)
Data Table on Off-grid microgrid - Market size and forecast 2025-2030 ($ million)
Chart on Off-grid microgrid - Year-over-year growth 2025-2030 (%)
Data Table on Off-grid microgrid - Year-over-year growth 2025-2030 (%)

8.4 Hybrid microgrid - Market size and forecast 2025-2030

Chart on Hybrid microgrid - Market size and forecast 2025-2030 ($ million)
Data Table on Hybrid microgrid - Market size and forecast 2025-2030 ($ million)
Chart on Hybrid microgrid - Year-over-year growth 2025-2030 (%)
Data Table on Hybrid microgrid - Year-over-year growth 2025-2030 (%)

8.5 Grid-connected microgrid - Market size and forecast 2025-2030

Chart on Grid-connected microgrid - Market size and forecast 2025-2030 ($ million)
Data Table on Grid-connected microgrid - Market size and forecast 2025-2030 ($ million)
Chart on Grid-connected microgrid - Year-over-year growth 2025-2030 (%)
Data Table on Grid-connected microgrid - Year-over-year growth 2025-2030 (%)

8.6 Market opportunity by Type

Market opportunity by Type ($ million)
Data Table on Market opportunity by Type ($ million)

9. Market Segmentation by End-user

9.1 Market segments

Chart on End-user - Market share 2025-2030 (%)
Data Table on End-user - Market share 2025-2030 (%)

9.2 Comparison by End-user

Chart on Comparison by End-user
Data Table on Comparison by End-user

9.3 Remote communities - Market size and forecast 2025-2030

Chart on Remote communities - Market size and forecast 2025-2030 ($ million)
Data Table on Remote communities - Market size and forecast 2025-2030 ($ million)
Chart on Remote communities - Year-over-year growth 2025-2030 (%)
Data Table on Remote communities - Year-over-year growth 2025-2030 (%)

9.4 Mining - Market size and forecast 2025-2030

Chart on Mining - Market size and forecast 2025-2030 ($ million)
Data Table on Mining - Market size and forecast 2025-2030 ($ million)
Chart on Mining - Year-over-year growth 2025-2030 (%)
Data Table on Mining - Year-over-year growth 2025-2030 (%)

9.5 Military and defense - Market size and forecast 2025-2030

Chart on Military and defense - Market size and forecast 2025-2030 ($ million)
Data Table on Military and defense - Market size and forecast 2025-2030 ($ million)
Chart on Military and defense - Year-over-year growth 2025-2030 (%)
Data Table on Military and defense - Year-over-year growth 2025-2030 (%)

9.6 Oil and gas - Market size and forecast 2025-2030

Chart on Oil and gas - Market size and forecast 2025-2030 ($ million)
Data Table on Oil and gas - Market size and forecast 2025-2030 ($ million)
Chart on Oil and gas - Year-over-year growth 2025-2030 (%)
Data Table on Oil and gas - Year-over-year growth 2025-2030 (%)

9.7 Others - Market size and forecast 2025-2030

Chart on Others - Market size and forecast 2025-2030 ($ million)
Data Table on Others - Market size and forecast 2025-2030 ($ million)
Chart on Others - Year-over-year growth 2025-2030 (%)
Data Table on Others - Year-over-year growth 2025-2030 (%)

9.8 Market opportunity by End-user

Market opportunity by End-user ($ million)
Data Table on Market opportunity by End-user ($ million)

10. Market Segmentation by Source

10.1 Market segments

Chart on Source - Market share 2025-2030 (%)
Data Table on Source - Market share 2025-2030 (%)

10.2 Comparison by Source

Chart on Comparison by Source
Data Table on Comparison by Source

10.3 Diesel - Market size and forecast 2025-2030

Chart on Diesel - Market size and forecast 2025-2030 ($ million)
Data Table on Diesel - Market size and forecast 2025-2030 ($ million)
Chart on Diesel - Year-over-year growth 2025-2030 (%)
Data Table on Diesel - Year-over-year growth 2025-2030 (%)

10.4 Solar PV - Market size and forecast 2025-2030

Chart on Solar PV - Market size and forecast 2025-2030 ($ million)
Data Table on Solar PV - Market size and forecast 2025-2030 ($ million)
Chart on Solar PV - Year-over-year growth 2025-2030 (%)
Data Table on Solar PV - Year-over-year growth 2025-2030 (%)

10.5 Hybrid - Market size and forecast 2025-2030

Chart on Hybrid - Market size and forecast 2025-2030 ($ million)
Data Table on Hybrid - Market size and forecast 2025-2030 ($ million)
Chart on Hybrid - Year-over-year growth 2025-2030 (%)
Data Table on Hybrid - Year-over-year growth 2025-2030 (%)

10.6 Wind - Market size and forecast 2025-2030

Chart on Wind - Market size and forecast 2025-2030 ($ million)
Data Table on Wind - Market size and forecast 2025-2030 ($ million)
Chart on Wind - Year-over-year growth 2025-2030 (%)
Data Table on Wind - Year-over-year growth 2025-2030 (%)

10.7 Hydro - Market size and forecast 2025-2030

Chart on Hydro - Market size and forecast 2025-2030 ($ million)
Data Table on Hydro - Market size and forecast 2025-2030 ($ million)
Chart on Hydro - Year-over-year growth 2025-2030 (%)
Data Table on Hydro - Year-over-year growth 2025-2030 (%)

10.8 Market opportunity by Source

Market opportunity by Source ($ million)
Data Table on Market opportunity by Source ($ million)

11. Customer Landscape

11.1 Customer landscape overview

Analysis of price sensitivity, lifecycle, customer purchase basket, adoption rates, and purchase criteria

12. Geographic Landscape

12.1 Geographic segmentation

Chart on Market share by geography 2025-2030 (%)
Data Table on Market share by geography 2025-2030 (%)

12.2 Geographic comparison

Chart on Geographic comparison
Data Table on Geographic comparison

12.3 APAC - Market size and forecast 2025-2030

Chart on APAC - Market size and forecast 2025-2030 ($ million)
Data Table on APAC - Market size and forecast 2025-2030 ($ million)
Chart on APAC - Year-over-year growth 2025-2030 (%)
Data Table on APAC - Year-over-year growth 2025-2030 (%)
Chart on Regional Comparison - APAC
Data Table on Regional Comparison - APAC

12.3.1 China - Market size and forecast 2025-2030

Chart on China - Market size and forecast 2025-2030 ($ million)
Data Table on China - Market size and forecast 2025-2030 ($ million)
Chart on China - Year-over-year growth 2025-2030 (%)
Data Table on China - Year-over-year growth 2025-2030 (%)

12.3.2 India - Market size and forecast 2025-2030

Chart on India - Market size and forecast 2025-2030 ($ million)
Data Table on India - Market size and forecast 2025-2030 ($ million)
Chart on India - Year-over-year growth 2025-2030 (%)
Data Table on India - Year-over-year growth 2025-2030 (%)

12.3.3 Japan - Market size and forecast 2025-2030

Chart on Japan - Market size and forecast 2025-2030 ($ million)
Data Table on Japan - Market size and forecast 2025-2030 ($ million)
Chart on Japan - Year-over-year growth 2025-2030 (%)
Data Table on Japan - Year-over-year growth 2025-2030 (%)

12.3.4 Australia - Market size and forecast 2025-2030

Chart on Australia - Market size and forecast 2025-2030 ($ million)
Data Table on Australia - Market size and forecast 2025-2030 ($ million)
Chart on Australia - Year-over-year growth 2025-2030 (%)
Data Table on Australia - Year-over-year growth 2025-2030 (%)

12.3.5 South Korea - Market size and forecast 2025-2030

Chart on South Korea - Market size and forecast 2025-2030 ($ million)
Data Table on South Korea - Market size and forecast 2025-2030 ($ million)
Chart on South Korea - Year-over-year growth 2025-2030 (%)
Data Table on South Korea - Year-over-year growth 2025-2030 (%)

12.3.6 Indonesia - Market size and forecast 2025-2030

Chart on Indonesia - Market size and forecast 2025-2030 ($ million)
Data Table on Indonesia - Market size and forecast 2025-2030 ($ million)
Chart on Indonesia - Year-over-year growth 2025-2030 (%)
Data Table on Indonesia - Year-over-year growth 2025-2030 (%)

12.4 North America - Market size and forecast 2025-2030

Chart on North America - Market size and forecast 2025-2030 ($ million)
Data Table on North America - Market size and forecast 2025-2030 ($ million)
Chart on North America - Year-over-year growth 2025-2030 (%)
Data Table on North America - Year-over-year growth 2025-2030 (%)
Chart on Regional Comparison - North America
Data Table on Regional Comparison - North America

12.4.1 US - Market size and forecast 2025-2030

Chart on US - Market size and forecast 2025-2030 ($ million)
Data Table on US - Market size and forecast 2025-2030 ($ million)
Chart on US - Year-over-year growth 2025-2030 (%)
Data Table on US - Year-over-year growth 2025-2030 (%)

12.4.2 Canada - Market size and forecast 2025-2030

Chart on Canada - Market size and forecast 2025-2030 ($ million)
Data Table on Canada - Market size and forecast 2025-2030 ($ million)
Chart on Canada - Year-over-year growth 2025-2030 (%)
Data Table on Canada - Year-over-year growth 2025-2030 (%)

12.4.3 Mexico - Market size and forecast 2025-2030

Chart on Mexico - Market size and forecast 2025-2030 ($ million)
Data Table on Mexico - Market size and forecast 2025-2030 ($ million)
Chart on Mexico - Year-over-year growth 2025-2030 (%)
Data Table on Mexico - Year-over-year growth 2025-2030 (%)

12.5 Europe - Market size and forecast 2025-2030

Chart on Europe - Market size and forecast 2025-2030 ($ million)
Data Table on Europe - Market size and forecast 2025-2030 ($ million)
Chart on Europe - Year-over-year growth 2025-2030 (%)
Data Table on Europe - Year-over-year growth 2025-2030 (%)
Chart on Regional Comparison - Europe
Data Table on Regional Comparison - Europe

12.5.1 UK - Market size and forecast 2025-2030

Chart on UK - Market size and forecast 2025-2030 ($ million)
Data Table on UK - Market size and forecast 2025-2030 ($ million)
Chart on UK - Year-over-year growth 2025-2030 (%)
Data Table on UK - Year-over-year growth 2025-2030 (%)

12.5.2 Germany - Market size and forecast 2025-2030

Chart on Germany - Market size and forecast 2025-2030 ($ million)
Data Table on Germany - Market size and forecast 2025-2030 ($ million)
Chart on Germany - Year-over-year growth 2025-2030 (%)
Data Table on Germany - Year-over-year growth 2025-2030 (%)

12.5.3 France - Market size and forecast 2025-2030

Chart on France - Market size and forecast 2025-2030 ($ million)
Data Table on France - Market size and forecast 2025-2030 ($ million)
Chart on France - Year-over-year growth 2025-2030 (%)
Data Table on France - Year-over-year growth 2025-2030 (%)

12.5.4 Italy - Market size and forecast 2025-2030

Chart on Italy - Market size and forecast 2025-2030 ($ million)
Data Table on Italy - Market size and forecast 2025-2030 ($ million)
Chart on Italy - Year-over-year growth 2025-2030 (%)
Data Table on Italy - Year-over-year growth 2025-2030 (%)

12.5.5 Spain - Market size and forecast 2025-2030

Chart on Spain - Market size and forecast 2025-2030 ($ million)
Data Table on Spain - Market size and forecast 2025-2030 ($ million)
Chart on Spain - Year-over-year growth 2025-2030 (%)
Data Table on Spain - Year-over-year growth 2025-2030 (%)

12.5.6 The Netherlands - Market size and forecast 2025-2030

Chart on The Netherlands - Market size and forecast 2025-2030 ($ million)
Data Table on The Netherlands - Market size and forecast 2025-2030 ($ million)
Chart on The Netherlands - Year-over-year growth 2025-2030 (%)
Data Table on The Netherlands - Year-over-year growth 2025-2030 (%)

12.6 Middle East and Africa - Market size and forecast 2025-2030

Chart on Middle East and Africa - Market size and forecast 2025-2030 ($ million)
Data Table on Middle East and Africa - Market size and forecast 2025-2030 ($ million)
Chart on Middle East and Africa - Year-over-year growth 2025-2030 (%)
Data Table on Middle East and Africa - Year-over-year growth 2025-2030 (%)
Chart on Regional Comparison - Middle East and Africa
Data Table on Regional Comparison - Middle East and Africa

12.6.1 South Africa - Market size and forecast 2025-2030

Chart on South Africa - Market size and forecast 2025-2030 ($ million)
Data Table on South Africa - Market size and forecast 2025-2030 ($ million)
Chart on South Africa - Year-over-year growth 2025-2030 (%)
Data Table on South Africa - Year-over-year growth 2025-2030 (%)

12.6.2 Saudi Arabia - Market size and forecast 2025-2030

Chart on Saudi Arabia - Market size and forecast 2025-2030 ($ million)
Data Table on Saudi Arabia - Market size and forecast 2025-2030 ($ million)
Chart on Saudi Arabia - Year-over-year growth 2025-2030 (%)
Data Table on Saudi Arabia - Year-over-year growth 2025-2030 (%)

12.6.3 Turkey - Market size and forecast 2025-2030

Chart on Turkey - Market size and forecast 2025-2030 ($ million)
Data Table on Turkey - Market size and forecast 2025-2030 ($ million)
Chart on Turkey - Year-over-year growth 2025-2030 (%)
Data Table on Turkey - Year-over-year growth 2025-2030 (%)

12.6.4 UAE - Market size and forecast 2025-2030

Chart on UAE - Market size and forecast 2025-2030 ($ million)
Data Table on UAE - Market size and forecast 2025-2030 ($ million)
Chart on UAE - Year-over-year growth 2025-2030 (%)
Data Table on UAE - Year-over-year growth 2025-2030 (%)

12.6.5 Israel - Market size and forecast 2025-2030

Chart on Israel - Market size and forecast 2025-2030 ($ million)
Data Table on Israel - Market size and forecast 2025-2030 ($ million)
Chart on Israel - Year-over-year growth 2025-2030 (%)
Data Table on Israel - Year-over-year growth 2025-2030 (%)

12.7 South America - Market size and forecast 2025-2030

Chart on South America - Market size and forecast 2025-2030 ($ million)
Data Table on South America - Market size and forecast 2025-2030 ($ million)
Chart on South America - Year-over-year growth 2025-2030 (%)
Data Table on South America - Year-over-year growth 2025-2030 (%)
Chart on Regional Comparison - South America
Data Table on Regional Comparison - South America

12.7.1 Brazil - Market size and forecast 2025-2030

Chart on Brazil - Market size and forecast 2025-2030 ($ million)
Data Table on Brazil - Market size and forecast 2025-2030 ($ million)
Chart on Brazil - Year-over-year growth 2025-2030 (%)
Data Table on Brazil - Year-over-year growth 2025-2030 (%)

12.7.2 Argentina - Market size and forecast 2025-2030

Chart on Argentina - Market size and forecast 2025-2030 ($ million)
Data Table on Argentina - Market size and forecast 2025-2030 ($ million)
Chart on Argentina - Year-over-year growth 2025-2030 (%)
Data Table on Argentina - Year-over-year growth 2025-2030 (%)

12.7.3 Colombia - Market size and forecast 2025-2030

Chart on Colombia - Market size and forecast 2025-2030 ($ million)
Data Table on Colombia - Market size and forecast 2025-2030 ($ million)
Chart on Colombia - Year-over-year growth 2025-2030 (%)
Data Table on Colombia - Year-over-year growth 2025-2030 (%)

12.8 Market opportunity by geography

Market opportunity by geography ($ million)
Data Tables on Market opportunity by geography ($ million)

13. Drivers, Challenges, and Opportunity

13.1 Market drivers

Increasing demand for uninterrupted power in off-grid mining and industrial operations
Declining costs of renewable generation infrastructure and energy storage solutions
Strategic government policies and rural electrification directives

13.2 Market challenges

Substantial capital costs and logistical obstacles in distant locations
Integration complexities and maintenance constraints in harsh environments
Regulatory ambiguity and long-term commercial sustainability risks

13.3 Impact of drivers and challenges

Impact of drivers and challenges in 2025 and 2030

13.4 Market opportunities

Integration of edge computing and AI for autonomous microgrid control
Commercialization of prefabricated and containerized plug-and-play architecture
Adoption of green hydrogen fuel cells for seasonal long-duration energy storage

14. Competitive Landscape

14.1 Overview

14.2

Overview on criticality of inputs and factors of differentiation

14.3 Landscape disruption

Overview on factors of disruption

14.4 Industry risks

Impact of key risks on business

15. Competitive Analysis

15.1 Companies profiled

Companies covered

15.2 Company ranking index

15.3 Market positioning of companies

Matrix on companies position and classification

15.4 ABB Ltd.

ABB Ltd. - Overview
ABB Ltd. - Business segments
ABB Ltd. - Key news
ABB Ltd. - Key offerings
ABB Ltd. - Segment focus
SWOT

15.5 Aggreko Plc

Aggreko Plc - Overview
Aggreko Plc - Product / Service
Aggreko Plc - Key offerings
SWOT

15.6 Bloom Energy Corp.

Bloom Energy Corp. - Overview
Bloom Energy Corp. - Product / Service
Bloom Energy Corp. - Key news
Bloom Energy Corp. - Key offerings
SWOT

15.7 Caterpillar Inc.

Caterpillar Inc. - Overview
Caterpillar Inc. - Business segments
Caterpillar Inc. - Key offerings
Caterpillar Inc. - Segment focus
SWOT

15.8 Cummins Inc.

Cummins Inc. - Overview
Cummins Inc. - Business segments
Cummins Inc. - Key news
Cummins Inc. - Key offerings
Cummins Inc. - Segment focus
SWOT

15.9 Discovery Energy LLC

Discovery Energy LLC - Overview
Discovery Energy LLC - Product / Service
Discovery Energy LLC - Key offerings
SWOT

15.10 ENGIE SA

ENGIE SA - Overview
ENGIE SA - Business segments
ENGIE SA - Key news
ENGIE SA - Key offerings
ENGIE SA - Segment focus
SWOT

15.11 Generac Power Systems Inc.

Generac Power Systems Inc. - Overview
Generac Power Systems Inc. - Business segments
Generac Power Systems Inc. - Key news
Generac Power Systems Inc. - Key offerings
Generac Power Systems Inc. - Segment focus
SWOT

15.12 Hitachi Energy India Ltd.

Hitachi Energy India Ltd. - Overview
Hitachi Energy India Ltd. - Product / Service
Hitachi Energy India Ltd. - Key offerings
SWOT

15.13 Rolls Royce Holdings Plc

Rolls Royce Holdings Plc - Overview
Rolls Royce Holdings Plc - Business segments
Rolls Royce Holdings Plc - Key news
Rolls Royce Holdings Plc - Key offerings
Rolls Royce Holdings Plc - Segment focus
SWOT

15.14 S and C Electric Co.

S and C Electric Co. - Overview
S and C Electric Co. - Product / Service
S and C Electric Co. - Key offerings
SWOT

15.15 Saft Groupe SAS

Saft Groupe SAS - Overview
Saft Groupe SAS - Product / Service
Saft Groupe SAS - Key offerings
SWOT

15.16 Schneider Electric SE

Schneider Electric SE - Overview
Schneider Electric SE - Business segments
Schneider Electric SE - Key news
Schneider Electric SE - Key offerings
Schneider Electric SE - Segment focus
SWOT

15.17 Siemens AG

Siemens AG - Overview
Siemens AG - Business segments
Siemens AG - Key news
Siemens AG - Key offerings
Siemens AG - Segment focus
SWOT

15.18 Tesla Inc.

Tesla Inc. - Overview
Tesla Inc. - Business segments
Tesla Inc. - Key offerings
Tesla Inc. - Segment focus
SWOT

16. Appendix

16.1 Scope of the report

Market definition
Objectives
Notes and caveats

16.2 Inclusions and exclusions checklist

Inclusions checklist
Exclusions checklist

16.3 Currency conversion rates for US$

16.4 Research methodology

16.5 Data procurement

Information sources

16.6 Data validation

16.7 Validation techniques employed for market sizing

16.8 Data synthesis

16.9 360 degree market analysis

16.10 List of abbreviations

Research Methodology

Technavio presents a detailed picture of the market by way of study, synthesis, and summation of data from multiple sources. The analysts have presented the various facets of the market with a particular focus on identifying the key industry influencers. The data thus presented is comprehensive, reliable, and the result of extensive research, both primary and secondary.

INFORMATION SOURCES

Primary sources

  • Manufacturers and suppliers
  • Channel partners
  • Industry experts
  • Strategic decision makers

Secondary sources

  • Industry journals and periodicals
  • Government data
  • Financial reports of key industry players
  • Historical data
  • Press releases

DATA ANALYSIS

Data Synthesis

  • Collation of data
  • Estimation of key figures
  • Analysis of derived insights

Data Validation

  • Triangulation with data models
  • Reference against proprietary databases
  • Corroboration with industry experts

REPORT WRITING

Qualitative

  • Market drivers
  • Market challenges
  • Market trends
  • Five forces analysis

Quantitative

  • Market size and forecast
  • Market segmentation
  • Geographical insights
  • Competitive landscape

Interested in this report?

Get your sample now to see our research methodology and insights!

Download Now

Frequently Asked Questions

Remote Microgrid market growth will increase by USD 14601.9 million during 2026-2030.

The Remote Microgrid market is expected to grow at a CAGR of 17.9% during 2026-2030.

Remote Microgrid market is segmented by Type (Off-grid microgrid, Hybrid microgrid, Grid-connected microgrid) End-user (Remote communities, Mining, Military and defense, Oil and gas, Others) Source (Diesel, Solar PV, Hybrid, Wind, Hydro)

ABB Ltd., Aggreko Plc, Bloom Energy Corp., Caterpillar Inc., Cummins Inc., Discovery Energy LLC, ENGIE SA, Generac Power Systems Inc., Hitachi Energy India Ltd., OMC Power Pvt. Ltd., Powerhive Inc., Rolls Royce Holdings Plc, S and C Electric Co., Saft Groupe SAS, Schneider Electric SE, Siemens AG, Tesla Inc., Victron Energy BV, Wartsila Corp., Yanmar Holdings Co. Ltd. are a few of the key vendors in the Remote Microgrid market.

APAC will register the highest growth rate of 37.1% among the other regions. Therefore, the Remote Microgrid market in APAC is expected to garner significant business opportunities for the vendors during the forecast period.

China, India, Japan, Australia, South Korea, Indonesia, US, Canada, Mexico, UK, Germany, France, Italy, Spain, The Netherlands, South Africa, Saudi Arabia, Turkey, UAE, Israel, Brazil, Argentina, Colombia

  • Increasing demand for uninterrupted power in off-grid mining and industrial operations is the driving factor this market.

The Remote Microgrid market vendors should focus on grabbing business opportunities from the Type segment as it accounted for the largest market share in the base year.
RIA - Research AI Assistant
Ask RIA
