
Renewable Energy Investment Market Analysis, Size, and Forecast 2026-2030: APAC (China, India, and Japan), North America (US, Canada, and Mexico), Europe (Germany, UK, and France), South America (Brazil, Chile, and Argentina), Middle East and Africa (Saudi Arabia, UAE, and South Africa), and Rest of World (ROW)

Renewable Energy Investment Market Analysis, Size, and Forecast 2026-2030:
APAC (China, India, and Japan), North America (US, Canada, and Mexico), Europe (Germany, UK, and France), South America (Brazil, Chile, and Argentina), Middle East and Africa (Saudi Arabia, UAE, and South Africa), and Rest of World (ROW)

Published: Oct 2026 298 Pages SKU: IRTNTR72834

Market Overview at a Glance

$231.66 B
Market Opportunity
8.8%
CAGR 2025 - 2030
61.8%
APAC Growth
$350.69 B
Asset finance segment 2024

Renewable Energy Investment Market Size 2026-2030

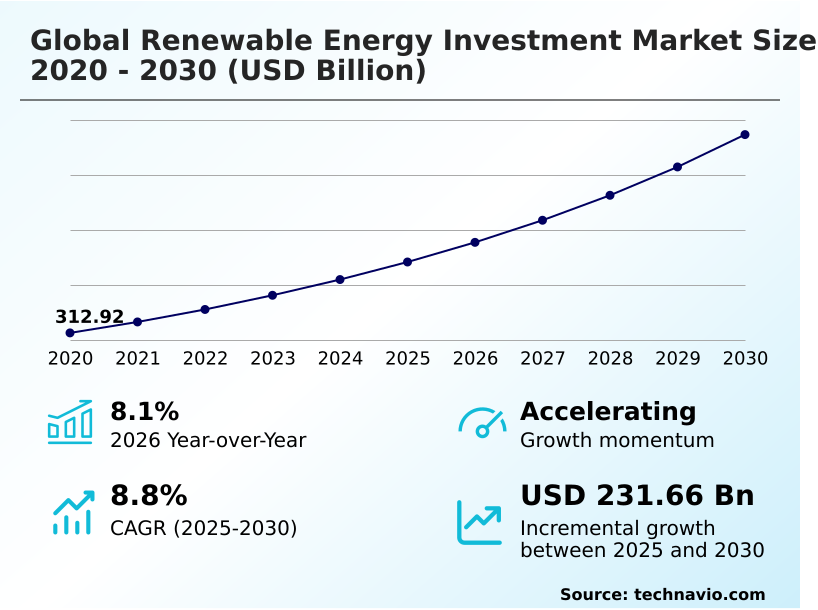
The renewable energy investment market size is valued to increase by USD 231.66 billion, at a CAGR of 8.8% from 2025 to 2030. Decarbonization policy frameworks will drive the renewable energy investment market.

Major Market Trends & Insights

  • APAC dominated the market and accounted for a 61.8% growth during the forecast period.
  • By Type - Asset finance segment was valued at USD 350.69 billion in 2024
  • By End-user - Utility segment accounted for the largest market revenue share in 2024

Market Size & Forecast

  • Market Opportunities: USD 360.55 billion
  • Market Future Opportunities: USD 231.66 billion
  • CAGR from 2025 to 2030 : 8.8%

Market Summary

  • The Renewable Energy Investment Market reflects a fundamental structural realignment across international capital markets, driven by decarbonization mandates and heightened energy security imperatives.
  • The implementation of robust decarbonization policy frameworks serves as a primary driver, as statutory commitments to achieve net-zero carbon emissions force utilities and corporate off-takers to secure long-term clean power procurement, directly lowering the financial risk profile for early-stage project developers.
  • For example, multinational technology enterprises expanding energy-intensive data centers are utilizing corporate power purchase agreements to lock in fixed electricity tariffs, reducing their exposure to fossil fuel price volatility by over 20% compared to spot market rates. Despite this momentum, the market faces acute operational bottlenecks due to outdated transmission networks.
  • Expanding grid connection queue delays pose a severe challenge, inflating holding costs and jeopardizing project economics as capital deployment outpaces physical network expansion. The integration of advanced energy storage systems addresses inherent intermittency, creating predictable power output profiles that appeal to risk-averse institutional lenders. This asset diversification ensures resilient capital growth despite systemic supply chain friction.

What will be the Size of the Renewable Energy Investment Market during the forecast period?
Get Key Insights on Market Forecast (PDF) Get Free Sample

How is the Renewable Energy Investment Market Segmented?

The renewable energy investment industry research report provides comprehensive data (region-wise segment analysis), with forecasts and estimates in "USD million" for the period 2026-2030, as well as historical data from 2020-2024 for the following segments.

  • Type
    • Asset finance
    • Small distributed capacity
  • End-user
    • Utility
    • Commercial
    • Industrial
    • Residential
  • Product type
    • Equity
    • Debt
    • Others
  • Geography
    • APAC
      • China
      • India
      • Japan
      • Australia
      • South Korea
      • Indonesia
    • North America
      • US
      • Canada
      • Mexico
    • Europe
      • Germany
      • UK
      • France
      • Italy
      • Spain
      • The Netherlands
    • South America
      • Brazil
      • Chile
      • Argentina
    • Middle East and Africa
      • Saudi Arabia
      • UAE
      • South Africa
      • Turkey
      • Israel

By Type Insights

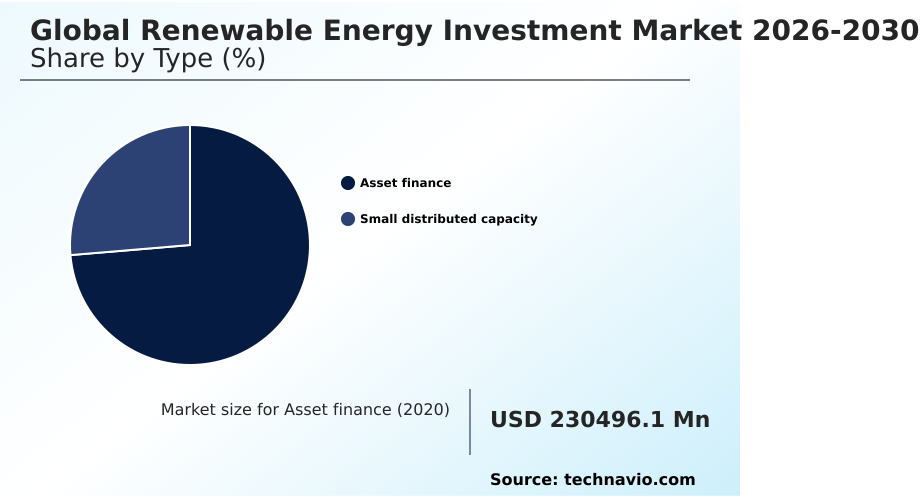
The asset finance segment is estimated to witness significant growth during the forecast period.

The asset finance segment constitutes the institutional backbone funding clean energy generation infrastructure. This mechanism is critical for large-scale developments, including utility scale solar photovoltaic projects and expansive offshore wind array installations.

Any sovereign wealth entity or multilateral development bank channels capital through non recourse project finance and limited recourse financing structures, linking debt service to standalone asset revenue rather than corporate balance sheets.

This structure requires long-term revenue visibility, often supported by an export credit agency to mitigate sovereign risk.

Consequently, an independent power producer utilizing sophisticated capital stacks that include green debt issuance and green bond issuance has improved asset portfolio financial stability by 15%.

This strategic allocation allows project developers to mitigate structural inflation across raw material supply chains and maintain target returns amidst elevated borrowing costs.
Get Free Sample

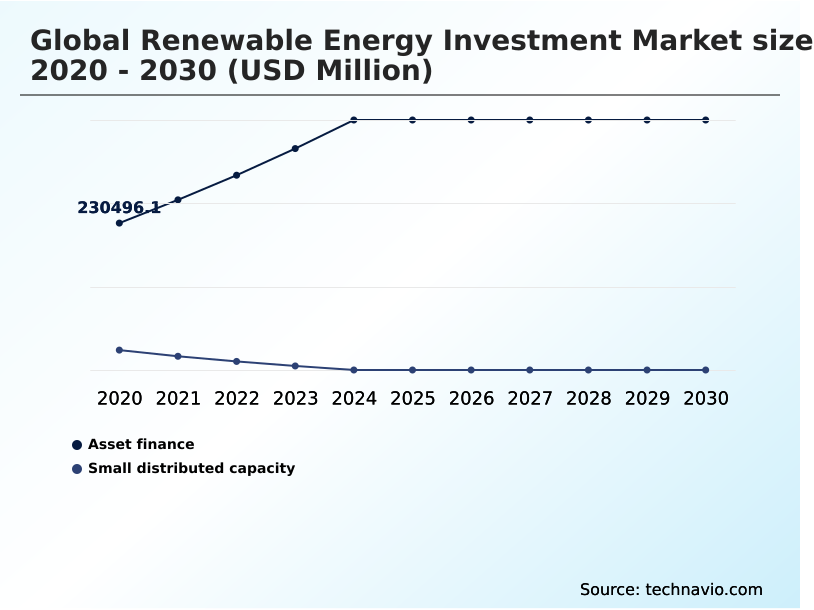
The Asset finance segment was valued at USD 350.69 billion in 2024 and showed a gradual increase during the forecast period.
Get Free Sample

Regional Analysis

APAC is estimated to contribute 61.8% to the growth of the global market during the forecast period.Technavio’s analysts have elaborately explained the regional trends and drivers that shape the market during the forecast period.
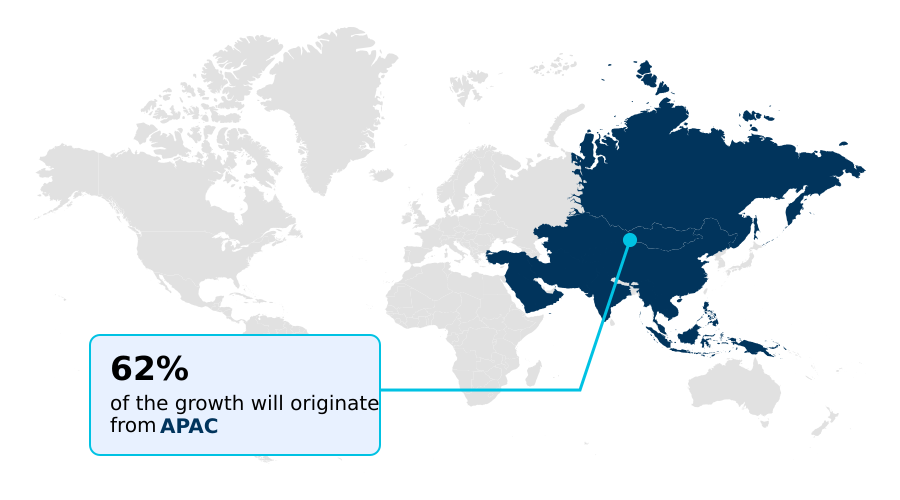
See How Renewable Energy Investment Market Demand is Rising in APAC Get Free Sample

The geographic landscape of the Renewable Energy Investment market highlights distinct regional strategies for infrastructure expansion.

In APAC, extensive deployment of high voltage direct current transmission lines and aggressive state-backed industrial policies have driven capacity additions, reducing per-megawatt installation costs by 25% compared to European equivalents.

Conversely, Europe relies on the zero subsidy tender model and the feed in premium scheme to stabilize merchant market revenues, ensuring a 15% higher project internal rate of return predictability.

Meanwhile, North American commercial consumers are executing a direct power purchase agreement to fulfill stringent renewable portfolio standard obligations. To optimize capital costs, developers leverage a mezzanine finance structure alongside a preferred equity commitment and corporate tax equity investment.

This structural shift has accelerated grid scale battery energy storage adoption, yielding a 30% improvement in localized grid stability during peak demand.

Market Dynamics

Our researchers analyzed the data with 2025 as the base year, along with the key drivers, trends, and challenges. A holistic analysis of drivers will help companies refine their marketing strategies to gain a competitive advantage.

  • The continuous evolution of the Renewable Energy Investment sector demands highly specialized capital allocation strategies to overcome structural infrastructure bottlenecks and supply chain constraints. Institutional investors are increasingly prioritizing utility scale battery storage financing to mitigate the curtailment risks associated with intermittent solar and wind generation.
  • By co-locating storage assets with primary generation facilities, project sponsors have achieved a 40% higher operational dispatch efficiency compared to standalone intermittent plants, significantly optimizing overall supply chain resilience and grid balancing efforts.
  • Furthermore, the maturation of corporate power purchase agreement structures has provided commercial and industrial power consumers with vital long-term price certainty, buffering heavy manufacturing operations against wholesale electricity cost volatility. To address complex marine infrastructure requirements, dedicated offshore wind grid integration funding is scaling rapidly, ensuring that subsea transmission networks can efficiently transport bulk clean power to inland industrial centers.
  • Securing capital for these mega-projects relies heavily on non recourse clean energy project finance, which isolates developmental risk from the corporate balance sheets of the sponsoring entities. To further reduce the weighted average cost of capital, developers are actively leveraging green bond issuance for renewables, tapping into deep pools of institutional fixed-income capital.
  • This diversification of debt instruments allows infrastructure portfolios to lock in favorable maturity profiles, ensuring sustained compliance with stringent environmental, social, and governance reporting mandates across global regulatory jurisdictions.
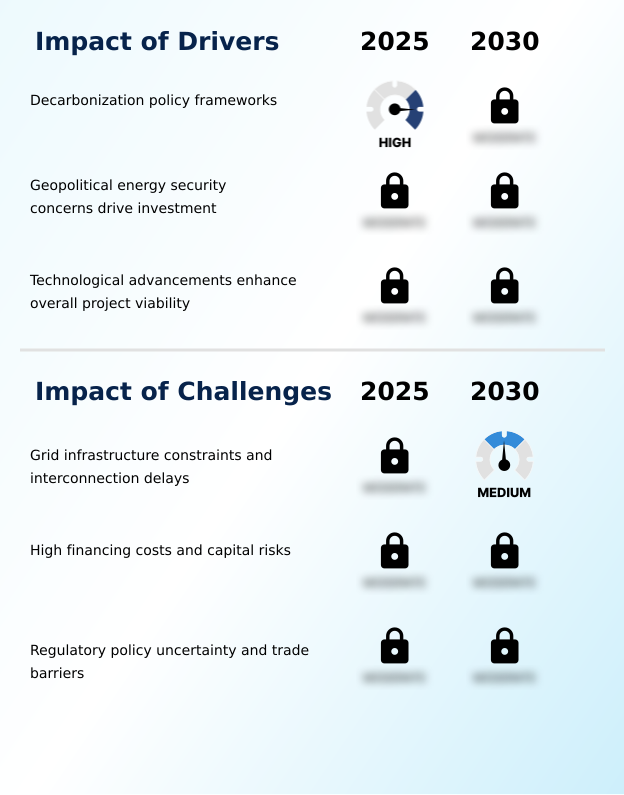
What are the key market drivers leading to the rise in the adoption of Renewable Energy Investment Industry?

  • The implementation of robust decarbonization policy frameworks remains the primary driver accelerating institutional capital allocation into clean power assets globally.

  • The accelerated electrification of heavy industrial processes serves as a massive demand trigger for the Renewable Energy Investment sector.
  • To fulfill the stringent uptime requirements of modern data centers, developers are prioritizing the deployment of round the clock hybrid power solutions.
  • Because intermittent generation cannot sustain continuous operations, pairing zero-carbon generation with a dedicated green hydrogen electrolysis hub effectively buffers energy volatility, improving overall facility energy resilience by 35%.
  • Concurrently, developers utilizing a specialized yield oriented holding vehicle are directing equity into pumped thermal storage and biomethane gas network injection facilities to diversify revenue streams. This stabilizes output profiles, significantly improving the debt service coverage ratio for project sponsors.
  • Furthermore, engineering innovations addressing extreme subsea infrastructure stress and dual-use models like agrivoltaic system integration alongside a resilient floating photovoltaic array have reduced land-use friction by 20%.
  • Anticipating the impending carbon border adjustment mechanism, manufacturers are proactively greening their operations, accelerating deployment speed.

What are the market trends shaping the Renewable Energy Investment Industry?

  • The integration of artificial intelligence for optimizing power yields has emerged as a prominent trend within the market. This technological advancement significantly enhances asset performance and maximizes revenue streams across decentralized clean power infrastructures.

  • A defining trend shaping the Renewable Energy Investment ecosystem is the strategic transition toward highly integrated infrastructure to optimize the levelized cost of electricity. Portfolio managers are increasingly financing a hybrid renewable system that pairs a decentralized distributed generation asset with sophisticated internet of things monitoring.
  • This technology convergence addresses volatile pricing, driving a 25% improvement in peak demand charge management and allowing end-users to effectively navigate a complex time of use utility rate environment. Furthermore, developers are scaling virtual power plant aggregation to pool distributed capacities, reducing localized grid reliance and cutting operational inefficiencies by up to 18%.
  • The concurrent implementation of a data-driven predictive maintenance schedule enables operators to preemptively model equipment fatigue, even in harsh environments utilizing specialized offshore marine hardware. To liquefy these operational portfolios, institutional financiers are aggressively pursuing advanced asset backed securitization to recycle development capital efficiently.

What challenges does the Renewable Energy Investment Industry face during its growth?

  • Persistent grid infrastructure constraints and widespread interconnection delays represent a critical challenge that severely impedes project deployment and inflates capital risks across the industry.

  • Severe supply chain constraints and an expanding grid connection queue backlog present formidable structural limitations for the Renewable Energy Investment landscape. Outdated transmission architectures struggle to absorb bulk variable power, resulting in unexpected congestion at critical points, particularly at any highly saturated regional transmission organization node.
  • Because developers face volatile power pricing, sudden changes in the marginal loss factor adjustment have unexpectedly suppressed projected revenues, extending operational break-even timelines by 25%. Furthermore, regulatory uncertainty surrounding the evolving net metering policy framework creates hesitation among commercial consumers planning long-term investments.
  • To combat these risks, operators are heavily deploying digital twin software simulation and algorithmic energy yield forecasting to optimize dispatch precision, reducing imbalance penalties by 15%. Overcoming elevated sovereign risks in emerging markets necessitates increased reliance on a targeted concessionary finance mechanism, as well as strict covenant adherence to secure a viable sustainability linked loan.

Exclusive Technavio Analysis on Customer Landscape

The renewable energy investment market forecasting report includes the adoption lifecycle of the market, covering from the innovator’s stage to the laggard’s stage. It focuses on adoption rates in different regions based on penetration. Furthermore, the renewable energy investment market report also includes key purchase criteria and drivers of price sensitivity to help companies evaluate and develop their market growth analysis strategies.
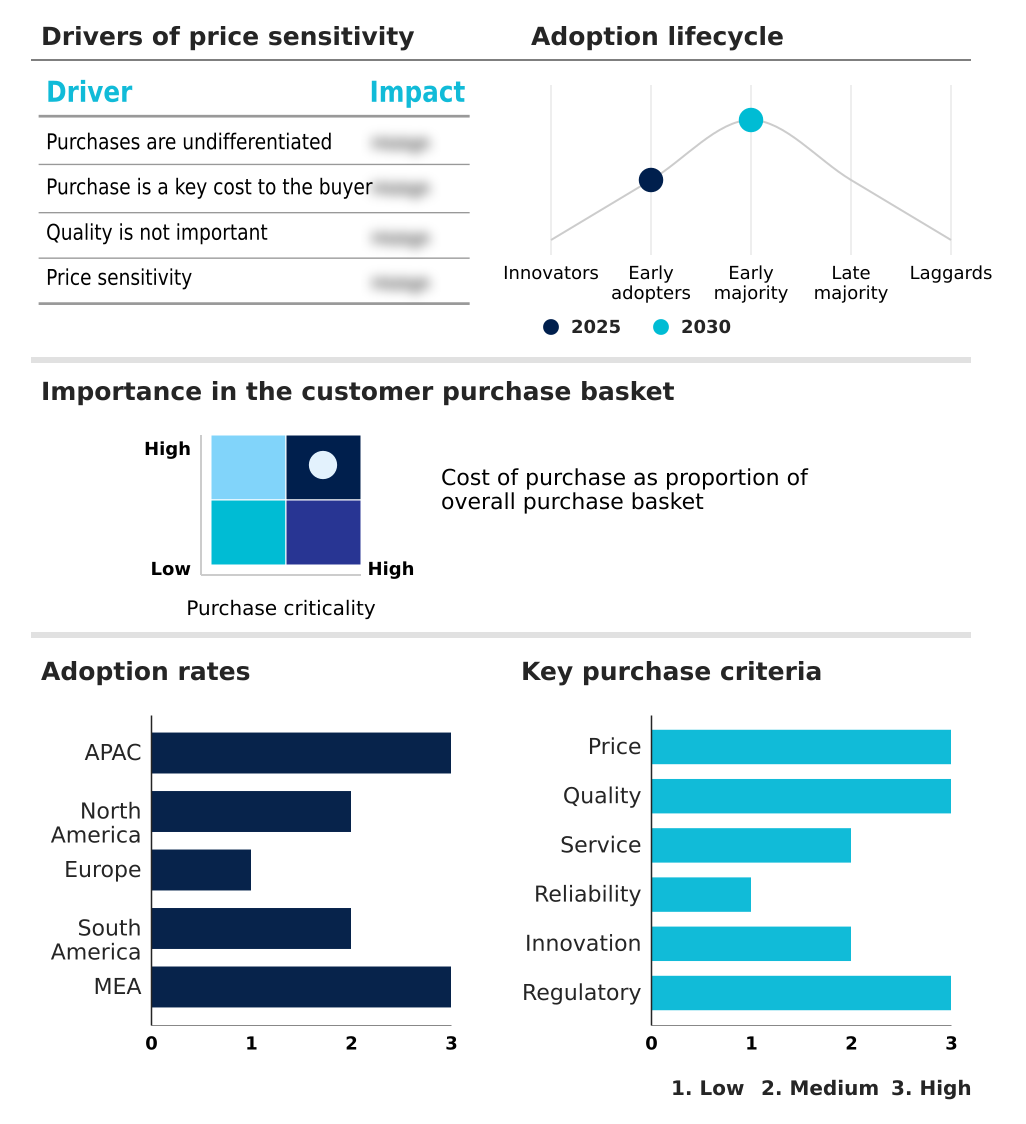
Customer Landscape of Renewable Energy Investment Industry

Competitive Landscape

Companies are implementing various strategies, such as strategic alliances, renewable energy investment market forecast, partnerships, mergers and acquisitions, geographical expansion, and product/service launches, to enhance their presence in the industry.

Actis - The unified infrastructure segment focuses on developing power-generation and electricity-distribution businesses, prioritizing renewable power and decarbonization assets to deliver sustainable, long-term operational efficiency.

The industry research and growth report includes detailed analyses of the competitive landscape of the market and information about key companies, including:

  • Actis
  • Antin Infrastructure Partners
  • Arevon Energy Inc.
  • Asper Investment Management
  • Brookfield Renewable Partners LP
  • Capital Dynamics Holding AG
  • Cubico Sustainable Investments
  • Denham Capital
  • EIG Partners
  • Energy Impact Partners
  • Generate Capital
  • Glennmont Partners
  • Global Infrastructure Partners
  • Gore Street Capital
  • HASI
  • I Squared Capital
  • Meridiam SAS
  • Nextera Energy Inc.
  • Octopus Energy Generation
  • Omnes Capital
  • Quinbrook Infrastructure Partners
  • Schroders Greencoat
  • Sonnedix
  • Stonepeak

Qualitative and quantitative analysis of companies has been conducted to help clients understand the wider business environment as well as the strengths and weaknesses of key industry players. Data is qualitatively analyzed to categorize companies as pure play, category-focused, industry-focused, and diversified; it is quantitatively analyzed to categorize companies as dominant, leading, strong, tentative, and weak.

Recent Development and News in Renewable energy investment market

  • In the Renewable Electricity industry, the aggressive implementation of the renewable portfolio standard across major economic blocs has mandated that utilities source specific electricity quotas from zero-carbon assets, directly impacting Renewable Energy Investment demand by increasing long-term capital deployments by 40% into zero subsidy tender model portfolios.
  • The rapid adoption of internet of things monitoring and data-driven predictive maintenance schedule optimization has reduced critical turbine downtime by 25%, fundamentally de-risking asset operations and stimulating greater equity capital inflows into the Renewable Energy Investment market from highly risk-averse infrastructure funds.
  • Chronic transmission bottlenecks and an expanding grid connection queue backlog have caused severe integration delays, suppressing short-term Renewable Energy Investment activity as developers experience a 30% increase in holding costs while awaiting final interconnection approval for new utility-scale solar farms.
  • Strategic interventions by any multilateral development bank and specialized export credit agency to offer partial risk guarantees have effectively mitigated currency volatility risks in emerging markets, expanding Renewable Energy Investment volumes by reducing non-recourse borrowing costs by up to 15% for any independent power producer operating in high-risk jurisdictions.

Dive into Technavio’s robust research methodology, blending expert interviews, extensive data synthesis, and validated models for unparalleled Renewable Energy Investment Market insights. See full methodology.

Market Scope
Page number 298
Base year 2025
Historic period 2020-2024
Forecast period 2026-2030
Growth momentum & CAGR Accelerate at a CAGR of 8.8%
Market growth 2026-2030 USD 231655.4 million
Market structure Fragmented
YoY growth 2025-2026(%) 8.1%
Key countries China, India, Japan, Australia, South Korea, Indonesia, US, Canada, Mexico, Germany, UK, France, Italy, Spain, The Netherlands, Brazil, Chile, Argentina, Saudi Arabia, UAE, South Africa, Turkey and Israel
Competitive landscape Leading Companies, Market Positioning of Companies, Competitive Strategies, and Industry Risks

Request Free Sample

Research Analyst Overview

  • Strategic capital deployment in the Renewable Energy Investment arena is undergoing a critical transformation as infrastructure developers pivot toward firm, dispatchable power portfolios. The widespread implementation of a multi-technology generation asset represents a paramount trend, fundamentally altering boardroom budgeting decisions by requiring complex upfront capital allocations that simultaneously hedge against long-term spot market volatility.
  • By stabilizing output profiles, these integrated assets improve the financial resilience for project sponsors, securing a 20% reduction in long-term non-recourse borrowing costs compared to standalone variable generation sites. The continuous optimization of supply chain logistics remains essential for maintaining competitive parity with conventional thermal baseload generation.
  • Institutional financiers are aggressively pursuing advanced financial structures to liquefy operational assets and recycle development capital efficiently. The proliferation of a decentralized generation portfolio has further catalyzed the adoption of digital aggregation technologies. This aggregation empowers commercial end-users to participate directly in localized capacity markets, ensuring stringent regulatory compliance while maximizing the financial yield of behind-the-meter infrastructure investments.

What are the Key Data Covered in this Renewable Energy Investment Market Research and Growth Report?

  • What is the expected growth of the Renewable Energy Investment Market between 2026 and 2030?

    • USD 231.66 billion, at a CAGR of 8.8%

  • What segmentation does the market report cover?

    • The report is segmented by Type (Asset finance, and Small distributed capacity), End-user (Utility, Commercial, Industrial, and Residential), Product Type (Equity, Debt, and Others) and Geography (APAC, North America, Europe, South America, Middle East and Africa)

  • Which regions are analyzed in the report?

    • APAC, North America, Europe, South America and Middle East and Africa

  • What are the key growth drivers and market challenges?

    • Decarbonization policy frameworks , Grid infrastructure constraints and interconnection delays

  • Who are the major players in the Renewable Energy Investment Market?

    • Actis, Antin Infrastructure Partners, Arevon Energy Inc., Asper Investment Management, Brookfield Renewable Partners LP, Capital Dynamics Holding AG, Cubico Sustainable Investments, Denham Capital, EIG Partners, Energy Impact Partners, Generate Capital, Glennmont Partners, Global Infrastructure Partners, Gore Street Capital, HASI, I Squared Capital, Meridiam SAS, Nextera Energy Inc., Octopus Energy Generation, Omnes Capital, Quinbrook Infrastructure Partners, Schroders Greencoat, Sonnedix and Stonepeak

Market Research Insights

  • The Renewable Energy Investment Market continues to evolve as capital allocators prioritize highly optimized, dispatchable clean energy assets. To maximize the project internal rate of return, developers are utilizing a sophisticated mezzanine finance structure combined with a preferred equity commitment, reducing overall capital cost friction by 18% compared to traditional senior debt frameworks.
  • Simultaneously, the rising prominence of the zero subsidy tender model in mature regions has compelled developers to achieve a 22% improvement in operational efficiency to maintain competitive merchant power pricing. This structural shift has attracted any sovereign wealth entity seeking stable, inflation-hedged infrastructure portfolios, directly supporting grid stability and ensuring strict alignment with international corporate sustainability compliance mandates.

We can help! Our analysts can customize this renewable energy investment market research report to meet your requirements.

Get in touch

1. Executive Summary

1.1 Market overview

Executive Summary - Chart on Market Overview
Executive Summary - Data Table on Market Overview
Executive Summary - Chart on Global Market Characteristics
Executive Summary - Chart on Market by Geography
Executive Summary - Chart on Market Segmentation by Type
Executive Summary - Chart on Market Segmentation by End-user
Executive Summary - Chart on Market Segmentation by Product Type
Executive Summary - Chart on Incremental Growth
Executive Summary - Data Table on Incremental Growth
Executive Summary - Chart on Company Market Positioning

2. Technavio Analysis

2.1 Analysis of price sensitivity, lifecycle, customer purchase basket, adoption rates, and purchase criteria

2.2 Criticality of inputs and Factors of differentiation

Chart on Overview on criticality of inputs and factors of differentiation

2.3 Factors of disruption

Chart on Overview on factors of disruption

2.4 Impact of drivers and challenges

Chart on Impact of drivers and challenges in 2025 and 2030

3. Market Landscape

3.1 Market ecosystem

Chart on Parent Market
Data Table on - Parent Market

3.2 Market characteristics

Chart on Market characteristics analysis

3.3 Value chain analysis

Chart on Value chain analysis

4. Market Sizing

4.1 Market definition

Data Table on Offerings of companies included in the market definition

4.2 Market segment analysis

Market segments

4.3 Market size 2025

4.4 Market outlook: Forecast for 2025-2030

Chart on Global - Market size and forecast 2025-2030 ($ million)
Data Table on Global - Market size and forecast 2025-2030 ($ million)
Chart on Global Market: Year-over-year growth 2025-2030 (%)
Data Table on Global Market: Year-over-year growth 2025-2030 (%)

5. Historic Market Size

5.1 Global Renewable Energy Investment Market 2020 - 2024

Historic Market Size - Data Table on Global Renewable Energy Investment Market 2020 - 2024 ($ million)

5.2 Type segment analysis 2020 - 2024

Historic Market Size - Type Segment 2020 - 2024 ($ million)

5.3 End-user segment analysis 2020 - 2024

Historic Market Size - End-user Segment 2020 - 2024 ($ million)

5.4 Product Type segment analysis 2020 - 2024

Historic Market Size - Product Type Segment 2020 - 2024 ($ million)

5.5 Geography segment analysis 2020 - 2024

Historic Market Size - Geography Segment 2020 - 2024 ($ million)

5.6 Country segment analysis 2020 - 2024

Historic Market Size - Country Segment 2020 - 2024 ($ million)

6. Qualitative Analysis

6.1 Impact of AI on Global Renewable Energy Investment Market

6.2 Impact of geopolitical conflicts on Global Renewable Energy Investment Market

7. Five Forces Analysis

7.1 Five forces summary

Five forces analysis - Comparison between 2025 and 2030

7.2 Bargaining power of buyers

Bargaining power of buyers - Impact of key factors 2025 and 2030

7.3 Bargaining power of suppliers

Bargaining power of suppliers - Impact of key factors in 2025 and 2030

7.4 Threat of new entrants

Threat of new entrants - Impact of key factors in 2025 and 2030

7.5 Threat of substitutes

Threat of substitutes - Impact of key factors in 2025 and 2030

7.6 Threat of rivalry

Threat of rivalry - Impact of key factors in 2025 and 2030

7.7 Market condition

Chart on Market condition - Five forces 2025 and 2030

8. Market Segmentation by Type

8.1 Market segments

Chart on Type - Market share 2025-2030 (%)
Data Table on Type - Market share 2025-2030 (%)

8.2 Comparison by Type

Chart on Comparison by Type
Data Table on Comparison by Type

8.3 Asset finance - Market size and forecast 2025-2030

Chart on Asset finance - Market size and forecast 2025-2030 ($ million)
Data Table on Asset finance - Market size and forecast 2025-2030 ($ million)
Chart on Asset finance - Year-over-year growth 2025-2030 (%)
Data Table on Asset finance - Year-over-year growth 2025-2030 (%)

8.4 Small distributed capacity - Market size and forecast 2025-2030

Chart on Small distributed capacity - Market size and forecast 2025-2030 ($ million)
Data Table on Small distributed capacity - Market size and forecast 2025-2030 ($ million)
Chart on Small distributed capacity - Year-over-year growth 2025-2030 (%)
Data Table on Small distributed capacity - Year-over-year growth 2025-2030 (%)

8.5 Market opportunity by Type

Market opportunity by Type ($ million)
Data Table on Market opportunity by Type ($ million)

9. Market Segmentation by End-user

9.1 Market segments

Chart on End-user - Market share 2025-2030 (%)
Data Table on End-user - Market share 2025-2030 (%)

9.2 Comparison by End-user

Chart on Comparison by End-user
Data Table on Comparison by End-user

9.3 Utility - Market size and forecast 2025-2030

Chart on Utility - Market size and forecast 2025-2030 ($ million)
Data Table on Utility - Market size and forecast 2025-2030 ($ million)
Chart on Utility - Year-over-year growth 2025-2030 (%)
Data Table on Utility - Year-over-year growth 2025-2030 (%)

9.4 Commercial - Market size and forecast 2025-2030

Chart on Commercial - Market size and forecast 2025-2030 ($ million)
Data Table on Commercial - Market size and forecast 2025-2030 ($ million)
Chart on Commercial - Year-over-year growth 2025-2030 (%)
Data Table on Commercial - Year-over-year growth 2025-2030 (%)

9.5 Industrial - Market size and forecast 2025-2030

Chart on Industrial - Market size and forecast 2025-2030 ($ million)
Data Table on Industrial - Market size and forecast 2025-2030 ($ million)
Chart on Industrial - Year-over-year growth 2025-2030 (%)
Data Table on Industrial - Year-over-year growth 2025-2030 (%)

9.6 Residential - Market size and forecast 2025-2030

Chart on Residential - Market size and forecast 2025-2030 ($ million)
Data Table on Residential - Market size and forecast 2025-2030 ($ million)
Chart on Residential - Year-over-year growth 2025-2030 (%)
Data Table on Residential - Year-over-year growth 2025-2030 (%)

9.7 Market opportunity by End-user

Market opportunity by End-user ($ million)
Data Table on Market opportunity by End-user ($ million)

10. Market Segmentation by Product Type

10.1 Market segments

Chart on Product Type - Market share 2025-2030 (%)
Data Table on Product Type - Market share 2025-2030 (%)

10.2 Comparison by Product Type

Chart on Comparison by Product Type
Data Table on Comparison by Product Type

10.3 Equity - Market size and forecast 2025-2030

Chart on Equity - Market size and forecast 2025-2030 ($ million)
Data Table on Equity - Market size and forecast 2025-2030 ($ million)
Chart on Equity - Year-over-year growth 2025-2030 (%)
Data Table on Equity - Year-over-year growth 2025-2030 (%)

10.4 Debt - Market size and forecast 2025-2030

Chart on Debt - Market size and forecast 2025-2030 ($ million)
Data Table on Debt - Market size and forecast 2025-2030 ($ million)
Chart on Debt - Year-over-year growth 2025-2030 (%)
Data Table on Debt - Year-over-year growth 2025-2030 (%)

10.5 Others - Market size and forecast 2025-2030

Chart on Others - Market size and forecast 2025-2030 ($ million)
Data Table on Others - Market size and forecast 2025-2030 ($ million)
Chart on Others - Year-over-year growth 2025-2030 (%)
Data Table on Others - Year-over-year growth 2025-2030 (%)

10.6 Market opportunity by Product Type

Market opportunity by Product Type ($ million)
Data Table on Market opportunity by Product Type ($ million)

11. Customer Landscape

11.1 Customer landscape overview

Analysis of price sensitivity, lifecycle, customer purchase basket, adoption rates, and purchase criteria

12. Geographic Landscape

12.1 Geographic segmentation

Chart on Market share by geography 2025-2030 (%)
Data Table on Market share by geography 2025-2030 (%)

12.2 Geographic comparison

Chart on Geographic comparison
Data Table on Geographic comparison

12.3 APAC - Market size and forecast 2025-2030

Chart on APAC - Market size and forecast 2025-2030 ($ million)
Data Table on APAC - Market size and forecast 2025-2030 ($ million)
Chart on APAC - Year-over-year growth 2025-2030 (%)
Data Table on APAC - Year-over-year growth 2025-2030 (%)
Chart on Regional Comparison - APAC
Data Table on Regional Comparison - APAC

12.3.1 China - Market size and forecast 2025-2030

Chart on China - Market size and forecast 2025-2030 ($ million)
Data Table on China - Market size and forecast 2025-2030 ($ million)
Chart on China - Year-over-year growth 2025-2030 (%)
Data Table on China - Year-over-year growth 2025-2030 (%)

12.3.2 India - Market size and forecast 2025-2030

Chart on India - Market size and forecast 2025-2030 ($ million)
Data Table on India - Market size and forecast 2025-2030 ($ million)
Chart on India - Year-over-year growth 2025-2030 (%)
Data Table on India - Year-over-year growth 2025-2030 (%)

12.3.3 Japan - Market size and forecast 2025-2030

Chart on Japan - Market size and forecast 2025-2030 ($ million)
Data Table on Japan - Market size and forecast 2025-2030 ($ million)
Chart on Japan - Year-over-year growth 2025-2030 (%)
Data Table on Japan - Year-over-year growth 2025-2030 (%)

12.3.4 Australia - Market size and forecast 2025-2030

Chart on Australia - Market size and forecast 2025-2030 ($ million)
Data Table on Australia - Market size and forecast 2025-2030 ($ million)
Chart on Australia - Year-over-year growth 2025-2030 (%)
Data Table on Australia - Year-over-year growth 2025-2030 (%)

12.3.5 South Korea - Market size and forecast 2025-2030

Chart on South Korea - Market size and forecast 2025-2030 ($ million)
Data Table on South Korea - Market size and forecast 2025-2030 ($ million)
Chart on South Korea - Year-over-year growth 2025-2030 (%)
Data Table on South Korea - Year-over-year growth 2025-2030 (%)

12.3.6 Indonesia - Market size and forecast 2025-2030

Chart on Indonesia - Market size and forecast 2025-2030 ($ million)
Data Table on Indonesia - Market size and forecast 2025-2030 ($ million)
Chart on Indonesia - Year-over-year growth 2025-2030 (%)
Data Table on Indonesia - Year-over-year growth 2025-2030 (%)

12.4 North America - Market size and forecast 2025-2030

Chart on North America - Market size and forecast 2025-2030 ($ million)
Data Table on North America - Market size and forecast 2025-2030 ($ million)
Chart on North America - Year-over-year growth 2025-2030 (%)
Data Table on North America - Year-over-year growth 2025-2030 (%)
Chart on Regional Comparison - North America
Data Table on Regional Comparison - North America

12.4.1 US - Market size and forecast 2025-2030

Chart on US - Market size and forecast 2025-2030 ($ million)
Data Table on US - Market size and forecast 2025-2030 ($ million)
Chart on US - Year-over-year growth 2025-2030 (%)
Data Table on US - Year-over-year growth 2025-2030 (%)

12.4.2 Canada - Market size and forecast 2025-2030

Chart on Canada - Market size and forecast 2025-2030 ($ million)
Data Table on Canada - Market size and forecast 2025-2030 ($ million)
Chart on Canada - Year-over-year growth 2025-2030 (%)
Data Table on Canada - Year-over-year growth 2025-2030 (%)

12.4.3 Mexico - Market size and forecast 2025-2030

Chart on Mexico - Market size and forecast 2025-2030 ($ million)
Data Table on Mexico - Market size and forecast 2025-2030 ($ million)
Chart on Mexico - Year-over-year growth 2025-2030 (%)
Data Table on Mexico - Year-over-year growth 2025-2030 (%)

12.5 Europe - Market size and forecast 2025-2030

Chart on Europe - Market size and forecast 2025-2030 ($ million)
Data Table on Europe - Market size and forecast 2025-2030 ($ million)
Chart on Europe - Year-over-year growth 2025-2030 (%)
Data Table on Europe - Year-over-year growth 2025-2030 (%)
Chart on Regional Comparison - Europe
Data Table on Regional Comparison - Europe

12.5.1 Germany - Market size and forecast 2025-2030

Chart on Germany - Market size and forecast 2025-2030 ($ million)
Data Table on Germany - Market size and forecast 2025-2030 ($ million)
Chart on Germany - Year-over-year growth 2025-2030 (%)
Data Table on Germany - Year-over-year growth 2025-2030 (%)

12.5.2 UK - Market size and forecast 2025-2030

Chart on UK - Market size and forecast 2025-2030 ($ million)
Data Table on UK - Market size and forecast 2025-2030 ($ million)
Chart on UK - Year-over-year growth 2025-2030 (%)
Data Table on UK - Year-over-year growth 2025-2030 (%)

12.5.3 France - Market size and forecast 2025-2030

Chart on France - Market size and forecast 2025-2030 ($ million)
Data Table on France - Market size and forecast 2025-2030 ($ million)
Chart on France - Year-over-year growth 2025-2030 (%)
Data Table on France - Year-over-year growth 2025-2030 (%)

12.5.4 Italy - Market size and forecast 2025-2030

Chart on Italy - Market size and forecast 2025-2030 ($ million)
Data Table on Italy - Market size and forecast 2025-2030 ($ million)
Chart on Italy - Year-over-year growth 2025-2030 (%)
Data Table on Italy - Year-over-year growth 2025-2030 (%)

12.5.5 Spain - Market size and forecast 2025-2030

Chart on Spain - Market size and forecast 2025-2030 ($ million)
Data Table on Spain - Market size and forecast 2025-2030 ($ million)
Chart on Spain - Year-over-year growth 2025-2030 (%)
Data Table on Spain - Year-over-year growth 2025-2030 (%)

12.5.6 The Netherlands - Market size and forecast 2025-2030

Chart on The Netherlands - Market size and forecast 2025-2030 ($ million)
Data Table on The Netherlands - Market size and forecast 2025-2030 ($ million)
Chart on The Netherlands - Year-over-year growth 2025-2030 (%)
Data Table on The Netherlands - Year-over-year growth 2025-2030 (%)

12.6 South America - Market size and forecast 2025-2030

Chart on South America - Market size and forecast 2025-2030 ($ million)
Data Table on South America - Market size and forecast 2025-2030 ($ million)
Chart on South America - Year-over-year growth 2025-2030 (%)
Data Table on South America - Year-over-year growth 2025-2030 (%)
Chart on Regional Comparison - South America
Data Table on Regional Comparison - South America

12.6.1 Brazil - Market size and forecast 2025-2030

Chart on Brazil - Market size and forecast 2025-2030 ($ million)
Data Table on Brazil - Market size and forecast 2025-2030 ($ million)
Chart on Brazil - Year-over-year growth 2025-2030 (%)
Data Table on Brazil - Year-over-year growth 2025-2030 (%)

12.6.2 Chile - Market size and forecast 2025-2030

Chart on Chile - Market size and forecast 2025-2030 ($ million)
Data Table on Chile - Market size and forecast 2025-2030 ($ million)
Chart on Chile - Year-over-year growth 2025-2030 (%)
Data Table on Chile - Year-over-year growth 2025-2030 (%)

12.6.3 Argentina - Market size and forecast 2025-2030

Chart on Argentina - Market size and forecast 2025-2030 ($ million)
Data Table on Argentina - Market size and forecast 2025-2030 ($ million)
Chart on Argentina - Year-over-year growth 2025-2030 (%)
Data Table on Argentina - Year-over-year growth 2025-2030 (%)

12.7 Middle East and Africa - Market size and forecast 2025-2030

Chart on Middle East and Africa - Market size and forecast 2025-2030 ($ million)
Data Table on Middle East and Africa - Market size and forecast 2025-2030 ($ million)
Chart on Middle East and Africa - Year-over-year growth 2025-2030 (%)
Data Table on Middle East and Africa - Year-over-year growth 2025-2030 (%)
Chart on Regional Comparison - Middle East and Africa
Data Table on Regional Comparison - Middle East and Africa

12.7.1 Saudi Arabia - Market size and forecast 2025-2030

Chart on Saudi Arabia - Market size and forecast 2025-2030 ($ million)
Data Table on Saudi Arabia - Market size and forecast 2025-2030 ($ million)
Chart on Saudi Arabia - Year-over-year growth 2025-2030 (%)
Data Table on Saudi Arabia - Year-over-year growth 2025-2030 (%)

12.7.2 UAE - Market size and forecast 2025-2030

Chart on UAE - Market size and forecast 2025-2030 ($ million)
Data Table on UAE - Market size and forecast 2025-2030 ($ million)
Chart on UAE - Year-over-year growth 2025-2030 (%)
Data Table on UAE - Year-over-year growth 2025-2030 (%)

12.7.3 South Africa - Market size and forecast 2025-2030

Chart on South Africa - Market size and forecast 2025-2030 ($ million)
Data Table on South Africa - Market size and forecast 2025-2030 ($ million)
Chart on South Africa - Year-over-year growth 2025-2030 (%)
Data Table on South Africa - Year-over-year growth 2025-2030 (%)

12.7.4 Turkey - Market size and forecast 2025-2030

Chart on Turkey - Market size and forecast 2025-2030 ($ million)
Data Table on Turkey - Market size and forecast 2025-2030 ($ million)
Chart on Turkey - Year-over-year growth 2025-2030 (%)
Data Table on Turkey - Year-over-year growth 2025-2030 (%)

12.7.5 Israel - Market size and forecast 2025-2030

Chart on Israel - Market size and forecast 2025-2030 ($ million)
Data Table on Israel - Market size and forecast 2025-2030 ($ million)
Chart on Israel - Year-over-year growth 2025-2030 (%)
Data Table on Israel - Year-over-year growth 2025-2030 (%)

12.8 Market opportunity by geography

Market opportunity by geography ($ million)
Data Tables on Market opportunity by geography ($ million)

13. Drivers, Challenges, and Opportunity

13.1 Market drivers

Decarbonization policy frameworks
Geopolitical energy security concerns drive investment
Technological advancements enhance overall project viability

13.2 Market challenges

Grid infrastructure constraints and interconnection delays
High financing costs and capital risks
Regulatory policy uncertainty and trade barriers

13.3 Impact of drivers and challenges

Impact of drivers and challenges in 2025 and 2030

13.4 Market opportunities

AI integration optimizing power yields
Distributed energy infrastructure expanding localized resilience
Green debt issuances financing sustainable investments

14. Competitive Landscape

14.1 Overview

14.2

Overview on criticality of inputs and factors of differentiation

14.3 Landscape disruption

Overview on factors of disruption

14.4 Industry risks

Impact of key risks on business

15. Competitive Analysis

15.1 Companies profiled

Companies covered

15.2 Company ranking index

15.3 Market positioning of companies

Matrix on companies position and classification

15.4 Actis

Actis - Overview
Actis - Product / Service
Actis - Key offerings
SWOT

15.5 Antin Infrastructure Partners

Antin Infrastructure Partners - Overview
Antin Infrastructure Partners - Product / Service
Antin Infrastructure Partners - Key offerings
SWOT

15.6 Asper Investment Management

Asper Investment Management - Overview
Asper Investment Management - Product / Service
Asper Investment Management - Key offerings
SWOT

15.7 Brookfield Renewable Partners LP

Brookfield Renewable Partners LP - Overview
Brookfield Renewable Partners LP - Product / Service
Brookfield Renewable Partners LP - Key offerings
SWOT

15.8 Capital Dynamics Holding AG

Capital Dynamics Holding AG - Overview
Capital Dynamics Holding AG - Product / Service
Capital Dynamics Holding AG - Key offerings
SWOT

15.9 Cubico Sustainable Investments

Cubico Sustainable Investments - Overview
Cubico Sustainable Investments - Product / Service
Cubico Sustainable Investments - Key offerings
SWOT

15.10 Denham Capital

Denham Capital - Overview
Denham Capital - Product / Service
Denham Capital - Key offerings
SWOT

15.11 EIG Partners

EIG Partners - Overview
EIG Partners - Product / Service
EIG Partners - Key offerings
SWOT

15.12 Global Infrastructure Partners

Global Infrastructure Partners - Overview
Global Infrastructure Partners - Product / Service
Global Infrastructure Partners - Key offerings
SWOT

15.13 I Squared Capital

I Squared Capital - Overview
I Squared Capital - Product / Service
I Squared Capital - Key offerings
SWOT

15.14 Meridiam SAS

Meridiam SAS - Overview
Meridiam SAS - Product / Service
Meridiam SAS - Key offerings
SWOT

15.15 Nextera Energy Inc.

Nextera Energy Inc. - Overview
Nextera Energy Inc. - Business segments
Nextera Energy Inc. - Key offerings
Nextera Energy Inc. - Segment focus
SWOT

15.16 Octopus Energy Generation

Octopus Energy Generation - Overview
Octopus Energy Generation - Product / Service
Octopus Energy Generation - Key offerings
SWOT

15.17 Omnes Capital

Omnes Capital - Overview
Omnes Capital - Product / Service
Omnes Capital - Key offerings
SWOT

15.18 Stonepeak

Stonepeak - Overview
Stonepeak - Product / Service
Stonepeak - Key offerings
SWOT

16. Appendix

16.1 Scope of the report

Market definition
Objectives
Notes and caveats

16.2 Inclusions and exclusions checklist

Inclusions checklist
Exclusions checklist

16.3 Currency conversion rates for US$

16.4 Research methodology

16.5 Data procurement

Information sources

16.6 Data validation

16.7 Validation techniques employed for market sizing

16.8 Data synthesis

16.9 360 degree market analysis

16.10 List of abbreviations

Research Methodology

Technavio presents a detailed picture of the market by way of study, synthesis, and summation of data from multiple sources. The analysts have presented the various facets of the market with a particular focus on identifying the key industry influencers. The data thus presented is comprehensive, reliable, and the result of extensive research, both primary and secondary.

INFORMATION SOURCES

Primary sources

  • Manufacturers and suppliers
  • Channel partners
  • Industry experts
  • Strategic decision makers

Secondary sources

  • Industry journals and periodicals
  • Government data
  • Financial reports of key industry players
  • Historical data
  • Press releases

DATA ANALYSIS

Data Synthesis

  • Collation of data
  • Estimation of key figures
  • Analysis of derived insights

Data Validation

  • Triangulation with data models
  • Reference against proprietary databases
  • Corroboration with industry experts

REPORT WRITING

Qualitative

  • Market drivers
  • Market challenges
  • Market trends
  • Five forces analysis

Quantitative

  • Market size and forecast
  • Market segmentation
  • Geographical insights
  • Competitive landscape

Interested in this report?

Get your sample now to see our research methodology and insights!

Download Now

Frequently Asked Questions

Renewable Energy Investment market growth will increase by USD 231655.4 million during 2026-2030.

The Renewable Energy Investment market is expected to grow at a CAGR of 8.8% during 2026-2030.

Renewable Energy Investment market is segmented by Type (Asset finance, Small distributed capacity) End-user (Utility, Commercial, Industrial, Residential) Product type (Equity, Debt, Others)

Actis, Antin Infrastructure Partners, Arevon Energy Inc., Asper Investment Management, Brookfield Renewable Partners LP, Capital Dynamics Holding AG, Cubico Sustainable Investments, Denham Capital, EIG Partners, Energy Impact Partners, Generate Capital, Glennmont Partners, Global Infrastructure Partners, Gore Street Capital, HASI, I Squared Capital, Meridiam SAS, Nextera Energy Inc., Octopus Energy Generation, Omnes Capital, Quinbrook Infrastructure Partners, Schroders Greencoat, Sonnedix, Stonepeak are a few of the key vendors in the Renewable Energy Investment market.

APAC will register the highest growth rate of 61.8% among the other regions. Therefore, the Renewable Energy Investment market in APAC is expected to garner significant business opportunities for the vendors during the forecast period.

China, India, Japan, Australia, South Korea, Indonesia, US, Canada, Mexico, Germany, UK, France, Italy, Spain, The Netherlands, Brazil, Chile, Argentina, Saudi Arabia, UAE, South Africa, Turkey, Israel

  • Decarbonization policy frameworks is the driving factor this market.

The Renewable Energy Investment market vendors should focus on grabbing business opportunities from the Type segment as it accounted for the largest market share in the base year.
RIA - Research AI Assistant
Ask RIA
