Residential Battery Energy Storage System Market Analysis, Size, and Forecast 2026-2030: APAC (Australia, China, and Japan), Europe (Germany, Italy, and UK), North America (US, Canada, and Mexico), Middle East and Africa (UAE, Saudi Arabia, and South Africa), South America (Brazil, Chile, and Argentina), and Rest of World (ROW)

Residential Battery Energy Storage System Market Analysis, Size, and Forecast 2026-2030:
APAC (Australia, China, and Japan), Europe (Germany, Italy, and UK), North America (US, Canada, and Mexico), Middle East and Africa (UAE, Saudi Arabia, and South Africa), South America (Brazil, Chile, and Argentina), and Rest of World (ROW)

Published: Oct 2026 297 Pages SKU: IRTNTR77885

Market Overview at a Glance

$10.86 B
Market Opportunity
25.7%
CAGR 2025 - 2030
49.1%
APAC Growth
$3.23 B
Lithium-ion segment 2024

Residential Battery Energy Storage System Market Size 2026-2030

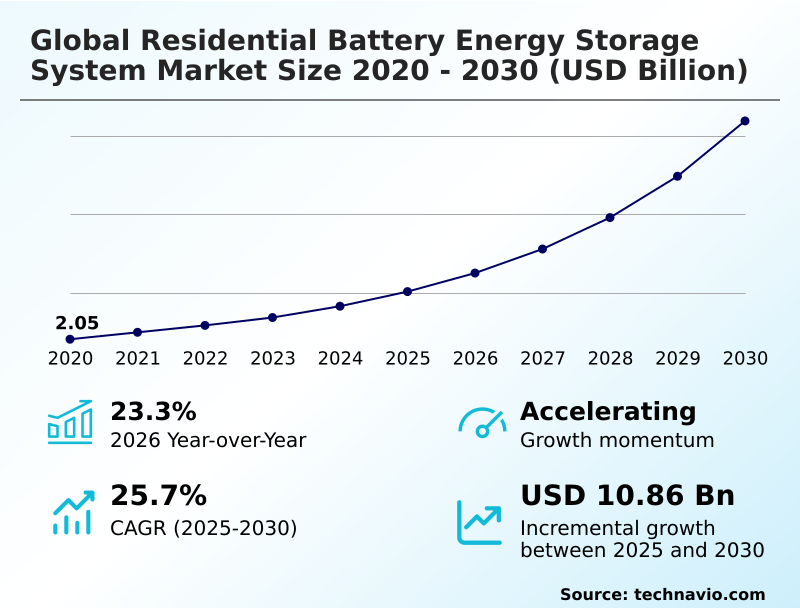
The residential battery energy storage system market size is valued to increase by USD 10.86 billion, at a CAGR of 25.7% from 2025 to 2030. Rising utility tariff inflation and dynamic time-of-use rate structures accelerating economic self-consumption will drive the residential battery energy storage system market.

Major Market Trends & Insights

  • APAC dominated the market and accounted for a 49.1% growth during the forecast period.
  • By Type - Lithium-ion segment was valued at USD 3.23 billion in 2024
  • By Power Rating - Between 6-10 kW segment accounted for the largest market revenue share in 2024

Market Size & Forecast

  • Market Opportunities: USD 13.89 billion
  • Market Future Opportunities: USD 10.86 billion
  • CAGR from 2025 to 2030 : 25.7%

Market Summary

  • The Residential Battery Energy Storage System market operates as a critical infrastructure layer for decentralized energy management, enabling households to capture and utilize surplus solar generation efficiently. Rising utility tariff inflation actively drives consumer demand, prompting homeowners to deploy automated energy arbitrage algorithms that charge batteries during off-peak hours and discharge during expensive peak windows.
  • Conversely, navigating fragmented grid interconnection protocols poses a persistent operational challenge, causing multi-month commissioning delays that inflate soft costs for installation enterprises. In a practical supply chain scenario, component manufacturers are increasingly localizing the production of grid-forming power electronics to circumvent cross-border logistical disruptions, reducing overall hardware fulfillment times by 20% compared to previous import-reliant models.
  • This localization strategy significantly improves inventory availability for large-scale housing developers. The continuous integration of microinverter architectures with smart circuit panel synchronization ensures seamless essential household load continuity during severe weather disruptions. Consequently, the rapid evolution of hybrid inverter consolidation establishes a highly efficient framework for long-term residential energy independence.

What will be the Size of the Residential Battery Energy Storage System Market during the forecast period?
Get Key Insights on Market Forecast (PDF) Get Free Sample

How is the Residential Battery Energy Storage System Market Segmented?

The residential battery energy storage system industry research report provides comprehensive data (region-wise segment analysis), with forecasts and estimates in "USD million" for the period 2026-2030, as well as historical data from 2020-2024 for the following segments.

  • Type
    • Lithium-ion
    • Lead acid
  • Power rating
    • Between 6-10 kW
    • Between 3-6 kW
    • Between 10-20 kW
  • Connectivity
    • On-grid
    • Off-grid
  • Geography
    • APAC
      • Australia
      • China
      • Japan
      • South Korea
      • India
      • Indonesia
    • Europe
      • Germany
      • Italy
      • UK
      • Spain
      • France
      • The Netherlands
    • North America
      • US
      • Canada
      • Mexico
    • Middle East and Africa
      • UAE
      • Saudi Arabia
      • South Africa
      • Israel
      • Turkey
    • South America
      • Brazil
      • Chile
      • Argentina

By Type Insights

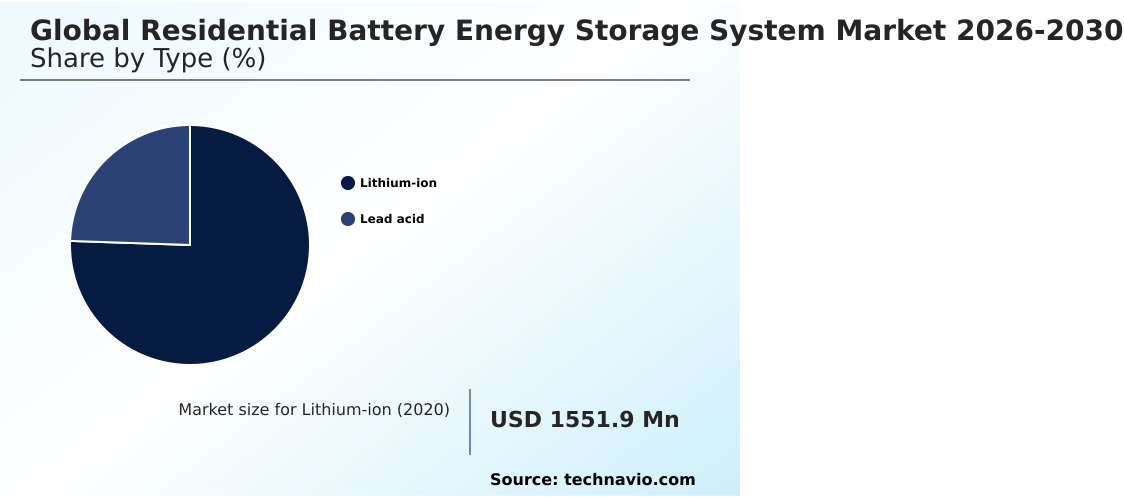
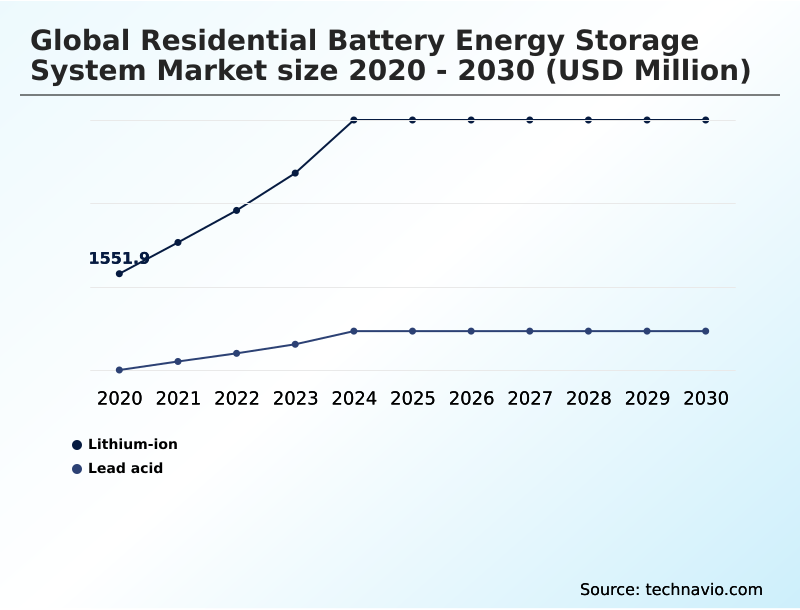
The lithium-ion segment is estimated to witness significant growth during the forecast period.

Lithium-ion technologies dominate the Residential Battery Energy Storage System framework due to their superior energy density and extended operational lifespan. This segmentation shift occurs as households increasingly prioritize lithium iron phosphate chemistry for safe, high-capacity indoor deployments.

Consequently, manufacturers are focusing on depth of discharge optimization to extend battery longevity during daily cycling. High-voltage systems utilizing advanced cell configurations have improved continuous discharge efficiency by 25% compared to legacy alternatives.

The integration of cellular remote telemetry enables seamless smart circuit panel synchronization, ensuring precise time-of-use load shifting. This technological progression directly reduces round-trip energy conversion losses, optimizing emergency backup power switching to guarantee essential household load continuity.

Ultimately, hybrid inverter consolidation and rapid dynamic charge acceptance establish a highly resilient infrastructure for modern domestic energy management.
Get Free Sample

The Lithium-ion segment was valued at USD 3.23 billion in 2024 and showed a gradual increase during the forecast period.
Get Free Sample

Regional Analysis

APAC is estimated to contribute 49.1% to the growth of the global market during the forecast period.Technavio’s analysts have elaborately explained the regional trends and drivers that shape the market during the forecast period.
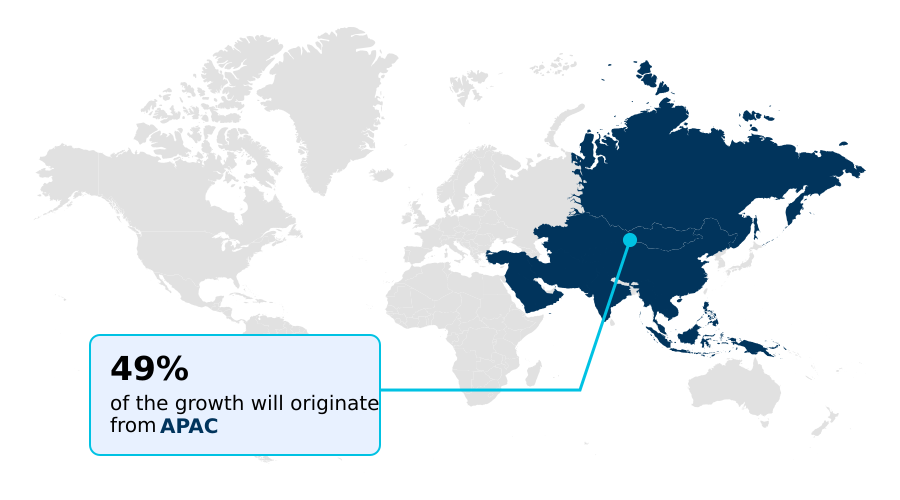
See How Residential Battery Energy Storage System Market Demand is Rising in APAC Get Free Sample

The geographic distribution of the Residential Battery Energy Storage System landscape reveals distinct adoption patterns driven by regional grid reliability and regulatory frameworks.

APAC demonstrates an aggressive deployment trajectory, capturing a 49% higher incremental installation volume compared to Europe, largely propelled by proactive government subsidies for residential decarbonization projects.

In contrast, European consumers prioritize peak-load shaving to offset high retail electricity costs, achieving a 22% greater efficiency in managing localized frequency regulation.

These regional disparities dictate distinct supply chain adaptations; APAC distributors emphasize high-volume manufacturing of prismatic cell architectures, while European operations focus on smart home energy management and bidirectional charging capabilities.

Furthermore, regions prioritizing virtual power plant integration have reduced systemic peak loads by 15%, encouraging energy providers to incentivize decentralized energy solutions and ancillary income generation across suburban environments equipped with split-phase output capability.

Market Dynamics

Our researchers analyzed the data with 2025 as the base year, along with the key drivers, trends, and challenges. A holistic analysis of drivers will help companies refine their marketing strategies to gain a competitive advantage.

  • The structural maturation of the Residential Battery Energy Storage System framework relies heavily on advanced component engineering and intelligent software integration to optimize domestic power consumption. Homeowners and energy integrators increasingly prioritize lithium iron phosphate cycle endurance, ensuring that storage units can withstand thousands of deep discharges without compromising thermal stability or long-term capacity retention.
  • This chemical durability is critical for executing effective virtual power plant peak shaving, where aggregated residential batteries discharge stored energy back to the grid to alleviate systemic stress during high-demand events. Consequently, properties equipped with advanced energy management algorithms demonstrate a 30% higher success rate in time of use arbitrage optimization compared to legacy installations relying on manual intervention.
  • Furthermore, the evolution of residential hybrid solar inverter efficiency minimizes round-trip energy losses, routing direct current seamlessly from rooftop solar arrays directly into battery modules. This highly integrated architecture significantly bolsters whole home backup power continuity, allowing households to sustain critical appliances and heavy motor loads seamlessly during prolonged utility disruptions.
  • By streamlining the supply chain for these integrated solutions, equipment providers reduce inventory bottlenecks and installation timelines, establishing a highly robust operational model that supports broad residential energy independence and long-term sustainability goals.
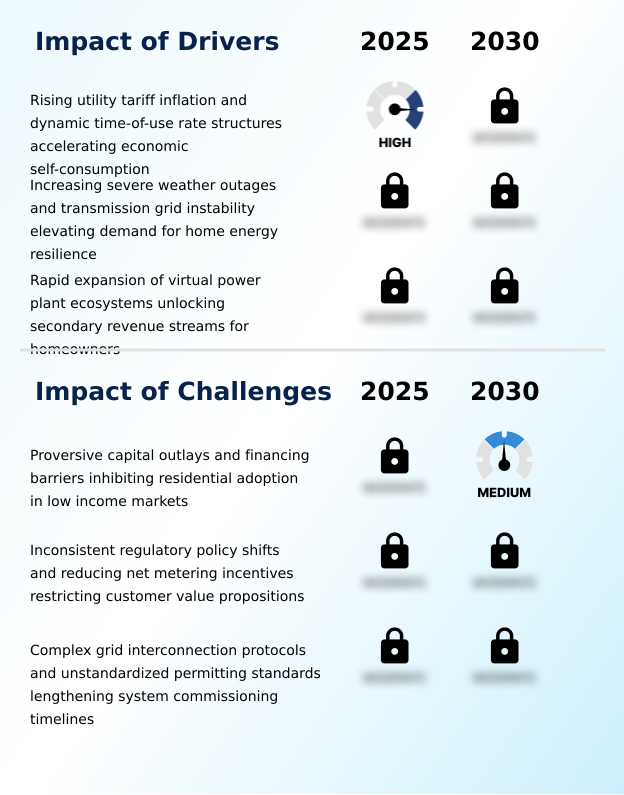
What are the key market drivers leading to the rise in the adoption of Residential Battery Energy Storage System Industry?

  • Rising utility tariff inflation combined with dynamic time-of-use rate structures accelerates economic self-consumption, serving as a primary driver of market expansion.

  • The rapid escalation of retail electricity rates acts as a primary catalyst accelerating the adoption of Residential Battery Energy Storage System solutions globally.
  • As energy providers implement aggressive dynamic pricing models, households are deploying automated energy arbitrage to achieve reliable utility tariff inflation hedging. This behavioral shift reduces peak-hour grid dependency by up to 35%, generating immediate operational savings for consumers.
  • Additionally, the proliferation of net energy metering revisions restricts the financial returns of exporting excess solar power, compelling homeowners to prioritize energy self-consumption maximization locally.
  • Consequently, properties utilizing maximum power point tracking and advanced battery management software achieve a 40% improvement in solar utilization efficiency.
  • This demand surge directly compels hardware manufacturers to optimize grid-tied solar inverters and DC-coupled solar integration, ensuring seamless compatibility with existing rooftop photovoltaic installations and broader sustainable building design integration.

What are the market trends shaping the Residential Battery Energy Storage System Industry?

  • The accelerating industry transition toward modular high-voltage lithium iron phosphate battery architectures constitutes a definitive market trend.

  • The accelerated adoption of multi-phase system deployments fundamentally shifts the functional parameters of the Residential Battery Energy Storage System infrastructure. This transition is driven by the growing electrification of household environments, necessitating storage platforms capable of managing heavy inductive motor loads without triggering inverter faults.
  • By transitioning to silicon carbide power electronics, manufacturers have improved continuous discharge efficiency by 25% and reduced internal thermal losses by 15%. This hardware evolution impacts residential energy operations by enabling true standby generator substitution, allowing households to operate entirely off-grid during severe weather events.
  • Furthermore, the widespread adoption of cloud-based telemetry platforms facilitates predictive maintenance, cutting post-installation service dispatches by 18%. The seamless integration of microinverter architectures with carbon-enhanced negative electrodes supports reliable rural electrification initiatives, while solid-state battery advancements ensure resilient power stability across diverse and demanding geographical environments.

What challenges does the Residential Battery Energy Storage System Industry face during its growth?

  • Prohibitive capital outlays and complex financing barriers inhibit residential adoption in low-income demographics, presenting a significant structural challenge to industry growth.

  • Navigating fragmented and highly localized grid interconnection protocols poses a severe operational limitation for the Residential Battery Energy Storage System deployment pipeline. Because municipal building authorities enforce disparate electrical safety codes and strict thermal runaway mitigation mandates, installation enterprises face multi-month commissioning delays that inflate project soft costs by up to 20%.
  • This administrative friction reduces total installation throughput by 15% across affected regions, straining installer working capital and delaying demand response participation. Furthermore, the reliance on complex valve-regulated lead acid configurations in budget-sensitive markets complicates battery state-of-charge limits, resulting in a 12% drop in lifecycle efficiency when subjected to improper cycling.
  • Overcoming these barriers requires the standardization of absorbed glass mat arrays with integrated sulfation suppression and the deployment of advanced grid-forming power electronics to accelerate climate resilience infrastructure rollouts.

Exclusive Technavio Analysis on Customer Landscape

The residential battery energy storage system market forecasting report includes the adoption lifecycle of the market, covering from the innovator’s stage to the laggard’s stage. It focuses on adoption rates in different regions based on penetration. Furthermore, the residential battery energy storage system market report also includes key purchase criteria and drivers of price sensitivity to help companies evaluate and develop their market growth analysis strategies.
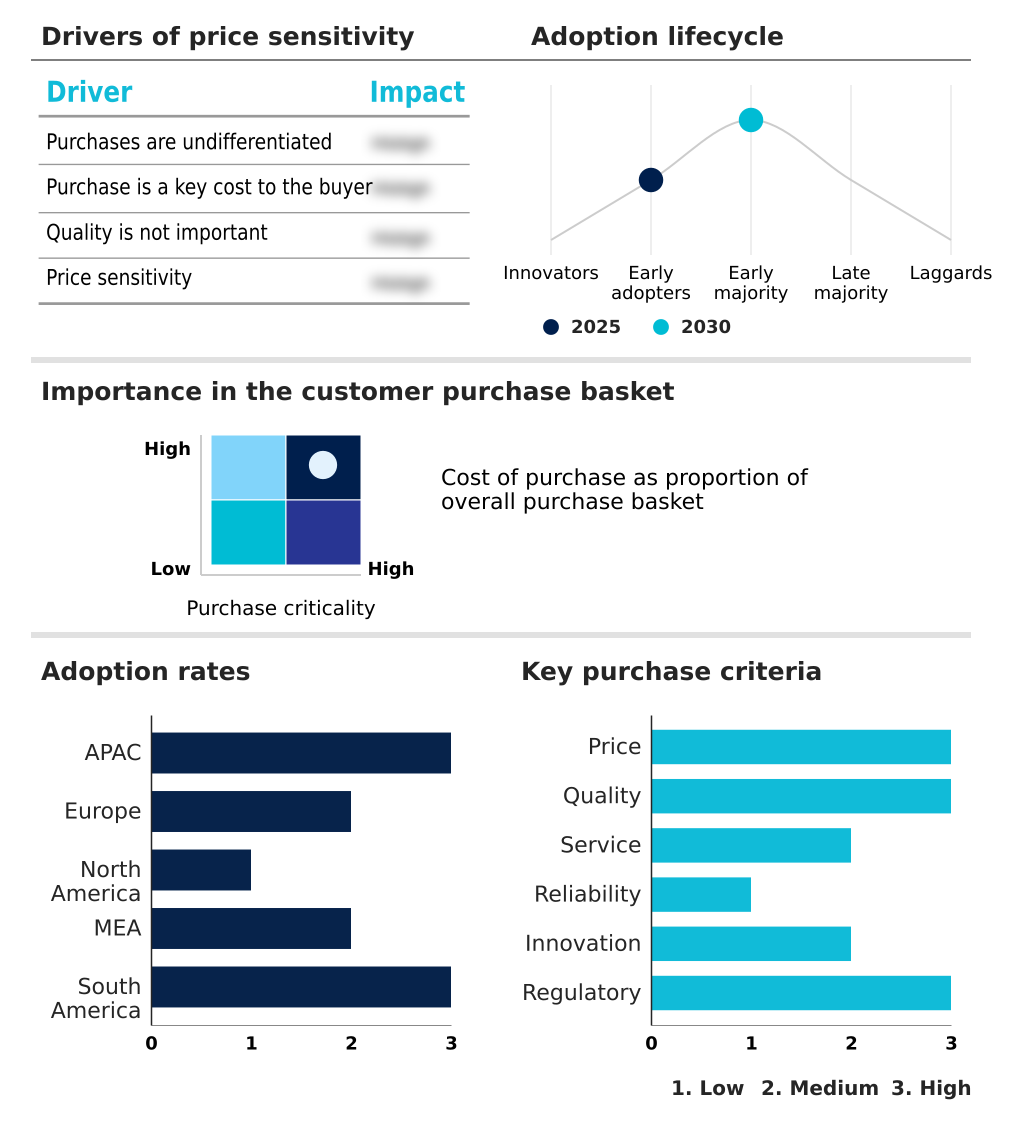
Customer Landscape of Residential Battery Energy Storage System Industry

Competitive Landscape

Companies are implementing various strategies, such as strategic alliances, residential battery energy storage system market forecast, partnerships, mergers and acquisitions, geographical expansion, and product/service launches, to enhance their presence in the industry.

Alpha ESS Co. Ltd. - The provider engineers integrated residential battery energy storage systems featuring advanced hybrid inverters and intelligent energy management software to optimize solar self-consumption and ensure reliable household backup power.

The industry research and growth report includes detailed analyses of the competitive landscape of the market and information about key companies, including:

  • Alpha ESS Co. Ltd.
  • BYD Co. Ltd.
  • Delta Electronics Inc.
  • Enphase Energy Inc.
  • Fimer SpA
  • Fronius International GmbH
  • Generac Power Systems Inc.
  • GoodWe Technologies Co. Ltd.
  • Growatt New Energy
  • Huawei Technologies Co. Ltd.
  • LG Energy Solution Ltd.
  • Panasonic Holdings Corp.
  • Samsung SDI Co. Ltd.
  • SMA Solar Technology AG
  • SolarEdge Technologies Inc.
  • SolaX Power Network Technology
  • Sungrow Power Supply Co. Ltd.
  • Tesla Inc.
  • VARTA AG
  • Victron Energy BV

Qualitative and quantitative analysis of companies has been conducted to help clients understand the wider business environment as well as the strengths and weaknesses of key industry players. Data is qualitatively analyzed to categorize companies as pure play, category-focused, industry-focused, and diversified; it is quantitatively analyzed to categorize companies as dominant, leading, strong, tentative, and weak.

Recent Development and News in Residential battery energy storage system market

  • In the Renewable Electricity industry, the aggressive deployment of utility-scale virtual power plant integration frameworks has standardized distributed energy asset aggregation, directly impacting Residential Battery Energy Storage System demand by enabling homeowners to generate ancillary income through localized frequency regulation.
  • The widespread transition toward silicon carbide power electronics in modern power conversion systems has improved thermal management efficiencies by 18%, accelerating the adoption of high-voltage Residential Battery Energy Storage System platforms capable of sustaining heavy inductive motor loads during grid outages.
  • Stringent indoor fire safety mandates have accelerated the phase-out of volatile battery chemistries, pulling Residential Battery Energy Storage System demand toward thermally stable solid-state battery advancements and advanced thermal runaway mitigation technologies for secure residential decarbonization projects.
  • Revisions to net energy metering policies across mature energy networks have significantly reduced feed-in tariff compensation, shifting Residential Battery Energy Storage System demand toward DC-coupled solar integration that maximizes onsite rooftop photovoltaic installations rather than grid exportation.

Dive into Technavio’s robust research methodology, blending expert interviews, extensive data synthesis, and validated models for unparalleled Residential Battery Energy Storage System Market insights. See full methodology.

Market Scope
Page number 297
Base year 2025
Historic period 2020-2024
Forecast period 2026-2030
Growth momentum & CAGR Accelerate at a CAGR of 25.7%
Market growth 2026-2030 USD 10861.1 million
Market structure Fragmented
YoY growth 2025-2026(%) 23.3%
Key countries Australia, China, Japan, South Korea, India, Indonesia, Germany, Italy, UK, Spain, France, The Netherlands, US, Canada, Mexico, UAE, Saudi Arabia, South Africa, Israel, Turkey, Brazil, Chile and Argentina
Competitive landscape Leading Companies, Market Positioning of Companies, Competitive Strategies, and Industry Risks

Request Free Sample

Research Analyst Overview

  • The Residential Battery Energy Storage System sector continuously transforms through the rapid integration of advanced power electronics and intelligent control software. Modern hardware configurations increasingly leverage hybrid inverter consolidation to streamline residential installations, reducing physical footprint and point-of-failure risks.
  • As energy pricing volatility accelerates, product strategy at the boardroom level increasingly centers on embedding cellular remote telemetry and bidirectional charging capabilities to unlock secondary revenue streams for consumers. Properties utilizing these cloud-connected systems have achieved a 30% reduction in net monthly electricity expenditures by autonomously optimizing charge and discharge cycles based on real-time grid tariffs.
  • Furthermore, the transition toward solid-state battery advancements addresses critical thermal runaway mitigation requirements, ensuring strict compliance with evolving indoor fire safety codes. This technological progression allows households to maintain essential operations during severe grid failures while actively participating in ancillary income generation through localized demand response networks.
  • The continuous refinement of dynamic charge acceptance ensures that intermittent solar generation is captured efficiently, solidifying the operational viability of decentralized energy infrastructure.

What are the Key Data Covered in this Residential Battery Energy Storage System Market Research and Growth Report?

  • What is the expected growth of the Residential Battery Energy Storage System Market between 2026 and 2030?

    • USD 10.86 billion, at a CAGR of 25.7%

  • What segmentation does the market report cover?

    • The report is segmented by Type (Lithium-ion, and Lead acid), Power Rating (Between 6-10 kW, Between 3-6 kW, and Between 10-20 kW), Connectivity (On-grid, and Off-grid) and Geography (APAC, Europe, North America, Middle East and Africa, South America)

  • Which regions are analyzed in the report?

    • APAC, Europe, North America, Middle East and Africa and South America

  • What are the key growth drivers and market challenges?

    • Rising utility tariff inflation and dynamic time-of-use rate structures accelerating economic self-consumption, Proversive capital outlays and financing barriers inhibiting residential adoption in low income markets

  • Who are the major players in the Residential Battery Energy Storage System Market?

    • Alpha ESS Co. Ltd., BYD Co. Ltd., Delta Electronics Inc., Enphase Energy Inc., Fimer SpA, Fronius International GmbH, Generac Power Systems Inc., GoodWe Technologies Co. Ltd., Growatt New Energy, Huawei Technologies Co. Ltd., LG Energy Solution Ltd., Panasonic Holdings Corp., Samsung SDI Co. Ltd., SMA Solar Technology AG, SolarEdge Technologies Inc., SolaX Power Network Technology, Sungrow Power Supply Co. Ltd., Tesla Inc., VARTA AG and Victron Energy BV

Market Research Insights

  • The Residential Battery Energy Storage System sector continuously evolves to support comprehensive climate resilience infrastructure and residential decarbonization projects. Modern hardware configurations prioritize energy self-consumption maximization, allowing households to reduce peak grid dependency by up to 35% during high-demand windows.
  • Furthermore, the integration of split-phase output capability ensures reliable standby generator substitution, maintaining essential operations for heavy inductive motor loads during outages. Installations featuring automated demand response participation have seen a 40% improvement in ancillary grid service enrollment.
  • This structural shift fundamentally alters utility interactions, as advanced systems seamlessly manage daily energy generation and storage cycles to hedge against volatile electricity pricing and stabilize local grid networks.

We can help! Our analysts can customize this residential battery energy storage system market research report to meet your requirements.

Get in touch

1. Executive Summary

1.1 Market overview

Executive Summary - Chart on Market Overview
Executive Summary - Data Table on Market Overview
Executive Summary - Chart on Global Market Characteristics
Executive Summary - Chart on Market by Geography
Executive Summary - Chart on Market Segmentation by Type
Executive Summary - Chart on Market Segmentation by Power Rating
Executive Summary - Chart on Market Segmentation by Connectivity
Executive Summary - Chart on Incremental Growth
Executive Summary - Data Table on Incremental Growth
Executive Summary - Chart on Company Market Positioning

2. Technavio Analysis

2.1 Analysis of price sensitivity, lifecycle, customer purchase basket, adoption rates, and purchase criteria

2.2 Criticality of inputs and Factors of differentiation

Chart on Overview on criticality of inputs and factors of differentiation

2.3 Factors of disruption

Chart on Overview on factors of disruption

2.4 Impact of drivers and challenges

Chart on Impact of drivers and challenges in 2025 and 2030

3. Market Landscape

3.1 Market ecosystem

Chart on Parent Market
Data Table on - Parent Market

3.2 Market characteristics

Chart on Market characteristics analysis

3.3 Value chain analysis

Chart on Value chain analysis

4. Market Sizing

4.1 Market definition

Data Table on Offerings of companies included in the market definition

4.2 Market segment analysis

Market segments

4.3 Market size 2025

4.4 Market outlook: Forecast for 2025-2030

Chart on Global - Market size and forecast 2025-2030 ($ million)
Data Table on Global - Market size and forecast 2025-2030 ($ million)
Chart on Global Market: Year-over-year growth 2025-2030 (%)
Data Table on Global Market: Year-over-year growth 2025-2030 (%)

5. Historic Market Size

5.1 Global Residential Battery Energy Storage System Market 2020 - 2024

Historic Market Size - Data Table on Global Residential Battery Energy Storage System Market 2020 - 2024 ($ million)

5.2 Type segment analysis 2020 - 2024

Historic Market Size - Type Segment 2020 - 2024 ($ million)

5.3 Power Rating segment analysis 2020 - 2024

Historic Market Size - Power Rating Segment 2020 - 2024 ($ million)

5.4 Connectivity segment analysis 2020 - 2024

Historic Market Size - Connectivity Segment 2020 - 2024 ($ million)

5.5 Geography segment analysis 2020 - 2024

Historic Market Size - Geography Segment 2020 - 2024 ($ million)

5.6 Country segment analysis 2020 - 2024

Historic Market Size - Country Segment 2020 - 2024 ($ million)

6. Qualitative Analysis

6.1 Impact of AI on global residential battery energy storage system market

6.2 Impact of geopolitical conflicts on global residential battery energy storage system market

7. Five Forces Analysis

7.1 Five forces summary

Five forces analysis - Comparison between 2025 and 2030

7.2 Bargaining power of buyers

Bargaining power of buyers - Impact of key factors 2025 and 2030

7.3 Bargaining power of suppliers

Bargaining power of suppliers - Impact of key factors in 2025 and 2030

7.4 Threat of new entrants

Threat of new entrants - Impact of key factors in 2025 and 2030

7.5 Threat of substitutes

Threat of substitutes - Impact of key factors in 2025 and 2030

7.6 Threat of rivalry

Threat of rivalry - Impact of key factors in 2025 and 2030

7.7 Market condition

Chart on Market condition - Five forces 2025 and 2030

8. Market Segmentation by Type

8.1 Market segments

Chart on Type - Market share 2025-2030 (%)
Data Table on Type - Market share 2025-2030 (%)

8.2 Comparison by Type

Chart on Comparison by Type
Data Table on Comparison by Type

8.3 Lithium-ion - Market size and forecast 2025-2030

Chart on Lithium-ion - Market size and forecast 2025-2030 ($ million)
Data Table on Lithium-ion - Market size and forecast 2025-2030 ($ million)
Chart on Lithium-ion - Year-over-year growth 2025-2030 (%)
Data Table on Lithium-ion - Year-over-year growth 2025-2030 (%)

8.4 Lead acid - Market size and forecast 2025-2030

Chart on Lead acid - Market size and forecast 2025-2030 ($ million)
Data Table on Lead acid - Market size and forecast 2025-2030 ($ million)
Chart on Lead acid - Year-over-year growth 2025-2030 (%)
Data Table on Lead acid - Year-over-year growth 2025-2030 (%)

8.5 Market opportunity by Type

Market opportunity by Type ($ million)
Data Table on Market opportunity by Type ($ million)

9. Market Segmentation by Power Rating

9.1 Market segments

Chart on Power Rating - Market share 2025-2030 (%)
Data Table on Power Rating - Market share 2025-2030 (%)

9.2 Comparison by Power Rating

Chart on Comparison by Power Rating
Data Table on Comparison by Power Rating

9.3 Between 6-10 kW - Market size and forecast 2025-2030

Chart on Between 6-10 kW - Market size and forecast 2025-2030 ($ million)
Data Table on Between 6-10 kW - Market size and forecast 2025-2030 ($ million)
Chart on Between 6-10 kW - Year-over-year growth 2025-2030 (%)
Data Table on Between 6-10 kW - Year-over-year growth 2025-2030 (%)

9.4 Between 3-6 kW - Market size and forecast 2025-2030

Chart on Between 3-6 kW - Market size and forecast 2025-2030 ($ million)
Data Table on Between 3-6 kW - Market size and forecast 2025-2030 ($ million)
Chart on Between 3-6 kW - Year-over-year growth 2025-2030 (%)
Data Table on Between 3-6 kW - Year-over-year growth 2025-2030 (%)

9.5 Between 10-20 kW - Market size and forecast 2025-2030

Chart on Between 10-20 kW - Market size and forecast 2025-2030 ($ million)
Data Table on Between 10-20 kW - Market size and forecast 2025-2030 ($ million)
Chart on Between 10-20 kW - Year-over-year growth 2025-2030 (%)
Data Table on Between 10-20 kW - Year-over-year growth 2025-2030 (%)

9.6 Market opportunity by Power Rating

Market opportunity by Power Rating ($ million)
Data Table on Market opportunity by Power Rating ($ million)

10. Market Segmentation by Connectivity

10.1 Market segments

Chart on Connectivity - Market share 2025-2030 (%)
Data Table on Connectivity - Market share 2025-2030 (%)

10.2 Comparison by Connectivity

Chart on Comparison by Connectivity
Data Table on Comparison by Connectivity

10.3 On-grid - Market size and forecast 2025-2030

Chart on On-grid - Market size and forecast 2025-2030 ($ million)
Data Table on On-grid - Market size and forecast 2025-2030 ($ million)
Chart on On-grid - Year-over-year growth 2025-2030 (%)
Data Table on On-grid - Year-over-year growth 2025-2030 (%)

10.4 Off-grid - Market size and forecast 2025-2030

Chart on Off-grid - Market size and forecast 2025-2030 ($ million)
Data Table on Off-grid - Market size and forecast 2025-2030 ($ million)
Chart on Off-grid - Year-over-year growth 2025-2030 (%)
Data Table on Off-grid - Year-over-year growth 2025-2030 (%)

10.5 Market opportunity by Connectivity

Market opportunity by Connectivity ($ million)
Data Table on Market opportunity by Connectivity ($ million)

11. Customer Landscape

11.1 Customer landscape overview

Analysis of price sensitivity, lifecycle, customer purchase basket, adoption rates, and purchase criteria

12. Geographic Landscape

12.1 Geographic segmentation

Chart on Market share by geography 2025-2030 (%)
Data Table on Market share by geography 2025-2030 (%)

12.2 Geographic comparison

Chart on Geographic comparison
Data Table on Geographic comparison

12.3 APAC - Market size and forecast 2025-2030

Chart on APAC - Market size and forecast 2025-2030 ($ million)
Data Table on APAC - Market size and forecast 2025-2030 ($ million)
Chart on APAC - Year-over-year growth 2025-2030 (%)
Data Table on APAC - Year-over-year growth 2025-2030 (%)
Chart on Regional Comparison - APAC
Data Table on Regional Comparison - APAC

12.3.1 Australia - Market size and forecast 2025-2030

Chart on Australia - Market size and forecast 2025-2030 ($ million)
Data Table on Australia - Market size and forecast 2025-2030 ($ million)
Chart on Australia - Year-over-year growth 2025-2030 (%)
Data Table on Australia - Year-over-year growth 2025-2030 (%)

12.3.2 China - Market size and forecast 2025-2030

Chart on China - Market size and forecast 2025-2030 ($ million)
Data Table on China - Market size and forecast 2025-2030 ($ million)
Chart on China - Year-over-year growth 2025-2030 (%)
Data Table on China - Year-over-year growth 2025-2030 (%)

12.3.3 Japan - Market size and forecast 2025-2030

Chart on Japan - Market size and forecast 2025-2030 ($ million)
Data Table on Japan - Market size and forecast 2025-2030 ($ million)
Chart on Japan - Year-over-year growth 2025-2030 (%)
Data Table on Japan - Year-over-year growth 2025-2030 (%)

12.3.4 South Korea - Market size and forecast 2025-2030

Chart on South Korea - Market size and forecast 2025-2030 ($ million)
Data Table on South Korea - Market size and forecast 2025-2030 ($ million)
Chart on South Korea - Year-over-year growth 2025-2030 (%)
Data Table on South Korea - Year-over-year growth 2025-2030 (%)

12.3.5 India - Market size and forecast 2025-2030

Chart on India - Market size and forecast 2025-2030 ($ million)
Data Table on India - Market size and forecast 2025-2030 ($ million)
Chart on India - Year-over-year growth 2025-2030 (%)
Data Table on India - Year-over-year growth 2025-2030 (%)

12.3.6 Indonesia - Market size and forecast 2025-2030

Chart on Indonesia - Market size and forecast 2025-2030 ($ million)
Data Table on Indonesia - Market size and forecast 2025-2030 ($ million)
Chart on Indonesia - Year-over-year growth 2025-2030 (%)
Data Table on Indonesia - Year-over-year growth 2025-2030 (%)

12.4 Europe - Market size and forecast 2025-2030

Chart on Europe - Market size and forecast 2025-2030 ($ million)
Data Table on Europe - Market size and forecast 2025-2030 ($ million)
Chart on Europe - Year-over-year growth 2025-2030 (%)
Data Table on Europe - Year-over-year growth 2025-2030 (%)
Chart on Regional Comparison - Europe
Data Table on Regional Comparison - Europe

12.4.1 Germany - Market size and forecast 2025-2030

Chart on Germany - Market size and forecast 2025-2030 ($ million)
Data Table on Germany - Market size and forecast 2025-2030 ($ million)
Chart on Germany - Year-over-year growth 2025-2030 (%)
Data Table on Germany - Year-over-year growth 2025-2030 (%)

12.4.2 Italy - Market size and forecast 2025-2030

Chart on Italy - Market size and forecast 2025-2030 ($ million)
Data Table on Italy - Market size and forecast 2025-2030 ($ million)
Chart on Italy - Year-over-year growth 2025-2030 (%)
Data Table on Italy - Year-over-year growth 2025-2030 (%)

12.4.3 UK - Market size and forecast 2025-2030

Chart on UK - Market size and forecast 2025-2030 ($ million)
Data Table on UK - Market size and forecast 2025-2030 ($ million)
Chart on UK - Year-over-year growth 2025-2030 (%)
Data Table on UK - Year-over-year growth 2025-2030 (%)

12.4.4 Spain - Market size and forecast 2025-2030

Chart on Spain - Market size and forecast 2025-2030 ($ million)
Data Table on Spain - Market size and forecast 2025-2030 ($ million)
Chart on Spain - Year-over-year growth 2025-2030 (%)
Data Table on Spain - Year-over-year growth 2025-2030 (%)

12.4.5 France - Market size and forecast 2025-2030

Chart on France - Market size and forecast 2025-2030 ($ million)
Data Table on France - Market size and forecast 2025-2030 ($ million)
Chart on France - Year-over-year growth 2025-2030 (%)
Data Table on France - Year-over-year growth 2025-2030 (%)

12.4.6 The Netherlands - Market size and forecast 2025-2030

Chart on The Netherlands - Market size and forecast 2025-2030 ($ million)
Data Table on The Netherlands - Market size and forecast 2025-2030 ($ million)
Chart on The Netherlands - Year-over-year growth 2025-2030 (%)
Data Table on The Netherlands - Year-over-year growth 2025-2030 (%)

12.5 North America - Market size and forecast 2025-2030

Chart on North America - Market size and forecast 2025-2030 ($ million)
Data Table on North America - Market size and forecast 2025-2030 ($ million)
Chart on North America - Year-over-year growth 2025-2030 (%)
Data Table on North America - Year-over-year growth 2025-2030 (%)
Chart on Regional Comparison - North America
Data Table on Regional Comparison - North America

12.5.1 US - Market size and forecast 2025-2030

Chart on US - Market size and forecast 2025-2030 ($ million)
Data Table on US - Market size and forecast 2025-2030 ($ million)
Chart on US - Year-over-year growth 2025-2030 (%)
Data Table on US - Year-over-year growth 2025-2030 (%)

12.5.2 Canada - Market size and forecast 2025-2030

Chart on Canada - Market size and forecast 2025-2030 ($ million)
Data Table on Canada - Market size and forecast 2025-2030 ($ million)
Chart on Canada - Year-over-year growth 2025-2030 (%)
Data Table on Canada - Year-over-year growth 2025-2030 (%)

12.5.3 Mexico - Market size and forecast 2025-2030

Chart on Mexico - Market size and forecast 2025-2030 ($ million)
Data Table on Mexico - Market size and forecast 2025-2030 ($ million)
Chart on Mexico - Year-over-year growth 2025-2030 (%)
Data Table on Mexico - Year-over-year growth 2025-2030 (%)

12.6 Middle East and Africa - Market size and forecast 2025-2030

Chart on Middle East and Africa - Market size and forecast 2025-2030 ($ million)
Data Table on Middle East and Africa - Market size and forecast 2025-2030 ($ million)
Chart on Middle East and Africa - Year-over-year growth 2025-2030 (%)
Data Table on Middle East and Africa - Year-over-year growth 2025-2030 (%)
Chart on Regional Comparison - Middle East and Africa
Data Table on Regional Comparison - Middle East and Africa

12.6.1 UAE - Market size and forecast 2025-2030

Chart on UAE - Market size and forecast 2025-2030 ($ million)
Data Table on UAE - Market size and forecast 2025-2030 ($ million)
Chart on UAE - Year-over-year growth 2025-2030 (%)
Data Table on UAE - Year-over-year growth 2025-2030 (%)

12.6.2 Saudi Arabia - Market size and forecast 2025-2030

Chart on Saudi Arabia - Market size and forecast 2025-2030 ($ million)
Data Table on Saudi Arabia - Market size and forecast 2025-2030 ($ million)
Chart on Saudi Arabia - Year-over-year growth 2025-2030 (%)
Data Table on Saudi Arabia - Year-over-year growth 2025-2030 (%)

12.6.3 South Africa - Market size and forecast 2025-2030

Chart on South Africa - Market size and forecast 2025-2030 ($ million)
Data Table on South Africa - Market size and forecast 2025-2030 ($ million)
Chart on South Africa - Year-over-year growth 2025-2030 (%)
Data Table on South Africa - Year-over-year growth 2025-2030 (%)

12.6.4 Israel - Market size and forecast 2025-2030

Chart on Israel - Market size and forecast 2025-2030 ($ million)
Data Table on Israel - Market size and forecast 2025-2030 ($ million)
Chart on Israel - Year-over-year growth 2025-2030 (%)
Data Table on Israel - Year-over-year growth 2025-2030 (%)

12.6.5 Turkey - Market size and forecast 2025-2030

Chart on Turkey - Market size and forecast 2025-2030 ($ million)
Data Table on Turkey - Market size and forecast 2025-2030 ($ million)
Chart on Turkey - Year-over-year growth 2025-2030 (%)
Data Table on Turkey - Year-over-year growth 2025-2030 (%)

12.7 South America - Market size and forecast 2025-2030

Chart on South America - Market size and forecast 2025-2030 ($ million)
Data Table on South America - Market size and forecast 2025-2030 ($ million)
Chart on South America - Year-over-year growth 2025-2030 (%)
Data Table on South America - Year-over-year growth 2025-2030 (%)
Chart on Regional Comparison - South America
Data Table on Regional Comparison - South America

12.7.1 Brazil - Market size and forecast 2025-2030

Chart on Brazil - Market size and forecast 2025-2030 ($ million)
Data Table on Brazil - Market size and forecast 2025-2030 ($ million)
Chart on Brazil - Year-over-year growth 2025-2030 (%)
Data Table on Brazil - Year-over-year growth 2025-2030 (%)

12.7.2 Chile - Market size and forecast 2025-2030

Chart on Chile - Market size and forecast 2025-2030 ($ million)
Data Table on Chile - Market size and forecast 2025-2030 ($ million)
Chart on Chile - Year-over-year growth 2025-2030 (%)
Data Table on Chile - Year-over-year growth 2025-2030 (%)

12.7.3 Argentina - Market size and forecast 2025-2030

Chart on Argentina - Market size and forecast 2025-2030 ($ million)
Data Table on Argentina - Market size and forecast 2025-2030 ($ million)
Chart on Argentina - Year-over-year growth 2025-2030 (%)
Data Table on Argentina - Year-over-year growth 2025-2030 (%)

12.8 Market opportunity by geography

Market opportunity by geography ($ million)
Data Tables on Market opportunity by geography ($ million)

13. Drivers, Challenges, and Opportunity

13.1 Market drivers

Rising utility tariff inflation and dynamic time-of-use rate structures accelerating economic self-consumption
Increasing severe weather outages and transmission grid instability elevating demand for home energy resilience
Rapid expansion of virtual power plant ecosystems unlocking secondary revenue streams for homeowners

13.2 Market challenges

Proversive capital outlays and financing barriers inhibiting residential adoption in low income markets
Inconsistent regulatory policy shifts and reducing net metering incentives restricting customer value propositions
Complex grid interconnection protocols and unstandardized permitting standards lengthening system commissioning timelines

13.3 Impact of drivers and challenges

Impact of drivers and challenges in 2025 and 2030

13.4 Market opportunities

Accelerating industry transition toward modular high-voltage lithium iron phosphate battery architectures
Widespread integration of AI energy management systems with smart home ecosystems
Growth of direct DC-coupled solar integration and all-in-one hybrid storage system hardware formats

14. Competitive Landscape

14.1 Overview

14.2

Overview on criticality of inputs and factors of differentiation

14.3 Landscape disruption

Overview on factors of disruption

14.4 Industry risks

Impact of key risks on business

15. Competitive Analysis

15.1 Companies profiled

Companies covered

15.2 Company ranking index

15.3 Market positioning of companies

Matrix on companies position and classification

15.4 BYD Co. Ltd.

BYD Co. Ltd. - Overview
BYD Co. Ltd. - Business segments
BYD Co. Ltd. - Key news
BYD Co. Ltd. - Key offerings
BYD Co. Ltd. - Segment focus
SWOT

15.5 Delta Electronics Inc.

Delta Electronics Inc. - Overview
Delta Electronics Inc. - Business segments
Delta Electronics Inc. - Key offerings
Delta Electronics Inc. - Segment focus
SWOT

15.6 Enphase Energy Inc.

Enphase Energy Inc. - Overview
Enphase Energy Inc. - Product / Service
Enphase Energy Inc. - Key news
Enphase Energy Inc. - Key offerings
SWOT

15.7 Generac Power Systems Inc.

Generac Power Systems Inc. - Overview
Generac Power Systems Inc. - Business segments
Generac Power Systems Inc. - Key news
Generac Power Systems Inc. - Key offerings
Generac Power Systems Inc. - Segment focus
SWOT

15.8 GoodWe Technologies Co. Ltd.

GoodWe Technologies Co. Ltd. - Overview
GoodWe Technologies Co. Ltd. - Product / Service
GoodWe Technologies Co. Ltd. - Key offerings
SWOT

15.9 Growatt New Energy

Growatt New Energy - Overview
Growatt New Energy - Product / Service
Growatt New Energy - Key offerings
SWOT

15.10 LG Energy Solution Ltd.

LG Energy Solution Ltd. - Overview
LG Energy Solution Ltd. - Product / Service
LG Energy Solution Ltd. - Key news
LG Energy Solution Ltd. - Key offerings
SWOT

15.11 Panasonic Holdings Corp.

Panasonic Holdings Corp. - Overview
Panasonic Holdings Corp. - Business segments
Panasonic Holdings Corp. - Key news
Panasonic Holdings Corp. - Key offerings
Panasonic Holdings Corp. - Segment focus
SWOT

15.12 Samsung SDI Co. Ltd.

Samsung SDI Co. Ltd. - Overview
Samsung SDI Co. Ltd. - Business segments
Samsung SDI Co. Ltd. - Key offerings
Samsung SDI Co. Ltd. - Segment focus
SWOT

15.13 SMA Solar Technology AG

SMA Solar Technology AG - Overview
SMA Solar Technology AG - Business segments
SMA Solar Technology AG - Key offerings
SMA Solar Technology AG - Segment focus
SWOT

15.14 SolarEdge Technologies Inc.

SolarEdge Technologies Inc. - Overview
SolarEdge Technologies Inc. - Product / Service
SolarEdge Technologies Inc. - Key offerings
SWOT

15.15 SolaX Power Network Technology

SolaX Power Network Technology - Overview
SolaX Power Network Technology - Business segments
SolaX Power Network Technology - Key offerings
SolaX Power Network Technology - Segment focus
SWOT

15.16 Sungrow Power Supply Co. Ltd.

Sungrow Power Supply Co. Ltd. - Overview
Sungrow Power Supply Co. Ltd. - Product / Service
Sungrow Power Supply Co. Ltd. - Key offerings
SWOT

15.17 Tesla Inc.

Tesla Inc. - Overview
Tesla Inc. - Business segments
Tesla Inc. - Key offerings
Tesla Inc. - Segment focus
SWOT

15.18 VARTA AG

VARTA AG - Overview
VARTA AG - Business segments
VARTA AG - Key news
VARTA AG - Key offerings
VARTA AG - Segment focus
SWOT

16. Appendix

16.1 Scope of the report

Market definition
Objectives
Notes and caveats

16.2 Inclusions and exclusions checklist

Inclusions checklist
Exclusions checklist

16.3 Currency conversion rates for US$

16.4 Research methodology

16.5 Data procurement

Information sources

16.6 Data validation

16.7 Validation techniques employed for market sizing

16.8 Data synthesis

16.9 360 degree market analysis

16.10 List of abbreviations

Research Methodology

Technavio presents a detailed picture of the market by way of study, synthesis, and summation of data from multiple sources. The analysts have presented the various facets of the market with a particular focus on identifying the key industry influencers. The data thus presented is comprehensive, reliable, and the result of extensive research, both primary and secondary.

INFORMATION SOURCES

Primary sources

  • Manufacturers and suppliers
  • Channel partners
  • Industry experts
  • Strategic decision makers

Secondary sources

  • Industry journals and periodicals
  • Government data
  • Financial reports of key industry players
  • Historical data
  • Press releases

DATA ANALYSIS

Data Synthesis

  • Collation of data
  • Estimation of key figures
  • Analysis of derived insights

Data Validation

  • Triangulation with data models
  • Reference against proprietary databases
  • Corroboration with industry experts

REPORT WRITING

Qualitative

  • Market drivers
  • Market challenges
  • Market trends
  • Five forces analysis

Quantitative

  • Market size and forecast
  • Market segmentation
  • Geographical insights
  • Competitive landscape

Interested in this report?

Get your sample now to see our research methodology and insights!

Download Now

Frequently Asked Questions

Residential Battery Energy Storage System market growth will increase by USD 10861.1 million during 2026-2030.

The Residential Battery Energy Storage System market is expected to grow at a CAGR of 25.7% during 2026-2030.

Residential Battery Energy Storage System market is segmented by Type (Lithium-ion, Lead acid) Power rating (Between 6-10 kW, Between 3-6 kW, Between 10-20 kW) Connectivity (On-grid, Off-grid)

Alpha ESS Co. Ltd., BYD Co. Ltd., Delta Electronics Inc., Enphase Energy Inc., Fimer SpA, Fronius International GmbH, Generac Power Systems Inc., GoodWe Technologies Co. Ltd., Growatt New Energy, Huawei Technologies Co. Ltd., LG Energy Solution Ltd., Panasonic Holdings Corp., Samsung SDI Co. Ltd., SMA Solar Technology AG, SolarEdge Technologies Inc., SolaX Power Network Technology, Sungrow Power Supply Co. Ltd., Tesla Inc., VARTA AG, Victron Energy BV are a few of the key vendors in the Residential Battery Energy Storage System market.

APAC will register the highest growth rate of 49.1% among the other regions. Therefore, the Residential Battery Energy Storage System market in APAC is expected to garner significant business opportunities for the vendors during the forecast period.

Australia, China, Japan, South Korea, India, Indonesia, Germany, Italy, UK, Spain, France, The Netherlands, US, Canada, Mexico, UAE, Saudi Arabia, South Africa, Israel, Turkey, Brazil, Chile, Argentina

  • Rising utility tariff inflation and dynamic time-of-use rate structures accelerating economic self-consumption is the driving factor this market.

The Residential Battery Energy Storage System market vendors should focus on grabbing business opportunities from the Type segment as it accounted for the largest market share in the base year.
RIA - Research AI Assistant
Ask RIA
