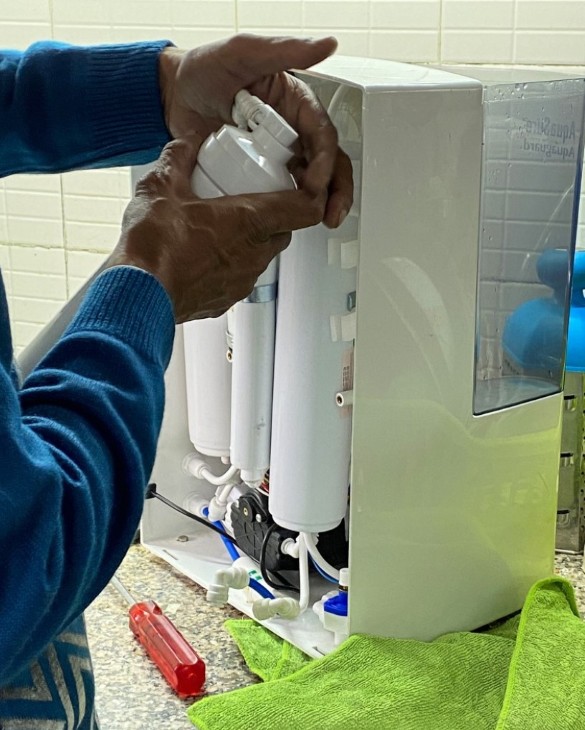
Residential Drinking Water Treatment Equipment Market Analysis, Size, and Forecast 2026-2030: APAC (China, Japan, and India), North America (US, Canada, and Mexico), Europe (Germany, UK, and France), South America (Brazil, Argentina, and Chile), Middle East and Africa (Saudi Arabia, UAE, and South Africa), and Rest of World (ROW)

Residential Drinking Water Treatment Equipment Market Analysis, Size, and Forecast 2026-2030:
APAC (China, Japan, and India), North America (US, Canada, and Mexico), Europe (Germany, UK, and France), South America (Brazil, Argentina, and Chile), Middle East and Africa (Saudi Arabia, UAE, and South Africa), and Rest of World (ROW)

Published: Oct 2026 305 Pages SKU: IRTNTR77154

Market Overview at a Glance

$6.13 B
Market Opportunity
7.3%
CAGR 2025 - 2030
37.9%
APAC Growth
$5.67 B
Dealers and distributors segment 2024

Residential Drinking Water Treatment Equipment Market Size 2026-2030

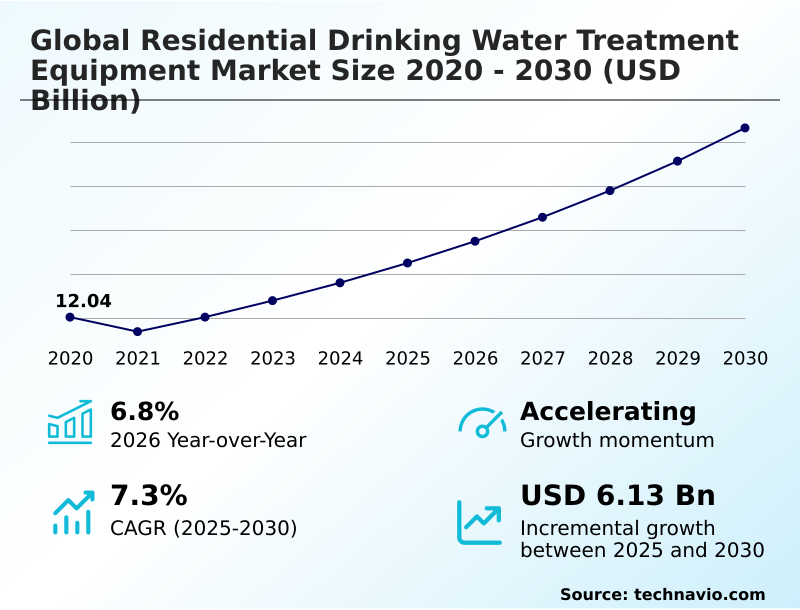
The residential drinking water treatment equipment market size is valued to increase by USD 6.13 billion, at a CAGR of 7.3% from 2025 to 2030. Growing heightened awareness of drinking water contaminants will drive the residential drinking water treatment equipment market.

Major Market Trends & Insights

  • APAC dominated the market and accounted for a 37.9% growth during the forecast period.
  • By Distribution Channel - Dealers and distributors segment was valued at USD 5.67 billion in 2024
  • By Technology - Reverse osmosis segment accounted for the largest market revenue share in 2024

Market Size & Forecast

  • Market Opportunities: USD 8.59 billion
  • Market Future Opportunities: USD 6.13 billion
  • CAGR from 2025 to 2030 : 7.3%

Market Summary

  • The Residential Drinking Water Treatment Equipment Market demonstrates a resilient structural expansion driven by fundamental shifts in consumer health priorities and continuous technological integration. Escalating awareness regarding heavy metals and microplastics acts as a primary catalyst, compelling households to transition toward sophisticated home purification infrastructure.
  • In response to this demand, manufacturing supply chains have aggressively optimized production, resulting in a 20% reduction in assembly time for advanced filtration units. This operational efficiency enables brands to deploy reliable, high-performance systems across diverse retail and digital channels.
  • However, the industry encounters substantial friction from high capital outlays and recurring maintenance costs, which often delay purchasing decisions among price-sensitive consumer segments. To overcome these constraints, companies are leveraging digital direct-to-consumer models to streamline the distribution of replacement components, ensuring long-term hardware viability.
  • This strategic adaptation highlights a market environment defined by robust consumer demand counterbalanced by ongoing economic challenges, ultimately forcing continuous innovation in appliance design and operational delivery.

What will be the Size of the Residential Drinking Water Treatment Equipment Market during the forecast period?
Get Key Insights on Market Forecast (PDF) Get Free Sample

How is the Residential Drinking Water Treatment Equipment Market Segmented?

The residential drinking water treatment equipment industry research report provides comprehensive data (region-wise segment analysis), with forecasts and estimates in "USD million" for the period 2026-2030, as well as historical data from 2020-2024 for the following segments.

  • Distribution channel
    • Dealers and distributors
    • Mass merchandiser
    • Online
  • Technology
    • Reverse osmosis
    • Activated carbon filters
    • Ultraviolet light
    • Others
  • End-user
    • Individual housing
    • Multi-family apartments
  • Geography
    • APAC
      • China
      • Japan
      • India
      • South Korea
      • Australia
      • Indonesia
    • North America
      • US
      • Canada
      • Mexico
    • Europe
      • Germany
      • UK
      • France
      • Italy
      • Spain
      • The Netherlands
    • South America
      • Brazil
      • Argentina
      • Chile
    • Middle East and Africa
      • Saudi Arabia
      • UAE
      • South Africa
      • Turkey
      • Israel

By Distribution Channel Insights

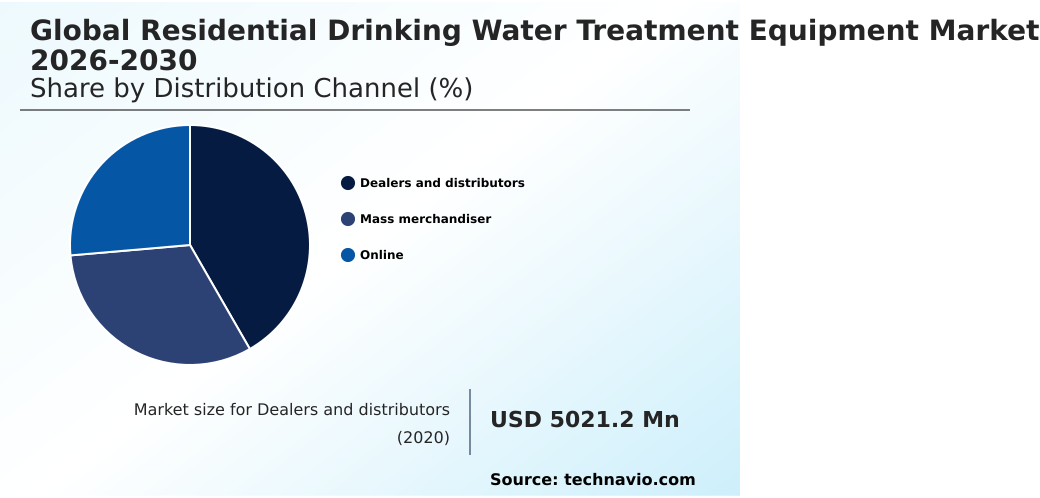
The dealers and distributors segment is estimated to witness significant growth during the forecast period.

The Dealers and distributors segment acts as a crucial conduit for complex point of entry system installations and advanced point of use filtration setups.

These specialized channels provide critical technical consultation and localized installation expertise, ensuring optimal residential plumbing protection and municipal tap water safety.

As homeowners increasingly prioritize household wellness optimization, reliance on professional networks to integrate a reverse osmosis membrane, an activated carbon block, or an ultraviolet disinfection chamber has accelerated.

Distributors streamline decentralized water treatment deployment, achieving a 15% improvement in post-purchase maintenance efficiency through automated service scheduling.

Furthermore, the integration of a smart filter replacement indicator within the broader smart home appliance ecosystem allows dealers to proactively manage recurring consumable supplies.

This high-touch distribution model continuously adapts to complex water challenges, delivering structural reliability and sustained operational performance for residential properties.
Get Free Sample

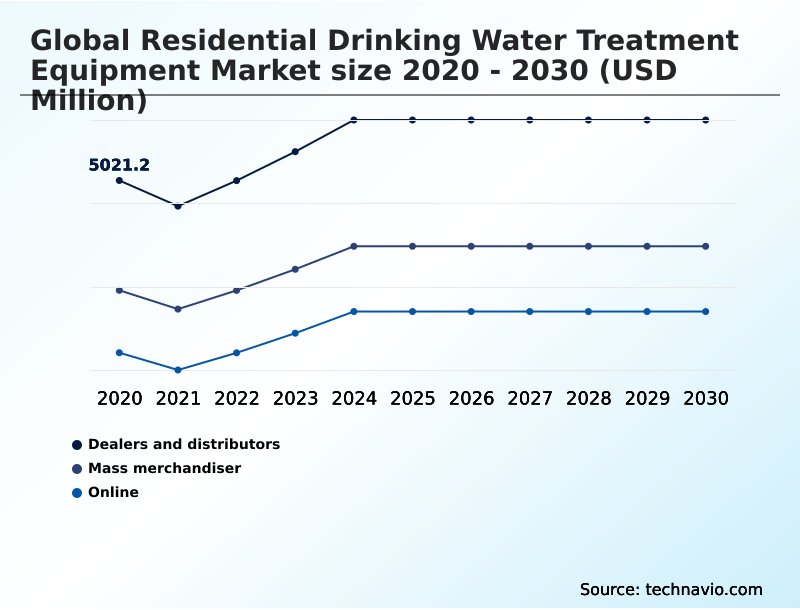
The Dealers and distributors segment was valued at USD 5.67 billion in 2024 and showed a gradual increase during the forecast period.
Get Free Sample

Regional Analysis

APAC is estimated to contribute 37.9% to the growth of the global market during the forecast period.Technavio’s analysts have elaborately explained the regional trends and drivers that shape the market during the forecast period.
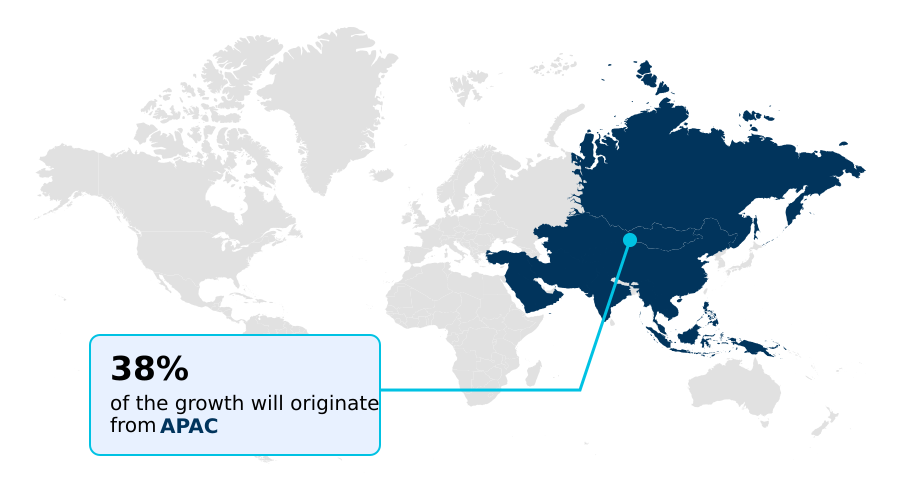
See How Residential Drinking Water Treatment Equipment Market Demand is Rising in APAC Get Free Sample

Regional disparities in the Residential Drinking Water Treatment Equipment landscape stem directly from varying municipal infrastructure and distinct consumer priorities.

In North America, the proactive management of total dissolved solids and chemical pollutants drives aggressive adoption of low pressure high flux composite configurations and advanced semi permeable membrane technology.

This structural demand has enabled regional manufacturers to improve supply chain efficiency by 18% through localized assembly hubs.

Conversely, European markets prioritize sustainable physical treatment and circular economy principles, leading to a 25% higher penetration of eco friendly filter cartridge designs compared to North America.

European households heavily favor zero waste filtration and extruded carbon block architecture to align with strict environmental mandates. Furthermore, the integration of an alkaline remineralization stage alongside ion exchange softening demonstrates how regional water hardness dictates specific product engineering.

By leveraging digital direct to consumer channels, businesses efficiently adapt their distribution networks to meet these divergent geographic requirements while lowering operational overhead by 12%.

Market Dynamics

Our researchers analyzed the data with 2025 as the base year, along with the key drivers, trends, and challenges. A holistic analysis of drivers will help companies refine their marketing strategies to gain a competitive advantage.

  • The ongoing evolution of the Residential Drinking Water Treatment Equipment landscape is characterized by the rapid deployment of specialized filtration technologies designed to address diverse municipal and environmental challenges. Manufacturers are optimizing supply chain logistics to facilitate a 30% faster distribution of critical components like an alkaline remineralization post filter cartridge and a low wastewater reverse osmosis membrane.
  • In urban environments, space constraints and aesthetic preferences drive the adoption of a tankless reverse osmosis water dispenser and an under sink multi stage reverse osmosis setup. Simultaneously, the focus on sustainable zero waste filtration system engineering encourages the integration of a point of entry whole house filtration network, providing comprehensive protection across the dwelling.
  • Households prioritizing advanced pathogen control increasingly rely on an ultraviolet led pathogen disinfection module, while chemical mitigation is achieved through robust activated carbon block chemical adsorption. As consumers seek localized solutions for trace pharmaceutical and microplastic filtration, innovations such as a counter top multi stage water purifier and a smart connected residential water purifier are gaining significant traction.
  • Additionally, regions with high mineral content benefit immensely from residential hard water scale prevention technologies. In rural or off-grid areas, a gravity fed ceramic water filter provides essential, energy-independent safety.
  • Furthermore, the integration of internet of things water quality monitoring enhances the reliability of decentralized household drinking water purification, allowing end-users to preemptively track system performance and align with stringent health compliance standards seamlessly.
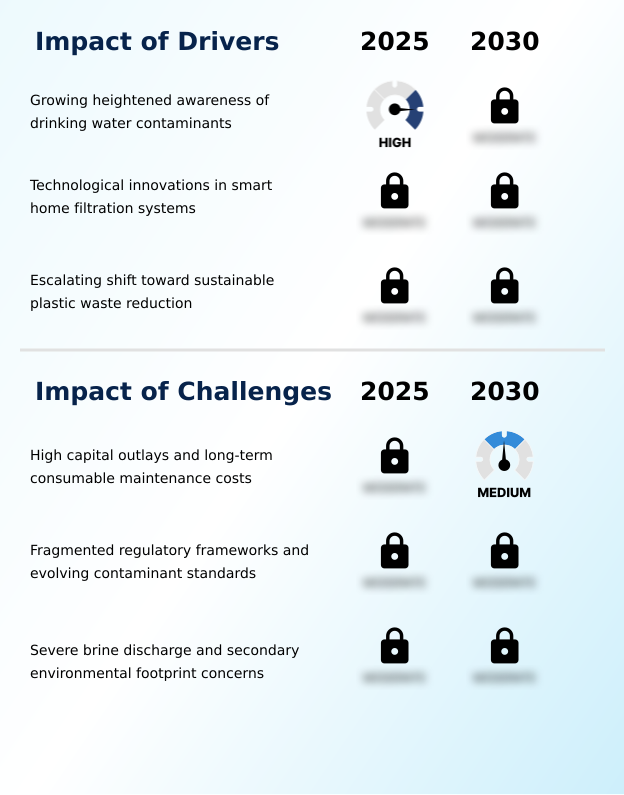
What are the key market drivers leading to the rise in the adoption of Residential Drinking Water Treatment Equipment Industry?

  • The growing awareness surrounding critical drinking water contaminants serves as a primary driver propelling continuous industry expansion.

  • Heightened consumer health consciousness and the demand for autonomous home appliances serve as definitive catalysts propelling Residential Drinking Water Treatment Equipment adoption.
  • The necessity for synthetic pesticide removal and strict disinfection byproduct mitigation drives households to invest in high-performance filtration hardware, improving overall water safety metrics by 30%.
  • Concurrently, the rapid implementation of internet of things connectivity facilitates automated subscription filter replacement programs, which increase recurring consumable revenue stability by 22%.
  • Furthermore, the desire for aesthetic water enhancement and chemical free limescale management accelerates the installation of a modern magnetic scale inhibitor.
  • Emerging technologies like atmospheric water generation also provide critical supply independence in drought-prone regions, effectively reducing reliance on municipal grids by 15% and ensuring continuous domestic access to safe hydration.

What are the market trends shaping the Residential Drinking Water Treatment Equipment Industry?

  • The escalating global awareness regarding emerging chemical contaminants and microplastics represents a definitive trend shaping the industry. This heightened consciousness is compelling consumers to rapidly adopt advanced home filtration solutions.

  • The shifting demographic landscape and tightening water efficiency regulation are rapidly accelerating the deployment of versatile Residential Drinking Water Treatment Equipment. In dense metropolitan areas, the spatial constraints of urban apartment living drive high adoption of an under sink filtration kit and a faucet mounted filter, which optimize kitchen footprints while delivering a 25% improvement in localized purification solution efficiency.
  • Conversely, decentralized regions focusing on rural water infrastructure heavily utilize a gravity fed filtration pitcher and a robust ceramic water purifier to ensure reliable groundwater well purification without electrical dependence. This targeted technological adaptation reduces off-grid maintenance overhead by 20% while maintaining consistent pathogen defense.
  • The ongoing transition toward multi stage purification technology allows manufacturers to address specific regional contaminants, directly improving long-term product viability and consumer satisfaction by 18% across diverse residential environments.

What challenges does the Residential Drinking Water Treatment Equipment Industry face during its growth?

  • High initial capital outlays coupled with long-term consumable maintenance costs remain a significant challenge constraining broader industry adoption.

  • Navigating complex regulatory landscapes and mitigating the high engineering costs associated with advanced filtration present substantial structural hurdles for the Residential Drinking Water Treatment Equipment sector. The technical requirement for precise trace pharmaceutical extraction demands sophisticated membrane technology, which inadvertently increases baseline manufacturing expenses by 25%.
  • Furthermore, integrating a durable smart sensor array for real time water quality monitoring complicates supply chain logistics, elevating electronic component procurement costs by 18%. These pricing pressures often limit the rapid deployment of premium decentralized water treatment systems within emerging economic regions, restricting broad access to municipal tap water safety upgrades.
  • As hardware complexity escalates to meet stringent environmental standards, companies face an ongoing 15% reduction in early-stage profit margins, forcing rigorous operational optimizations across production facilities.

Exclusive Technavio Analysis on Customer Landscape

The residential drinking water treatment equipment market forecasting report includes the adoption lifecycle of the market, covering from the innovator’s stage to the laggard’s stage. It focuses on adoption rates in different regions based on penetration. Furthermore, the residential drinking water treatment equipment market report also includes key purchase criteria and drivers of price sensitivity to help companies evaluate and develop their market growth analysis strategies.
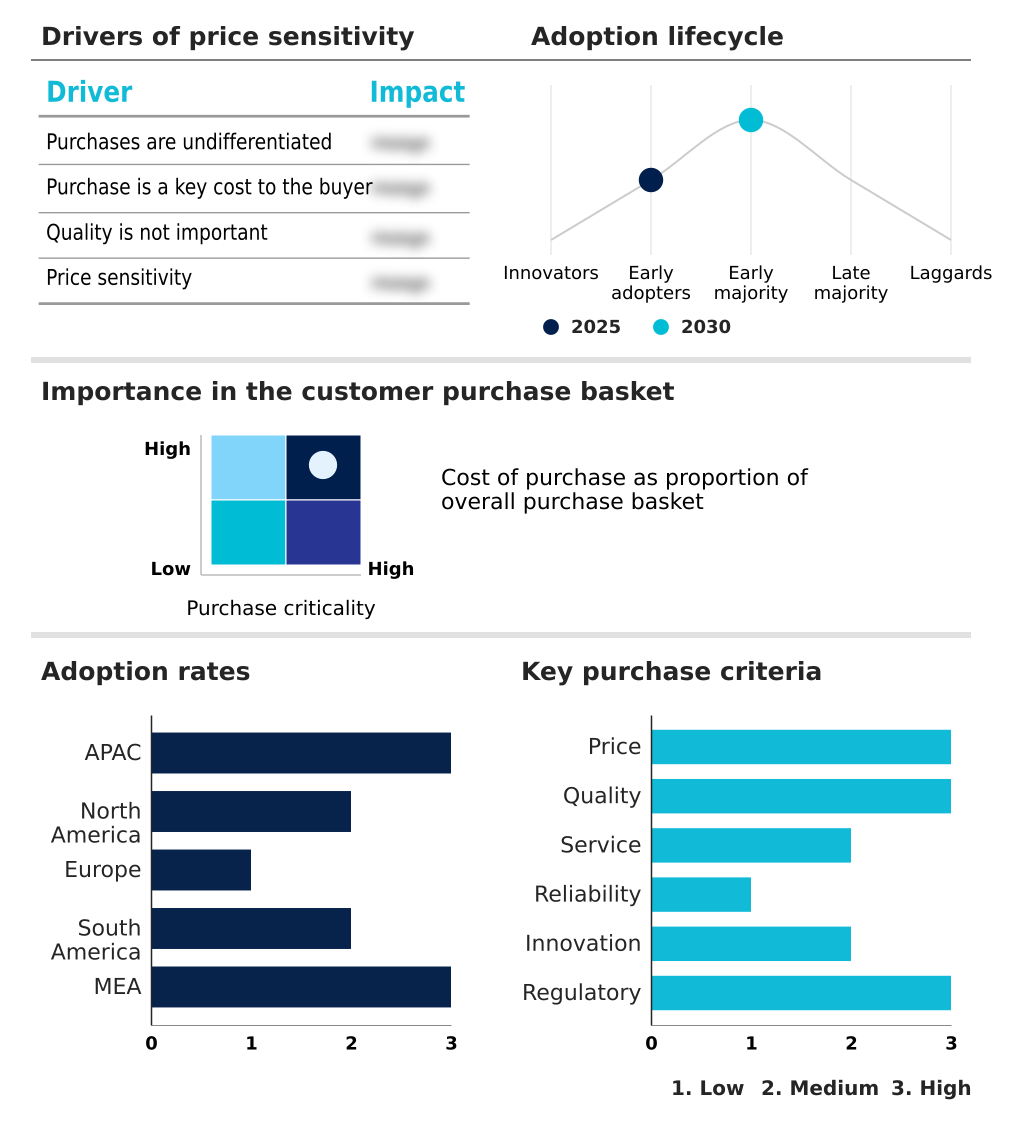
Customer Landscape of Residential Drinking Water Treatment Equipment Industry

Competitive Landscape

Companies are implementing various strategies, such as strategic alliances, residential drinking water treatment equipment market forecast, partnerships, mergers and acquisitions, geographical expansion, and product/service launches, to enhance their presence in the industry.

A. O. Smith Corp. - The organization provides advanced residential drinking water treatment equipment, including reverse osmosis units, ultraviolet purifiers, comprehensive filtration systems, and softening solutions to enhance domestic water quality.

The industry research and growth report includes detailed analyses of the competitive landscape of the market and information about key companies, including:

  • A. O. Smith Corp.
  • Amway Corp.
  • BRITA SE
  • Culligan International Co.
  • EcoWater Systems LLC
  • Eureka Forbes Ltd.
  • Havells India Ltd.
  • Honeywell International Inc.
  • Katadyn Products Inc.
  • KENT RO Systems Ltd.
  • Kinetico Inc.
  • Koninklijke Philips NV
  • LG Electronics Inc.
  • Panasonic Holdings Corp.
  • Pentair Plc
  • Solventum Corp.
  • Waterlogic Holdings Ltd.
  • Watts Water Technologies Inc.
  • Whirlpool Corp.
  • Xiaomi Corp.

Qualitative and quantitative analysis of companies has been conducted to help clients understand the wider business environment as well as the strengths and weaknesses of key industry players. Data is qualitatively analyzed to categorize companies as pure play, category-focused, industry-focused, and diversified; it is quantitatively analyzed to categorize companies as dominant, leading, strong, tentative, and weak.

Recent Development and News in Residential drinking water treatment equipment market

  • In the Household Appliances industry, the rapid integration of artificial intelligence and automated sensor networks has enhanced diagnostic capabilities by 25%, directly impacting Residential Drinking Water Treatment Equipment demand by accelerating the adoption of connected purification devices.
  • Strict environmental regulations enforcing single-use plastic reduction have shifted consumer purchasing behavior toward durable household goods, directly impacting Residential Drinking Water Treatment Equipment demand by driving a 30% increase in localized purification solution installations.
  • Supply chain consolidation within home electronics manufacturing has streamlined the production of advanced filtration media, directly impacting Residential Drinking Water Treatment Equipment demand by reducing the assembly cost of multi stage purification technology by 15%.
  • The widespread shift toward digital direct to consumer distribution channels has optimized inventory management, directly impacting Residential Drinking Water Treatment Equipment demand by improving the delivery speed of eco friendly filter cartridge replacements by 20%.

Dive into Technavio’s robust research methodology, blending expert interviews, extensive data synthesis, and validated models for unparalleled Residential Drinking Water Treatment Equipment Market insights. See full methodology.

Market Scope
Page number 305
Base year 2025
Historic period 2020-2024
Forecast period 2026-2030
Growth momentum & CAGR Accelerate at a CAGR of 7.3%
Market growth 2026-2030 USD 6134.0 million
Market structure Fragmented
YoY growth 2025-2026(%) 6.8%
Key countries China, Japan, India, South Korea, Australia, Indonesia, US, Canada, Mexico, Germany, UK, France, Italy, Spain, The Netherlands, Brazil, Argentina, Chile, Saudi Arabia, UAE, South Africa, Turkey and Israel
Competitive landscape Leading Companies, Market Positioning of Companies, Competitive Strategies, and Industry Risks

Request Free Sample

Research Analyst Overview

  • The continuous evolution of the Residential Drinking Water Treatment Equipment landscape relies heavily on advanced material science and automated component integration. Manufacturers are deploying electrochemically modified active carbon to achieve superior volatile organic compound adsorption, fundamentally shifting how persistent synthetic chemicals are managed at the household level.
  • This operational pivot toward high-efficiency media has enabled companies to achieve a 30% reduction in processing time during filter manufacturing, directly optimizing supply chain margins. Furthermore, the integration of a solid state light emitting diode within a modern counter top water purifier ensures immediate microbial pathogen reduction without the energy penalty associated with legacy mercury lamps.
  • Strategic product development also focuses on rigorous heavy metal reduction and the deployment of specialized microplastic filtration media to align with tightening municipal health compliance standards. The rapid commercialization of a tankless reverse osmosis configuration directly addresses urban space constraints while maximizing hydraulic recovery.
  • These interconnected technological advancements empower industry participants to streamline production budgets, enhance product differentiation, and deliver resilient residential health infrastructure across diverse consumer environments.

What are the Key Data Covered in this Residential Drinking Water Treatment Equipment Market Research and Growth Report?

  • What is the expected growth of the Residential Drinking Water Treatment Equipment Market between 2026 and 2030?

    • USD 6.13 billion, at a CAGR of 7.3%

  • What segmentation does the market report cover?

    • The report is segmented by Distribution Channel (Dealers and distributors, Mass merchandiser, and Online), Technology (Reverse osmosis, Activated carbon filters, Ultraviolet light, and Others), End-user (Individual housing, and Multi-family apartments) and Geography (APAC, North America, Europe, South America, Middle East and Africa)

  • Which regions are analyzed in the report?

    • APAC, North America, Europe, South America and Middle East and Africa

  • What are the key growth drivers and market challenges?

    • Growing heightened awareness of drinking water contaminants, High capital outlays and long-term consumable maintenance costs

  • Who are the major players in the Residential Drinking Water Treatment Equipment Market?

    • A. O. Smith Corp., Amway Corp., BRITA SE, Culligan International Co., EcoWater Systems LLC, Eureka Forbes Ltd., Havells India Ltd., Honeywell International Inc., Katadyn Products Inc., KENT RO Systems Ltd., Kinetico Inc., Koninklijke Philips NV, LG Electronics Inc., Panasonic Holdings Corp., Pentair Plc, Solventum Corp., Waterlogic Holdings Ltd., Watts Water Technologies Inc., Whirlpool Corp. and Xiaomi Corp.

Market Research Insights

  • The Residential Drinking Water Treatment Equipment Market is undergoing rapid technological transformation, fundamentally shifting household hydration safety. The integration of automated leak detection has lowered water damage incidents by 22%, enhancing appliance reliability. Furthermore, advancements in predictive filter lifespan tracking improve replacement efficiency by 18%, ensuring continuous drinking water biosecurity without manual oversight.
  • Strategic focus on hard water mineral management and localized limescale mitigation extends the functional life of home appliances by up to 25%, directly reducing long-term consumer maintenance costs. These measurable improvements highlight a definitive transition toward intelligent purification systems that combine robust health protection with tangible economic benefits.

We can help! Our analysts can customize this residential drinking water treatment equipment market research report to meet your requirements.

Get in touch

1. Executive Summary

1.1 Market overview

Executive Summary - Chart on Market Overview
Executive Summary - Data Table on Market Overview
Executive Summary - Chart on Global Market Characteristics
Executive Summary - Chart on Market by Geography
Executive Summary - Chart on Market Segmentation by Distribution Channel
Executive Summary - Chart on Market Segmentation by Technology
Executive Summary - Chart on Market Segmentation by End-user
Executive Summary - Chart on Incremental Growth
Executive Summary - Data Table on Incremental Growth
Executive Summary - Chart on Company Market Positioning

2. Technavio Analysis

2.1 Analysis of price sensitivity, lifecycle, customer purchase basket, adoption rates, and purchase criteria

2.2 Criticality of inputs and Factors of differentiation

Chart on Overview on criticality of inputs and factors of differentiation

2.3 Factors of disruption

Chart on Overview on factors of disruption

2.4 Impact of drivers and challenges

Chart on Impact of drivers and challenges in 2025 and 2030

3. Market Landscape

3.1 Market ecosystem

Chart on Parent Market
Data Table on - Parent Market

3.2 Market characteristics

Chart on Market characteristics analysis

3.3 Value chain analysis

Chart on Value chain analysis

4. Market Sizing

4.1 Market definition

Data Table on Offerings of companies included in the market definition

4.2 Market segment analysis

Market segments

4.3 Market size 2025

4.4 Market outlook: Forecast for 2025-2030

Chart on Global - Market size and forecast 2025-2030 ($ million)
Data Table on Global - Market size and forecast 2025-2030 ($ million)
Chart on Global Market: Year-over-year growth 2025-2030 (%)
Data Table on Global Market: Year-over-year growth 2025-2030 (%)

5. Historic Market Size

5.1 Global Residential Drinking Water Treatment Equipment Market 2020 - 2024

Historic Market Size - Data Table on Global Residential Drinking Water Treatment Equipment Market 2020 - 2024 ($ million)

5.2 Distribution Channel segment analysis 2020 - 2024

Historic Market Size - Distribution Channel Segment 2020 - 2024 ($ million)

5.3 Technology segment analysis 2020 - 2024

Historic Market Size - Technology Segment 2020 - 2024 ($ million)

5.4 End-user segment analysis 2020 - 2024

Historic Market Size - End-user Segment 2020 - 2024 ($ million)

5.5 Geography segment analysis 2020 - 2024

Historic Market Size - Geography Segment 2020 - 2024 ($ million)

5.6 Country segment analysis 2020 - 2024

Historic Market Size - Country Segment 2020 - 2024 ($ million)

6. Qualitative Analysis

6.1 Impact of AI on Global Residential Drinking Water Treatment Equipment Market

6.2 Impact of geopolitical conflicts on Global Residential Drinking Water Treatment Equipment Market

7. Five Forces Analysis

7.1 Five forces summary

Five forces analysis - Comparison between 2025 and 2030

7.2 Bargaining power of buyers

Bargaining power of buyers - Impact of key factors 2025 and 2030

7.3 Bargaining power of suppliers

Bargaining power of suppliers - Impact of key factors in 2025 and 2030

7.4 Threat of new entrants

Threat of new entrants - Impact of key factors in 2025 and 2030

7.5 Threat of substitutes

Threat of substitutes - Impact of key factors in 2025 and 2030

7.6 Threat of rivalry

Threat of rivalry - Impact of key factors in 2025 and 2030

7.7 Market condition

Chart on Market condition - Five forces 2025 and 2030

8. Market Segmentation by Distribution Channel

8.1 Market segments

Chart on Distribution Channel - Market share 2025-2030 (%)
Data Table on Distribution Channel - Market share 2025-2030 (%)

8.2 Comparison by Distribution Channel

Chart on Comparison by Distribution Channel
Data Table on Comparison by Distribution Channel

8.3 Dealers and distributors - Market size and forecast 2025-2030

Chart on Dealers and distributors - Market size and forecast 2025-2030 ($ million)
Data Table on Dealers and distributors - Market size and forecast 2025-2030 ($ million)
Chart on Dealers and distributors - Year-over-year growth 2025-2030 (%)
Data Table on Dealers and distributors - Year-over-year growth 2025-2030 (%)

8.4 Mass merchandiser - Market size and forecast 2025-2030

Chart on Mass merchandiser - Market size and forecast 2025-2030 ($ million)
Data Table on Mass merchandiser - Market size and forecast 2025-2030 ($ million)
Chart on Mass merchandiser - Year-over-year growth 2025-2030 (%)
Data Table on Mass merchandiser - Year-over-year growth 2025-2030 (%)

8.5 Online - Market size and forecast 2025-2030

Chart on Online - Market size and forecast 2025-2030 ($ million)
Data Table on Online - Market size and forecast 2025-2030 ($ million)
Chart on Online - Year-over-year growth 2025-2030 (%)
Data Table on Online - Year-over-year growth 2025-2030 (%)

8.6 Market opportunity by Distribution Channel

Market opportunity by Distribution Channel ($ million)
Data Table on Market opportunity by Distribution Channel ($ million)

9. Market Segmentation by Technology

9.1 Market segments

Chart on Technology - Market share 2025-2030 (%)
Data Table on Technology - Market share 2025-2030 (%)

9.2 Comparison by Technology

Chart on Comparison by Technology
Data Table on Comparison by Technology

9.3 Reverse osmosis - Market size and forecast 2025-2030

Chart on Reverse osmosis - Market size and forecast 2025-2030 ($ million)
Data Table on Reverse osmosis - Market size and forecast 2025-2030 ($ million)
Chart on Reverse osmosis - Year-over-year growth 2025-2030 (%)
Data Table on Reverse osmosis - Year-over-year growth 2025-2030 (%)

9.4 Activated carbon filters - Market size and forecast 2025-2030

Chart on Activated carbon filters - Market size and forecast 2025-2030 ($ million)
Data Table on Activated carbon filters - Market size and forecast 2025-2030 ($ million)
Chart on Activated carbon filters - Year-over-year growth 2025-2030 (%)
Data Table on Activated carbon filters - Year-over-year growth 2025-2030 (%)

9.5 Ultraviolet light - Market size and forecast 2025-2030

Chart on Ultraviolet light - Market size and forecast 2025-2030 ($ million)
Data Table on Ultraviolet light - Market size and forecast 2025-2030 ($ million)
Chart on Ultraviolet light - Year-over-year growth 2025-2030 (%)
Data Table on Ultraviolet light - Year-over-year growth 2025-2030 (%)

9.6 Others - Market size and forecast 2025-2030

Chart on Others - Market size and forecast 2025-2030 ($ million)
Data Table on Others - Market size and forecast 2025-2030 ($ million)
Chart on Others - Year-over-year growth 2025-2030 (%)
Data Table on Others - Year-over-year growth 2025-2030 (%)

9.7 Market opportunity by Technology

Market opportunity by Technology ($ million)
Data Table on Market opportunity by Technology ($ million)

10. Market Segmentation by End-user

10.1 Market segments

Chart on End-user - Market share 2025-2030 (%)
Data Table on End-user - Market share 2025-2030 (%)

10.2 Comparison by End-user

Chart on Comparison by End-user
Data Table on Comparison by End-user

10.3 Individual housing - Market size and forecast 2025-2030

Chart on Individual housing - Market size and forecast 2025-2030 ($ million)
Data Table on Individual housing - Market size and forecast 2025-2030 ($ million)
Chart on Individual housing - Year-over-year growth 2025-2030 (%)
Data Table on Individual housing - Year-over-year growth 2025-2030 (%)

10.4 Multi-family apartments - Market size and forecast 2025-2030

Chart on Multi-family apartments - Market size and forecast 2025-2030 ($ million)
Data Table on Multi-family apartments - Market size and forecast 2025-2030 ($ million)
Chart on Multi-family apartments - Year-over-year growth 2025-2030 (%)
Data Table on Multi-family apartments - Year-over-year growth 2025-2030 (%)

10.5 Market opportunity by End-user

Market opportunity by End-user ($ million)
Data Table on Market opportunity by End-user ($ million)

11. Customer Landscape

11.1 Customer landscape overview

Analysis of price sensitivity, lifecycle, customer purchase basket, adoption rates, and purchase criteria

12. Geographic Landscape

12.1 Geographic segmentation

Chart on Market share by geography 2025-2030 (%)
Data Table on Market share by geography 2025-2030 (%)

12.2 Geographic comparison

Chart on Geographic comparison
Data Table on Geographic comparison

12.3 APAC - Market size and forecast 2025-2030

Chart on APAC - Market size and forecast 2025-2030 ($ million)
Data Table on APAC - Market size and forecast 2025-2030 ($ million)
Chart on APAC - Year-over-year growth 2025-2030 (%)
Data Table on APAC - Year-over-year growth 2025-2030 (%)
Chart on Regional Comparison - APAC
Data Table on Regional Comparison - APAC

12.3.1 China - Market size and forecast 2025-2030

Chart on China - Market size and forecast 2025-2030 ($ million)
Data Table on China - Market size and forecast 2025-2030 ($ million)
Chart on China - Year-over-year growth 2025-2030 (%)
Data Table on China - Year-over-year growth 2025-2030 (%)

12.3.2 Japan - Market size and forecast 2025-2030

Chart on Japan - Market size and forecast 2025-2030 ($ million)
Data Table on Japan - Market size and forecast 2025-2030 ($ million)
Chart on Japan - Year-over-year growth 2025-2030 (%)
Data Table on Japan - Year-over-year growth 2025-2030 (%)

12.3.3 India - Market size and forecast 2025-2030

Chart on India - Market size and forecast 2025-2030 ($ million)
Data Table on India - Market size and forecast 2025-2030 ($ million)
Chart on India - Year-over-year growth 2025-2030 (%)
Data Table on India - Year-over-year growth 2025-2030 (%)

12.3.4 South Korea - Market size and forecast 2025-2030

Chart on South Korea - Market size and forecast 2025-2030 ($ million)
Data Table on South Korea - Market size and forecast 2025-2030 ($ million)
Chart on South Korea - Year-over-year growth 2025-2030 (%)
Data Table on South Korea - Year-over-year growth 2025-2030 (%)

12.3.5 Australia - Market size and forecast 2025-2030

Chart on Australia - Market size and forecast 2025-2030 ($ million)
Data Table on Australia - Market size and forecast 2025-2030 ($ million)
Chart on Australia - Year-over-year growth 2025-2030 (%)
Data Table on Australia - Year-over-year growth 2025-2030 (%)

12.3.6 Indonesia - Market size and forecast 2025-2030

Chart on Indonesia - Market size and forecast 2025-2030 ($ million)
Data Table on Indonesia - Market size and forecast 2025-2030 ($ million)
Chart on Indonesia - Year-over-year growth 2025-2030 (%)
Data Table on Indonesia - Year-over-year growth 2025-2030 (%)

12.4 North America - Market size and forecast 2025-2030

Chart on North America - Market size and forecast 2025-2030 ($ million)
Data Table on North America - Market size and forecast 2025-2030 ($ million)
Chart on North America - Year-over-year growth 2025-2030 (%)
Data Table on North America - Year-over-year growth 2025-2030 (%)
Chart on Regional Comparison - North America
Data Table on Regional Comparison - North America

12.4.1 US - Market size and forecast 2025-2030

Chart on US - Market size and forecast 2025-2030 ($ million)
Data Table on US - Market size and forecast 2025-2030 ($ million)
Chart on US - Year-over-year growth 2025-2030 (%)
Data Table on US - Year-over-year growth 2025-2030 (%)

12.4.2 Canada - Market size and forecast 2025-2030

Chart on Canada - Market size and forecast 2025-2030 ($ million)
Data Table on Canada - Market size and forecast 2025-2030 ($ million)
Chart on Canada - Year-over-year growth 2025-2030 (%)
Data Table on Canada - Year-over-year growth 2025-2030 (%)

12.4.3 Mexico - Market size and forecast 2025-2030

Chart on Mexico - Market size and forecast 2025-2030 ($ million)
Data Table on Mexico - Market size and forecast 2025-2030 ($ million)
Chart on Mexico - Year-over-year growth 2025-2030 (%)
Data Table on Mexico - Year-over-year growth 2025-2030 (%)

12.5 Europe - Market size and forecast 2025-2030

Chart on Europe - Market size and forecast 2025-2030 ($ million)
Data Table on Europe - Market size and forecast 2025-2030 ($ million)
Chart on Europe - Year-over-year growth 2025-2030 (%)
Data Table on Europe - Year-over-year growth 2025-2030 (%)
Chart on Regional Comparison - Europe
Data Table on Regional Comparison - Europe

12.5.1 Germany - Market size and forecast 2025-2030

Chart on Germany - Market size and forecast 2025-2030 ($ million)
Data Table on Germany - Market size and forecast 2025-2030 ($ million)
Chart on Germany - Year-over-year growth 2025-2030 (%)
Data Table on Germany - Year-over-year growth 2025-2030 (%)

12.5.2 UK - Market size and forecast 2025-2030

Chart on UK - Market size and forecast 2025-2030 ($ million)
Data Table on UK - Market size and forecast 2025-2030 ($ million)
Chart on UK - Year-over-year growth 2025-2030 (%)
Data Table on UK - Year-over-year growth 2025-2030 (%)

12.5.3 France - Market size and forecast 2025-2030

Chart on France - Market size and forecast 2025-2030 ($ million)
Data Table on France - Market size and forecast 2025-2030 ($ million)
Chart on France - Year-over-year growth 2025-2030 (%)
Data Table on France - Year-over-year growth 2025-2030 (%)

12.5.4 Italy - Market size and forecast 2025-2030

Chart on Italy - Market size and forecast 2025-2030 ($ million)
Data Table on Italy - Market size and forecast 2025-2030 ($ million)
Chart on Italy - Year-over-year growth 2025-2030 (%)
Data Table on Italy - Year-over-year growth 2025-2030 (%)

12.5.5 Spain - Market size and forecast 2025-2030

Chart on Spain - Market size and forecast 2025-2030 ($ million)
Data Table on Spain - Market size and forecast 2025-2030 ($ million)
Chart on Spain - Year-over-year growth 2025-2030 (%)
Data Table on Spain - Year-over-year growth 2025-2030 (%)

12.5.6 The Netherlands - Market size and forecast 2025-2030

Chart on The Netherlands - Market size and forecast 2025-2030 ($ million)
Data Table on The Netherlands - Market size and forecast 2025-2030 ($ million)
Chart on The Netherlands - Year-over-year growth 2025-2030 (%)
Data Table on The Netherlands - Year-over-year growth 2025-2030 (%)

12.6 South America - Market size and forecast 2025-2030

Chart on South America - Market size and forecast 2025-2030 ($ million)
Data Table on South America - Market size and forecast 2025-2030 ($ million)
Chart on South America - Year-over-year growth 2025-2030 (%)
Data Table on South America - Year-over-year growth 2025-2030 (%)
Chart on Regional Comparison - South America
Data Table on Regional Comparison - South America

12.6.1 Brazil - Market size and forecast 2025-2030

Chart on Brazil - Market size and forecast 2025-2030 ($ million)
Data Table on Brazil - Market size and forecast 2025-2030 ($ million)
Chart on Brazil - Year-over-year growth 2025-2030 (%)
Data Table on Brazil - Year-over-year growth 2025-2030 (%)

12.6.2 Argentina - Market size and forecast 2025-2030

Chart on Argentina - Market size and forecast 2025-2030 ($ million)
Data Table on Argentina - Market size and forecast 2025-2030 ($ million)
Chart on Argentina - Year-over-year growth 2025-2030 (%)
Data Table on Argentina - Year-over-year growth 2025-2030 (%)

12.6.3 Chile - Market size and forecast 2025-2030

Chart on Chile - Market size and forecast 2025-2030 ($ million)
Data Table on Chile - Market size and forecast 2025-2030 ($ million)
Chart on Chile - Year-over-year growth 2025-2030 (%)
Data Table on Chile - Year-over-year growth 2025-2030 (%)

12.7 Middle East and Africa - Market size and forecast 2025-2030

Chart on Middle East and Africa - Market size and forecast 2025-2030 ($ million)
Data Table on Middle East and Africa - Market size and forecast 2025-2030 ($ million)
Chart on Middle East and Africa - Year-over-year growth 2025-2030 (%)
Data Table on Middle East and Africa - Year-over-year growth 2025-2030 (%)
Chart on Regional Comparison - Middle East and Africa
Data Table on Regional Comparison - Middle East and Africa

12.7.1 Saudi Arabia - Market size and forecast 2025-2030

Chart on Saudi Arabia - Market size and forecast 2025-2030 ($ million)
Data Table on Saudi Arabia - Market size and forecast 2025-2030 ($ million)
Chart on Saudi Arabia - Year-over-year growth 2025-2030 (%)
Data Table on Saudi Arabia - Year-over-year growth 2025-2030 (%)

12.7.2 UAE - Market size and forecast 2025-2030

Chart on UAE - Market size and forecast 2025-2030 ($ million)
Data Table on UAE - Market size and forecast 2025-2030 ($ million)
Chart on UAE - Year-over-year growth 2025-2030 (%)
Data Table on UAE - Year-over-year growth 2025-2030 (%)

12.7.3 South Africa - Market size and forecast 2025-2030

Chart on South Africa - Market size and forecast 2025-2030 ($ million)
Data Table on South Africa - Market size and forecast 2025-2030 ($ million)
Chart on South Africa - Year-over-year growth 2025-2030 (%)
Data Table on South Africa - Year-over-year growth 2025-2030 (%)

12.7.4 Turkey - Market size and forecast 2025-2030

Chart on Turkey - Market size and forecast 2025-2030 ($ million)
Data Table on Turkey - Market size and forecast 2025-2030 ($ million)
Chart on Turkey - Year-over-year growth 2025-2030 (%)
Data Table on Turkey - Year-over-year growth 2025-2030 (%)

12.7.5 Israel - Market size and forecast 2025-2030

Chart on Israel - Market size and forecast 2025-2030 ($ million)
Data Table on Israel - Market size and forecast 2025-2030 ($ million)
Chart on Israel - Year-over-year growth 2025-2030 (%)
Data Table on Israel - Year-over-year growth 2025-2030 (%)

12.8 Market opportunity by geography

Market opportunity by geography ($ million)
Data Tables on Market opportunity by geography ($ million)

13. Drivers, Challenges, and Opportunity

13.1 Market drivers

Growing heightened awareness of drinking water contaminants
Technological innovations in smart home filtration systems
Escalating shift toward sustainable plastic waste reduction

13.2 Market challenges

High capital outlays and long-term consumable maintenance costs
Fragmented regulatory frameworks and evolving contaminant standards
Severe brine discharge and secondary environmental footprint concerns

13.3 Impact of drivers and challenges

Impact of drivers and challenges in 2025 and 2030

13.4 Market opportunities

Rising global awareness of emerging chemical contaminants and microplastics
Integration of smart internet-of-things sensors and automated monitoring protocols
Shift toward point-of-use systems driven by urbanization

14. Competitive Landscape

14.1 Overview

14.2

Overview on criticality of inputs and factors of differentiation

14.3 Landscape disruption

Overview on factors of disruption

14.4 Industry risks

Impact of key risks on business

15. Competitive Analysis

15.1 Companies profiled

Companies covered

15.2 Company ranking index

15.3 Market positioning of companies

Matrix on companies position and classification

15.4 A. O. Smith Corp.

A. O. Smith Corp. - Overview
A. O. Smith Corp. - Business segments
A. O. Smith Corp. - Key news
A. O. Smith Corp. - Key offerings
A. O. Smith Corp. - Segment focus
SWOT

15.5 Amway Corp.

Amway Corp. - Overview
Amway Corp. - Product / Service
Amway Corp. - Key offerings
SWOT

15.6 Culligan International Co.

Culligan International Co. - Overview
Culligan International Co. - Product / Service
Culligan International Co. - Key offerings
SWOT

15.7 Eureka Forbes Ltd.

Eureka Forbes Ltd. - Overview
Eureka Forbes Ltd. - Product / Service
Eureka Forbes Ltd. - Key offerings
SWOT

15.8 Havells India Ltd.

Havells India Ltd. - Overview
Havells India Ltd. - Business segments
Havells India Ltd. - Key offerings
Havells India Ltd. - Segment focus
SWOT

15.9 Honeywell International Inc.

Honeywell International Inc. - Overview
Honeywell International Inc. - Business segments
Honeywell International Inc. - Key news
Honeywell International Inc. - Key offerings
Honeywell International Inc. - Segment focus
SWOT

15.10 Koninklijke Philips NV

Koninklijke Philips NV - Overview
Koninklijke Philips NV - Business segments
Koninklijke Philips NV - Key news
Koninklijke Philips NV - Key offerings
Koninklijke Philips NV - Segment focus
SWOT

15.11 LG Electronics Inc.

LG Electronics Inc. - Overview
LG Electronics Inc. - Business segments
LG Electronics Inc. - Key news
LG Electronics Inc. - Key offerings
LG Electronics Inc. - Segment focus
SWOT

15.12 Panasonic Holdings Corp.

Panasonic Holdings Corp. - Overview
Panasonic Holdings Corp. - Business segments
Panasonic Holdings Corp. - Key news
Panasonic Holdings Corp. - Key offerings
Panasonic Holdings Corp. - Segment focus
SWOT

15.13 Pentair Plc

Pentair Plc - Overview
Pentair Plc - Business segments
Pentair Plc - Key news
Pentair Plc - Key offerings
Pentair Plc - Segment focus
SWOT

15.14 Solventum Corp.

Solventum Corp. - Overview
Solventum Corp. - Product / Service
Solventum Corp. - Key offerings
SWOT

15.15 Waterlogic Holdings Ltd.

Waterlogic Holdings Ltd. - Overview
Waterlogic Holdings Ltd. - Product / Service
Waterlogic Holdings Ltd. - Key offerings
SWOT

15.16 Watts Water Technologies Inc.

Watts Water Technologies Inc. - Overview
Watts Water Technologies Inc. - Product / Service
Watts Water Technologies Inc. - Key news
Watts Water Technologies Inc. - Key offerings
SWOT

15.17 Whirlpool Corp.

Whirlpool Corp. - Overview
Whirlpool Corp. - Business segments
Whirlpool Corp. - Key news
Whirlpool Corp. - Key offerings
Whirlpool Corp. - Segment focus
SWOT

15.18 Xiaomi Corp.

Xiaomi Corp. - Overview
Xiaomi Corp. - Business segments
Xiaomi Corp. - Key offerings
Xiaomi Corp. - Segment focus
SWOT

16. Appendix

16.1 Scope of the report

Market definition
Objectives
Notes and caveats

16.2 Inclusions and exclusions checklist

Inclusions checklist
Exclusions checklist

16.3 Currency conversion rates for US$

16.4 Research methodology

16.5 Data procurement

Information sources

16.6 Data validation

16.7 Validation techniques employed for market sizing

16.8 Data synthesis

16.9 360 degree market analysis

16.10 List of abbreviations

Research Methodology

Technavio presents a detailed picture of the market by way of study, synthesis, and summation of data from multiple sources. The analysts have presented the various facets of the market with a particular focus on identifying the key industry influencers. The data thus presented is comprehensive, reliable, and the result of extensive research, both primary and secondary.

INFORMATION SOURCES

Primary sources

  • Manufacturers and suppliers
  • Channel partners
  • Industry experts
  • Strategic decision makers

Secondary sources

  • Industry journals and periodicals
  • Government data
  • Financial reports of key industry players
  • Historical data
  • Press releases

DATA ANALYSIS

Data Synthesis

  • Collation of data
  • Estimation of key figures
  • Analysis of derived insights

Data Validation

  • Triangulation with data models
  • Reference against proprietary databases
  • Corroboration with industry experts

REPORT WRITING

Qualitative

  • Market drivers
  • Market challenges
  • Market trends
  • Five forces analysis

Quantitative

  • Market size and forecast
  • Market segmentation
  • Geographical insights
  • Competitive landscape

Interested in this report?

Get your sample now to see our research methodology and insights!

Download Now

Frequently Asked Questions

Residential Drinking Water Treatment Equipment market growth will increase by USD 6134.0 million during 2026-2030.

The Residential Drinking Water Treatment Equipment market is expected to grow at a CAGR of 7.3% during 2026-2030.

Residential Drinking Water Treatment Equipment market is segmented by Distribution channel (Dealers and distributors, Mass merchandiser, Online) Technology (Reverse osmosis, Activated carbon filters, Ultraviolet light, Others) End-user (Individual housing, Multi-family apartments)

A. O. Smith Corp., Amway Corp., BRITA SE, Culligan International Co., EcoWater Systems LLC, Eureka Forbes Ltd., Havells India Ltd., Honeywell International Inc., Katadyn Products Inc., KENT RO Systems Ltd., Kinetico Inc., Koninklijke Philips NV, LG Electronics Inc., Panasonic Holdings Corp., Pentair Plc, Solventum Corp., Waterlogic Holdings Ltd., Watts Water Technologies Inc., Whirlpool Corp., Xiaomi Corp. are a few of the key vendors in the Residential Drinking Water Treatment Equipment market.

APAC will register the highest growth rate of 37.9% among the other regions. Therefore, the Residential Drinking Water Treatment Equipment market in APAC is expected to garner significant business opportunities for the vendors during the forecast period.

China, Japan, India, South Korea, Australia, Indonesia, US, Canada, Mexico, Germany, UK, France, Italy, Spain, The Netherlands, Brazil, Argentina, Chile, Saudi Arabia, UAE, South Africa, Turkey, Israel

  • Growing heightened awareness of drinking water contaminants is the driving factor this market.

The Residential Drinking Water Treatment Equipment market vendors should focus on grabbing business opportunities from the Distribution channel segment as it accounted for the largest market share in the base year.
RIA - Research AI Assistant
Ask RIA
