
Retirement Communities Market Analysis, Size, and Forecast 2026-2030: North America (US, Canada, and Mexico), Europe (Germany, UK, and France), APAC (China, Japan, and India), South America (Brazil, Argentina, and Chile), Middle East and Africa (Saudi Arabia, UAE, and South Africa), and Rest of World (ROW)

Retirement Communities Market Analysis, Size, and Forecast 2026-2030:
North America (US, Canada, and Mexico), Europe (Germany, UK, and France), APAC (China, Japan, and India), South America (Brazil, Argentina, and Chile), Middle East and Africa (Saudi Arabia, UAE, and South Africa), and Rest of World (ROW)

Published: Oct 2026 289 Pages SKU: IRTNTR70807

Market Overview at a Glance

$48.65 B
Market Opportunity
4.8%
CAGR 2025 - 2030
39%
North America Growth
$118.17 B
Assisted living facilities segment 2024

Retirement Communities Market Size 2026-2030

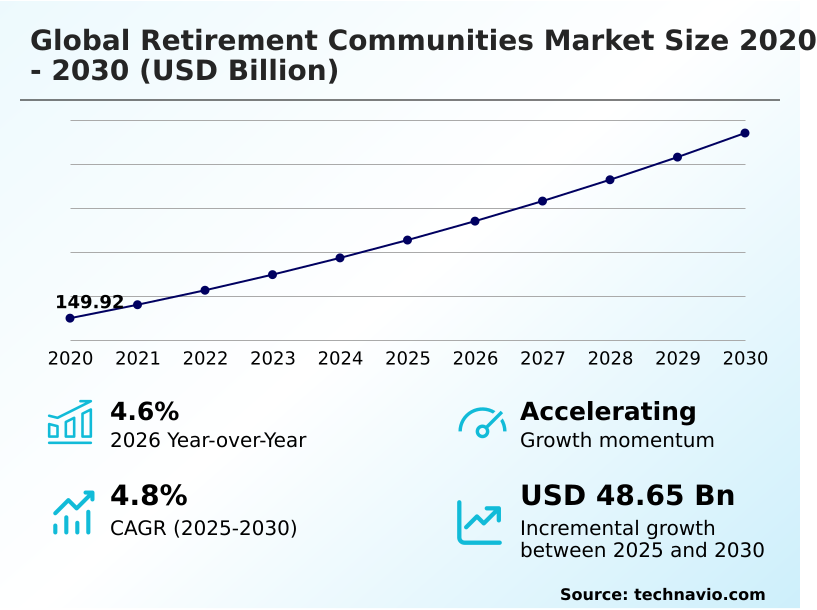
The retirement communities market size is valued to increase by USD 48.65 billion, at a CAGR of 4.8% from 2025 to 2030. Longevity shifts and proliferation of nuclear households will drive the retirement communities market.

Major Market Trends & Insights

  • North America dominated the market and accounted for a 39% growth during the forecast period.
  • By Type - Assisted living facilities segment was valued at USD 118.17 billion in 2024
  • By Application - Elderly people segment accounted for the largest market revenue share in 2024

Market Size & Forecast

  • Market Opportunities: USD 84.16 billion
  • Market Future Opportunities: USD 48.65 billion
  • CAGR from 2025 to 2030 : 4.8%

Market Summary

  • The Retirement Communities Market exhibits robust structural expansion as shifting demographics and extended human longevity radically redefine long term residential care requirements. Prolonged life expectancies and the fragmentation of traditional multigenerational households propel immense demand for specialized senior living infrastructure.
  • To adapt to these demographic pressures, facility administrators are fundamentally overhauling their supply chain and operational models, such as standardizing bulk procurement for medical equipment and consolidating outsourced culinary services. This strategic optimization has allowed premium operators to achieve a 14% improvement in supply chain cost efficiency compared to localized purchasing models.
  • Despite these operational advancements, severe shortages of qualified clinical personnel and inflating wage structures challenge sector profitability, forcing facilities to rely heavily on expensive third party staffing agencies. By integrating ambient intelligence and automated monitoring systems, operators attempt to mitigate these labor constraints, redirecting human capital toward high acuity interventions.
  • Ultimately, the convergence of robust consumer demand for active adult campuses and the necessity for technological modernization dictates continuous capital deployment across the global eldercare landscape.

What will be the Size of the Retirement Communities Market during the forecast period?
Get Key Insights on Market Forecast (PDF) Get Free Sample

How is the Retirement Communities Market Segmented?

The retirement communities industry research report provides comprehensive data (region-wise segment analysis), with forecasts and estimates in "USD million" for the period 2026-2030, as well as historical data from 2020-2024 for the following segments.

  • Type
    • Assisted living facilities
    • Continuing care
    • Rest homes
  • Application
    • Elderly people
    • Disabled people
  • Gender
    • Female
    • Male
  • Geography
    • North America
      • US
      • Canada
      • Mexico
    • Europe
      • Germany
      • UK
      • France
      • Italy
      • Spain
      • The Netherlands
    • APAC
      • China
      • Japan
      • India
      • South Korea
      • Australia
      • Indonesia
    • South America
      • Brazil
      • Argentina
      • Chile
    • Middle East and Africa
      • Saudi Arabia
      • UAE
      • South Africa
      • Israel
      • Turkey

By Type Insights

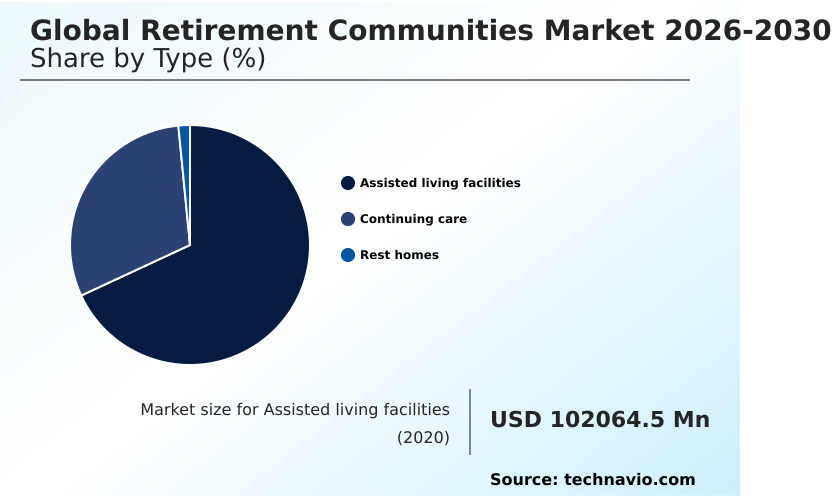
The assisted living facilities segment is estimated to witness significant growth during the forecast period.

The assisted living facilities segment establishes a dominant structural framework within the Retirement Communities by blending continuous residential independence with proactive health oversight.

Administrators increasingly utilize autonomous operational functions and automated medication dispensing systems, which reduce administrative overhead while facilitating individualized clinical care.

This structural shift is largely propelled by the escalating prevalence of progressive cognitive impairments among aging demographics, driving demand for specialized mobility support and evidence based therapeutic programs.

By integrating high ratio nursing supervision alongside targeted cognitive retention programs, facility operators improve resident safety metrics significantly, with error detection improved by 15% across modernized campuses.

Such operational efficiency gains justify sustained capital allocation toward purpose built housing supply, ensuring optimal resource utilization and superior service delivery for vulnerable residents without sacrificing their personal autonomy.
Get Free Sample

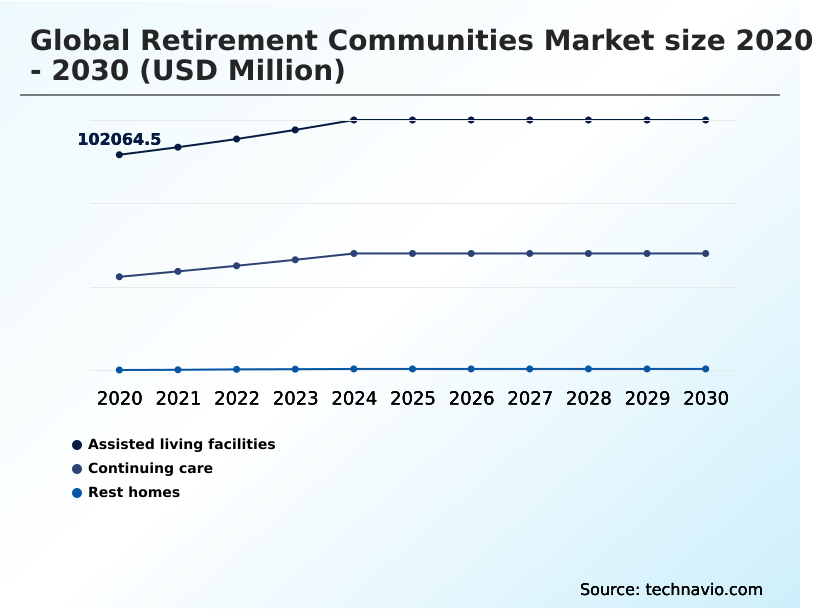
The Assisted living facilities segment was valued at USD 118.17 billion in 2024 and showed a gradual increase during the forecast period.
Get Free Sample

Regional Analysis

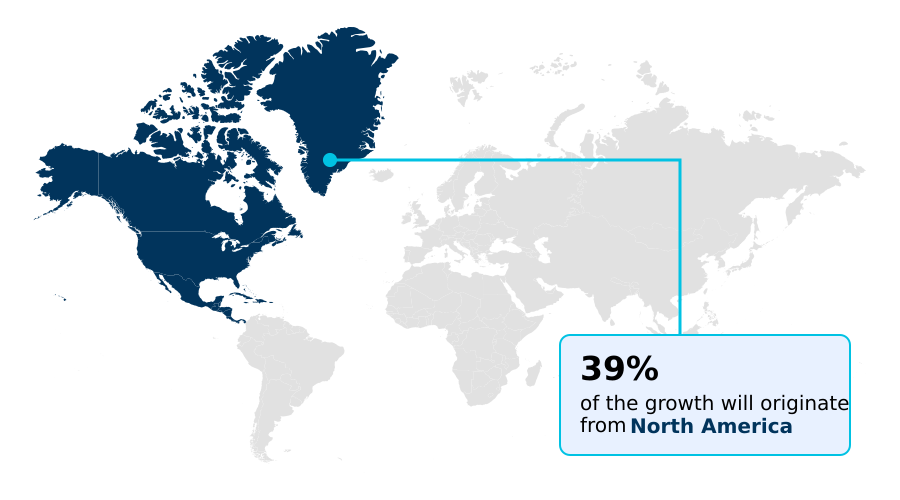
North America is estimated to contribute 39% to the growth of the global market during the forecast period.Technavio’s analysts have elaborately explained the regional trends and drivers that shape the market during the forecast period.
See How Retirement Communities Market Demand is Rising in North America Get Free Sample

The geographic distribution of the Retirement Communities highlights distinct adoption disparities between mature and emerging regions.

North America dominates by rapidly integrating digital healthcare ecosystems and behavioral monitoring technologies, resulting in a 25% higher market penetration for premium life plan campuses compared to Europe.

Facilities in the United States and Canada leverage integrated telehealth connectivity and customized wheelchair accessibility to deliver highly customized clinical care, reducing hospital readmission rates by 18%.

Conversely, European markets prioritize ecological integration, enforcing strict net zero building standards and incorporating biophilic design principles into new developments. The multi tiered housing continuum in Europe increasingly focuses on preventive wellness regimens to delay high acuity interventions.

Large operators managing multi jurisdictional portfolios apply these regional best practices universally, standardizing care protocols to optimize operational overhead and maintain high occupancy levels across diverse international markets.

Market Dynamics

Our researchers analyzed the data with 2025 as the base year, along with the key drivers, trends, and challenges. A holistic analysis of drivers will help companies refine their marketing strategies to gain a competitive advantage.

  • The commercial architecture of the Retirement Communities is undergoing a profound transformation driven by both clinical necessity and lifestyle preferences. Operators are heavily investing in multi tiered housing for aging populations to minimize resident displacement and streamline continuing care retirement community transitions.
  • To address escalating operational costs, facilities are shifting away from rigid contract structures and implementing unbundled service pricing in senior living, offering customized financial flexibility. This strategic transition aligns with the deployment of smart home automation for seniors and remote health monitoring for active adults, enabling greater independence while reducing baseline staffing requirements.
  • In high acuity sectors, the integration of biometric tracking in assisted living and fall prevention algorithms in residences has improved incident response efficacy by roughly thirty percent compared to legacy manual observation methods. Consequently, operators install unobtrusive sensor arrays in eldercare and automated emergency alerts in care facilities to ensure continuous safety.
  • Specialized developments increasingly mandate neuro inclusive design in memory care alongside structured cognitive rehabilitation for memory care to support residents facing progressive cognitive decline, delivering evidence based therapeutic care for seniors. Simultaneously, operators are targeting institutional ESG benchmarks by constructing net zero emission retirement facilities and integrating biophilic design in senior living spaces to optimize indoor environmental quality.
  • Furthermore, the adoption of automated medication dispensing in nursing homes guarantees clinical precision, reinforcing operational compliance across an increasingly complex regulatory landscape.
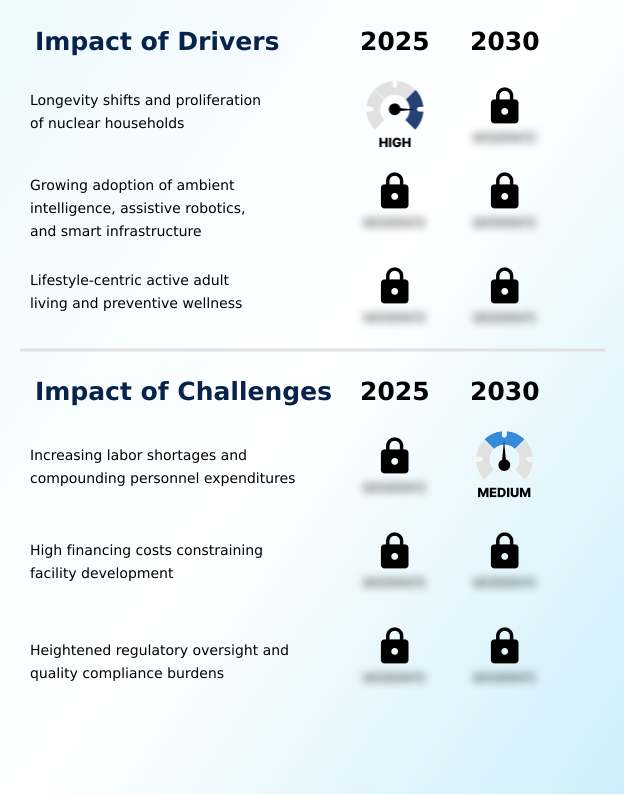
What are the key market drivers leading to the rise in the adoption of Retirement Communities Industry?

  • Demographic shifts toward extended longevity, coupled with the rapid proliferation of nuclear households, function as the primary catalysts accelerating demand for structured residential care.

  • The exponential expansion of active adult campuses is fundamentally driven by a surging consumer preference for holistic wellness programming over traditional institutionalization.
  • To accommodate this demand, developers are outfitting residential units with automated domestic controls and unobtrusive ambient sensor arrays that trigger automated emergency alerts without compromising privacy.
  • This technological overlay allows facilities to reduce routine monitoring costs by 19% while effortlessly exceeding stringent clinical staffing requirements. Simultaneously, the rising incidence of dementia propels immense capital into purpose built memory care facilities offering structured cognitive rehabilitation.
  • To maintain robust operating margins amid these upgrades, operators introduce unbundled service menus and enforce strict environmental sustainability protocols, ensuring that long term care remains both economically viable and ecologically responsible for incoming aging populations.

What are the market trends shaping the Retirement Communities Industry?

  • The escalation of chronic acuity levels alongside the expansion of specialized cognitive care represents a significant emerging trend shaping the industry. This structural shift compels facility operators to integrate advanced medical oversight seamlessly into residential environments.

  • The integration of ambient intelligence architecture represents a massive behavioral shift within the Retirement Communities, transitioning traditional housing into highly responsive care environments. Facility operators are aggressively deploying assistive robotics integration and predictive health analytics to address severe labor bottlenecks while maintaining continuous clinical oversight.
  • This modernization includes the adoption of a unified resident wellness platform and smart home automation, which collectively improve predictive response efficiency by 28%. Because incoming cohorts demand environments tailored to specialized physical requirements without sacrificing autonomy, developers are engineering spaces with neuro inclusive architectural design.
  • By adopting flexible rental arrangements, administrators lower financial barriers to entry, accelerating the absorption of a decentralized eldercare infrastructure and aligning capital intensive real estate with the customized lifestyle preferences of modern retirees.

What challenges does the Retirement Communities Industry face during its growth?

  • Persistent skilled labor shortages and exponentially compounding personnel expenditures create formidable structural barriers that severely constrain operational scalability across the care continuum.

  • Escalating infrastructure costs and severe workforce attrition create formidable operational barriers within the Retirement Communities. Designing specialized residential environments necessitates heavy capital investments in universal design principles and advanced technologies like circadian illumination systems to manage resident well being.
  • Implementing essential smart environmental monitoring, biometric health tracking, and non contact vital sign monitors places immense financial strain on mid sized operators. Furthermore, standardizing fall prevention algorithms and remote health monitoring protocols requires continuous staff training, increasing onboarding expenses by roughly 22%. Integrating complex palliative care methodologies alongside non pharmacological cognitive retention programs further stretches already constrained clinical resources.
  • Consequently, operators struggle to balance the high capital expenditures required for modern technological infrastructure with the mandate to deliver affordable, high quality continuous care.

Exclusive Technavio Analysis on Customer Landscape

The retirement communities market forecasting report includes the adoption lifecycle of the market, covering from the innovator’s stage to the laggard’s stage. It focuses on adoption rates in different regions based on penetration. Furthermore, the retirement communities market report also includes key purchase criteria and drivers of price sensitivity to help companies evaluate and develop their market growth analysis strategies.
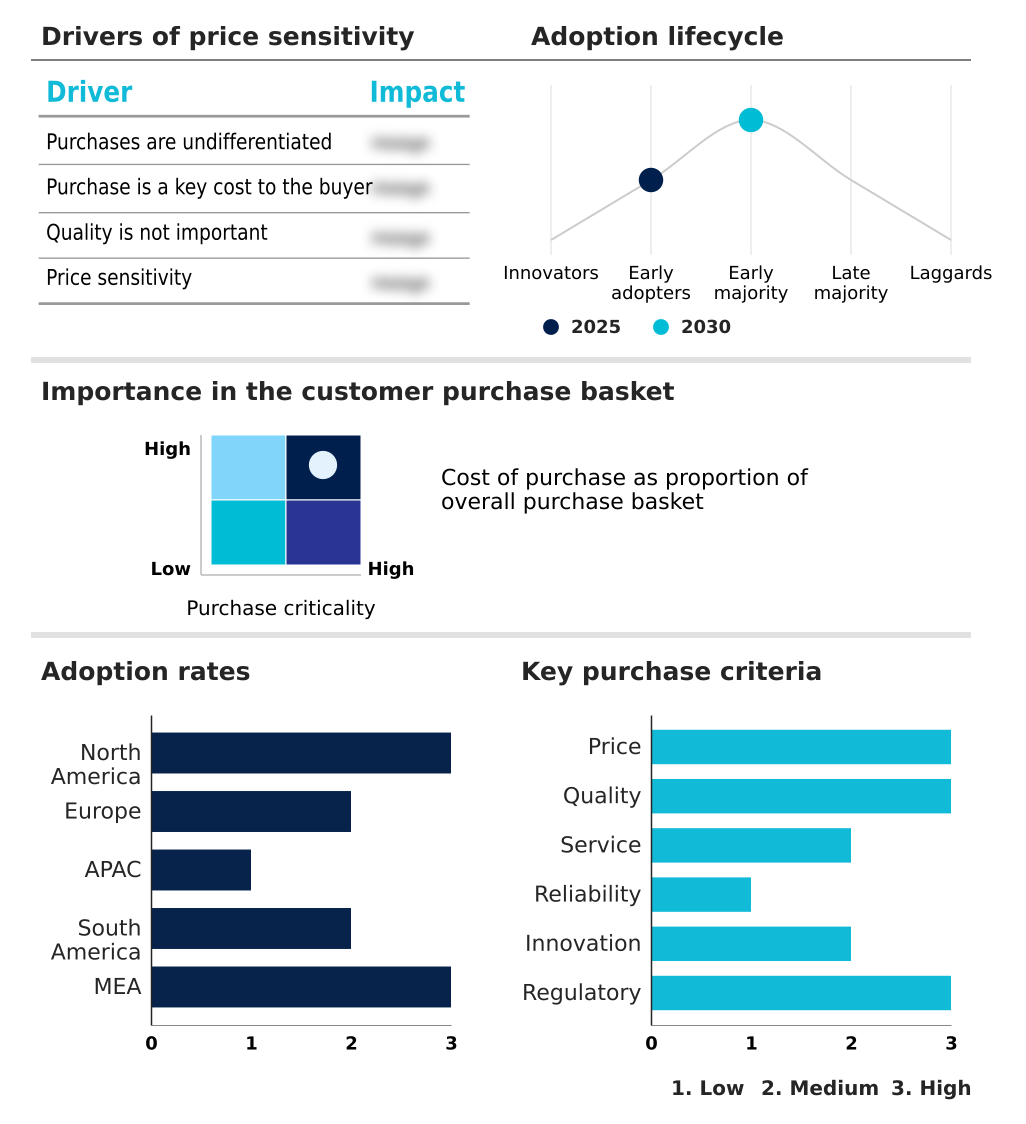
Customer Landscape of Retirement Communities Industry

Competitive Landscape

Companies are implementing various strategies, such as strategic alliances, retirement communities market forecast, partnerships, mergers and acquisitions, geographical expansion, and product/service launches, to enhance their presence in the industry.

Affinity Living Communities - The vendor delivers comprehensive retirement communities, encompassing independent living, assisted living, memory care, and personalized residential services tailored to support active aging and continuous medical requirements.

The industry research and growth report includes detailed analyses of the competitive landscape of the market and information about key companies, including:

  • Affinity Living Communities
  • Atria Senior Living Inc.
  • Belmont Village Senior Living
  • Brookdale Senior Living Inc.
  • Bupa Group
  • Erickson Senior Living Management
  • Frontier Senior Living
  • Grace Management Inc.
  • HC One Ltd.
  • Integrated Senior Lifestyles
  • Juniper Communities
  • Legend Senior Living
  • Leisure Care
  • Merrill Gardens
  • Senior Lifestyle Corp.
  • Sienna Senior Living Inc.
  • StoryPoint Group
  • Sunrise Senior Living LLC
  • Village Concepts
  • Watermark Retirement Communities

Qualitative and quantitative analysis of companies has been conducted to help clients understand the wider business environment as well as the strengths and weaknesses of key industry players. Data is qualitatively analyzed to categorize companies as pure play, category-focused, industry-focused, and diversified; it is quantitatively analyzed to categorize companies as dominant, leading, strong, tentative, and weak.

Recent Development and News in Retirement communities market

  • In the Diversified Support Services industry, the accelerated adoption of internet of things predictive maintenance software has revolutionized facility management, directly impacting Retirement Communities demand by reducing unplanned HVAC and elevator downtimes by up to twenty percent.
  • The implementation of stringent commercial cleaning and sterilization mandates by health regulatory bodies has forced support service providers to utilize hospital grade disinfectants, thereby elevating the operational baseline and safety standards required within long term care residences.
  • Chronic labor shortages across outsourced food and catering supply chains have prompted heavy investments in automated culinary distribution systems, which enables community dining operators to maintain high volume meal services without proportional increases in wage expenditures.
  • The shift toward sustainable waste management and digital administration in outsourced corporate services has created a unified standard for vendor compliance, compelling residential care administrators to prioritize eco friendly service partners to meet institutional environmental targets.

Dive into Technavio’s robust research methodology, blending expert interviews, extensive data synthesis, and validated models for unparalleled Retirement Communities Market insights. See full methodology.

Market Scope
Page number 289
Base year 2025
Historic period 2020-2024
Forecast period 2026-2030
Growth momentum & CAGR Accelerate at a CAGR of 4.8%
Market growth 2026-2030 USD 48648.8 million
Market structure Fragmented
YoY growth 2025-2026(%) 4.6%
Key countries US, Canada, Mexico, Germany, UK, France, Italy, Spain, The Netherlands, China, Japan, India, South Korea, Australia, Indonesia, Brazil, Argentina, Chile, Saudi Arabia, UAE, South Africa, Israel and Turkey
Competitive landscape Leading Companies, Market Positioning of Companies, Competitive Strategies, and Industry Risks

Request Free Sample

Research Analyst Overview

  • The fundamental restructuring of the Retirement Communities is accelerating as institutional operators pivot toward highly integrated, technology driven care environments. Executive boards are increasingly prioritizing the deployment of ambient intelligence architecture and predictive health analytics to optimize baseline operational expenditures and mitigate chronic workforce shortages.
  • This technological integration directly informs capital allocation, shifting budgets toward assistive robotics integration that automates routine facility maintenance. As a result of these strategic investments, premium active adult campuses have achieved a 24% reduction in manual administrative workloads, allowing personnel to concentrate on continuous clinical oversight.
  • Furthermore, the development of purpose built memory care units equipped with automated emergency alerts has become a critical product strategy for developers seeking to address the intensifying acuity levels of incoming residents.
  • By aligning facility architecture with advanced digital monitoring frameworks, organizations ensure robust regulatory compliance while simultaneously elevating the standard of residential safety and extending the duration of independent living.

What are the Key Data Covered in this Retirement Communities Market Research and Growth Report?

  • What is the expected growth of the Retirement Communities Market between 2026 and 2030?

    • USD 48.65 billion, at a CAGR of 4.8%

  • What segmentation does the market report cover?

    • The report is segmented by Type (Assisted living facilities, Continuing care, and Rest homes), Application (Elderly people, and Disabled people), Gender (Female, and Male) and Geography (North America, Europe, APAC, South America, Middle East and Africa)

  • Which regions are analyzed in the report?

    • North America, Europe, APAC, South America and Middle East and Africa

  • What are the key growth drivers and market challenges?

    • Longevity shifts and proliferation of nuclear households, Increasing labor shortages and compounding personnel expenditures

  • Who are the major players in the Retirement Communities Market?

    • Affinity Living Communities, Atria Senior Living Inc., Belmont Village Senior Living, Brookdale Senior Living Inc., Bupa Group, Erickson Senior Living Management, Frontier Senior Living, Grace Management Inc., HC One Ltd., Integrated Senior Lifestyles, Juniper Communities, Legend Senior Living, Leisure Care, Merrill Gardens, Senior Lifestyle Corp., Sienna Senior Living Inc., StoryPoint Group, Sunrise Senior Living LLC, Village Concepts and Watermark Retirement Communities

Market Research Insights

  • The structural evolution of the Retirement Communities relies heavily on the rapid deployment of a decentralized eldercare infrastructure. To remain competitive, operators are adopting comprehensive environmental sustainability protocols that lower utility overhead by 12% annually. Simultaneously, the integration of smart home automation and a centralized resident wellness platform has improved emergency response times by 22%, elevating overall safety standards.
  • Facilities providing unbundled service menus observe a 15% increase in resident retention, as older adults value the flexibility to customize their expenditures. These calculated operational upgrades directly optimize resource allocation, reduce energy consumption, and align residential offerings with the precise financial and medical preferences of incoming senior demographics.

We can help! Our analysts can customize this retirement communities market research report to meet your requirements.

Get in touch

1. Executive Summary

1.1 Market overview

Executive Summary - Chart on Market Overview
Executive Summary - Data Table on Market Overview
Executive Summary - Chart on Global Market Characteristics
Executive Summary - Chart on Market by Geography
Executive Summary - Chart on Market Segmentation by Type
Executive Summary - Chart on Market Segmentation by Application
Executive Summary - Chart on Market Segmentation by Gender
Executive Summary - Chart on Incremental Growth
Executive Summary - Data Table on Incremental Growth
Executive Summary - Chart on Company Market Positioning

2. Technavio Analysis

2.1 Analysis of price sensitivity, lifecycle, customer purchase basket, adoption rates, and purchase criteria

2.2 Criticality of inputs and Factors of differentiation

Chart on Overview on criticality of inputs and factors of differentiation

2.3 Factors of disruption

Chart on Overview on factors of disruption

2.4 Impact of drivers and challenges

Chart on Impact of drivers and challenges in 2025 and 2030

3. Market Landscape

3.1 Market ecosystem

Chart on Parent Market
Data Table on - Parent Market

3.2 Market characteristics

Chart on Market characteristics analysis

3.3 Value chain analysis

Chart on Value chain analysis

4. Market Sizing

4.1 Market definition

Data Table on Offerings of companies included in the market definition

4.2 Market segment analysis

Market segments

4.3 Market size 2025

4.4 Market outlook: Forecast for 2025-2030

Chart on Global - Market size and forecast 2025-2030 ($ million)
Data Table on Global - Market size and forecast 2025-2030 ($ million)
Chart on Global Market: Year-over-year growth 2025-2030 (%)
Data Table on Global Market: Year-over-year growth 2025-2030 (%)

5. Historic Market Size

5.1 Global Retirement Communities Market 2020 - 2024

Historic Market Size - Data Table on Global Retirement Communities Market 2020 - 2024 ($ million)

5.2 Type segment analysis 2020 - 2024

Historic Market Size - Type Segment 2020 - 2024 ($ million)

5.3 Application segment analysis 2020 - 2024

Historic Market Size - Application Segment 2020 - 2024 ($ million)

5.4 Gender segment analysis 2020 - 2024

Historic Market Size - Gender Segment 2020 - 2024 ($ million)

5.5 Geography segment analysis 2020 - 2024

Historic Market Size - Geography Segment 2020 - 2024 ($ million)

5.6 Country segment analysis 2020 - 2024

Historic Market Size - Country Segment 2020 - 2024 ($ million)

6. Qualitative Analysis

6.1 Impact of AI on Global Retirement Communities Market

6.2 Impact of Geopolitical Conflicts on Global Retirement Communities Market

7. Five Forces Analysis

7.1 Five forces summary

Five forces analysis - Comparison between 2025 and 2030

7.2 Bargaining power of buyers

Bargaining power of buyers - Impact of key factors 2025 and 2030

7.3 Bargaining power of suppliers

Bargaining power of suppliers - Impact of key factors in 2025 and 2030

7.4 Threat of new entrants

Threat of new entrants - Impact of key factors in 2025 and 2030

7.5 Threat of substitutes

Threat of substitutes - Impact of key factors in 2025 and 2030

7.6 Threat of rivalry

Threat of rivalry - Impact of key factors in 2025 and 2030

7.7 Market condition

Chart on Market condition - Five forces 2025 and 2030

8. Market Segmentation by Type

8.1 Market segments

Chart on Type - Market share 2025-2030 (%)
Data Table on Type - Market share 2025-2030 (%)

8.2 Comparison by Type

Chart on Comparison by Type
Data Table on Comparison by Type

8.3 Assisted living facilities - Market size and forecast 2025-2030

Chart on Assisted living facilities - Market size and forecast 2025-2030 ($ million)
Data Table on Assisted living facilities - Market size and forecast 2025-2030 ($ million)
Chart on Assisted living facilities - Year-over-year growth 2025-2030 (%)
Data Table on Assisted living facilities - Year-over-year growth 2025-2030 (%)

8.4 Continuing care - Market size and forecast 2025-2030

Chart on Continuing care - Market size and forecast 2025-2030 ($ million)
Data Table on Continuing care - Market size and forecast 2025-2030 ($ million)
Chart on Continuing care - Year-over-year growth 2025-2030 (%)
Data Table on Continuing care - Year-over-year growth 2025-2030 (%)

8.5 Rest homes - Market size and forecast 2025-2030

Chart on Rest homes - Market size and forecast 2025-2030 ($ million)
Data Table on Rest homes - Market size and forecast 2025-2030 ($ million)
Chart on Rest homes - Year-over-year growth 2025-2030 (%)
Data Table on Rest homes - Year-over-year growth 2025-2030 (%)

8.6 Market opportunity by Type

Market opportunity by Type ($ million)
Data Table on Market opportunity by Type ($ million)

9. Market Segmentation by Application

9.1 Market segments

Chart on Application - Market share 2025-2030 (%)
Data Table on Application - Market share 2025-2030 (%)

9.2 Comparison by Application

Chart on Comparison by Application
Data Table on Comparison by Application

9.3 Elderly people - Market size and forecast 2025-2030

Chart on Elderly people - Market size and forecast 2025-2030 ($ million)
Data Table on Elderly people - Market size and forecast 2025-2030 ($ million)
Chart on Elderly people - Year-over-year growth 2025-2030 (%)
Data Table on Elderly people - Year-over-year growth 2025-2030 (%)

9.4 Disabled people - Market size and forecast 2025-2030

Chart on Disabled people - Market size and forecast 2025-2030 ($ million)
Data Table on Disabled people - Market size and forecast 2025-2030 ($ million)
Chart on Disabled people - Year-over-year growth 2025-2030 (%)
Data Table on Disabled people - Year-over-year growth 2025-2030 (%)

9.5 Market opportunity by Application

Market opportunity by Application ($ million)
Data Table on Market opportunity by Application ($ million)

10. Market Segmentation by Gender

10.1 Market segments

Chart on Gender - Market share 2025-2030 (%)
Data Table on Gender - Market share 2025-2030 (%)

10.2 Comparison by Gender

Chart on Comparison by Gender
Data Table on Comparison by Gender

10.3 Female - Market size and forecast 2025-2030

Chart on Female - Market size and forecast 2025-2030 ($ million)
Data Table on Female - Market size and forecast 2025-2030 ($ million)
Chart on Female - Year-over-year growth 2025-2030 (%)
Data Table on Female - Year-over-year growth 2025-2030 (%)

10.4 Male - Market size and forecast 2025-2030

Chart on Male - Market size and forecast 2025-2030 ($ million)
Data Table on Male - Market size and forecast 2025-2030 ($ million)
Chart on Male - Year-over-year growth 2025-2030 (%)
Data Table on Male - Year-over-year growth 2025-2030 (%)

10.5 Market opportunity by Gender

Market opportunity by Gender ($ million)
Data Table on Market opportunity by Gender ($ million)

11. Customer Landscape

11.1 Customer landscape overview

Analysis of price sensitivity, lifecycle, customer purchase basket, adoption rates, and purchase criteria

12. Geographic Landscape

12.1 Geographic segmentation

Chart on Market share by geography 2025-2030 (%)
Data Table on Market share by geography 2025-2030 (%)

12.2 Geographic comparison

Chart on Geographic comparison
Data Table on Geographic comparison

12.3 North America - Market size and forecast 2025-2030

Chart on North America - Market size and forecast 2025-2030 ($ million)
Data Table on North America - Market size and forecast 2025-2030 ($ million)
Chart on North America - Year-over-year growth 2025-2030 (%)
Data Table on North America - Year-over-year growth 2025-2030 (%)
Chart on Regional Comparison - North America
Data Table on Regional Comparison - North America

12.3.1 US - Market size and forecast 2025-2030

Chart on US - Market size and forecast 2025-2030 ($ million)
Data Table on US - Market size and forecast 2025-2030 ($ million)
Chart on US - Year-over-year growth 2025-2030 (%)
Data Table on US - Year-over-year growth 2025-2030 (%)

12.3.2 Canada - Market size and forecast 2025-2030

Chart on Canada - Market size and forecast 2025-2030 ($ million)
Data Table on Canada - Market size and forecast 2025-2030 ($ million)
Chart on Canada - Year-over-year growth 2025-2030 (%)
Data Table on Canada - Year-over-year growth 2025-2030 (%)

12.3.3 Mexico - Market size and forecast 2025-2030

Chart on Mexico - Market size and forecast 2025-2030 ($ million)
Data Table on Mexico - Market size and forecast 2025-2030 ($ million)
Chart on Mexico - Year-over-year growth 2025-2030 (%)
Data Table on Mexico - Year-over-year growth 2025-2030 (%)

12.4 Europe - Market size and forecast 2025-2030

Chart on Europe - Market size and forecast 2025-2030 ($ million)
Data Table on Europe - Market size and forecast 2025-2030 ($ million)
Chart on Europe - Year-over-year growth 2025-2030 (%)
Data Table on Europe - Year-over-year growth 2025-2030 (%)
Chart on Regional Comparison - Europe
Data Table on Regional Comparison - Europe

12.4.1 Germany - Market size and forecast 2025-2030

Chart on Germany - Market size and forecast 2025-2030 ($ million)
Data Table on Germany - Market size and forecast 2025-2030 ($ million)
Chart on Germany - Year-over-year growth 2025-2030 (%)
Data Table on Germany - Year-over-year growth 2025-2030 (%)

12.4.2 UK - Market size and forecast 2025-2030

Chart on UK - Market size and forecast 2025-2030 ($ million)
Data Table on UK - Market size and forecast 2025-2030 ($ million)
Chart on UK - Year-over-year growth 2025-2030 (%)
Data Table on UK - Year-over-year growth 2025-2030 (%)

12.4.3 France - Market size and forecast 2025-2030

Chart on France - Market size and forecast 2025-2030 ($ million)
Data Table on France - Market size and forecast 2025-2030 ($ million)
Chart on France - Year-over-year growth 2025-2030 (%)
Data Table on France - Year-over-year growth 2025-2030 (%)

12.4.4 Italy - Market size and forecast 2025-2030

Chart on Italy - Market size and forecast 2025-2030 ($ million)
Data Table on Italy - Market size and forecast 2025-2030 ($ million)
Chart on Italy - Year-over-year growth 2025-2030 (%)
Data Table on Italy - Year-over-year growth 2025-2030 (%)

12.4.5 Spain - Market size and forecast 2025-2030

Chart on Spain - Market size and forecast 2025-2030 ($ million)
Data Table on Spain - Market size and forecast 2025-2030 ($ million)
Chart on Spain - Year-over-year growth 2025-2030 (%)
Data Table on Spain - Year-over-year growth 2025-2030 (%)

12.4.6 The Netherlands - Market size and forecast 2025-2030

Chart on The Netherlands - Market size and forecast 2025-2030 ($ million)
Data Table on The Netherlands - Market size and forecast 2025-2030 ($ million)
Chart on The Netherlands - Year-over-year growth 2025-2030 (%)
Data Table on The Netherlands - Year-over-year growth 2025-2030 (%)

12.5 APAC - Market size and forecast 2025-2030

Chart on APAC - Market size and forecast 2025-2030 ($ million)
Data Table on APAC - Market size and forecast 2025-2030 ($ million)
Chart on APAC - Year-over-year growth 2025-2030 (%)
Data Table on APAC - Year-over-year growth 2025-2030 (%)
Chart on Regional Comparison - APAC
Data Table on Regional Comparison - APAC

12.5.1 China - Market size and forecast 2025-2030

Chart on China - Market size and forecast 2025-2030 ($ million)
Data Table on China - Market size and forecast 2025-2030 ($ million)
Chart on China - Year-over-year growth 2025-2030 (%)
Data Table on China - Year-over-year growth 2025-2030 (%)

12.5.2 Japan - Market size and forecast 2025-2030

Chart on Japan - Market size and forecast 2025-2030 ($ million)
Data Table on Japan - Market size and forecast 2025-2030 ($ million)
Chart on Japan - Year-over-year growth 2025-2030 (%)
Data Table on Japan - Year-over-year growth 2025-2030 (%)

12.5.3 India - Market size and forecast 2025-2030

Chart on India - Market size and forecast 2025-2030 ($ million)
Data Table on India - Market size and forecast 2025-2030 ($ million)
Chart on India - Year-over-year growth 2025-2030 (%)
Data Table on India - Year-over-year growth 2025-2030 (%)

12.5.4 South Korea - Market size and forecast 2025-2030

Chart on South Korea - Market size and forecast 2025-2030 ($ million)
Data Table on South Korea - Market size and forecast 2025-2030 ($ million)
Chart on South Korea - Year-over-year growth 2025-2030 (%)
Data Table on South Korea - Year-over-year growth 2025-2030 (%)

12.5.5 Australia - Market size and forecast 2025-2030

Chart on Australia - Market size and forecast 2025-2030 ($ million)
Data Table on Australia - Market size and forecast 2025-2030 ($ million)
Chart on Australia - Year-over-year growth 2025-2030 (%)
Data Table on Australia - Year-over-year growth 2025-2030 (%)

12.5.6 Indonesia - Market size and forecast 2025-2030

Chart on Indonesia - Market size and forecast 2025-2030 ($ million)
Data Table on Indonesia - Market size and forecast 2025-2030 ($ million)
Chart on Indonesia - Year-over-year growth 2025-2030 (%)
Data Table on Indonesia - Year-over-year growth 2025-2030 (%)

12.6 South America - Market size and forecast 2025-2030

Chart on South America - Market size and forecast 2025-2030 ($ million)
Data Table on South America - Market size and forecast 2025-2030 ($ million)
Chart on South America - Year-over-year growth 2025-2030 (%)
Data Table on South America - Year-over-year growth 2025-2030 (%)
Chart on Regional Comparison - South America
Data Table on Regional Comparison - South America

12.6.1 Brazil - Market size and forecast 2025-2030

Chart on Brazil - Market size and forecast 2025-2030 ($ million)
Data Table on Brazil - Market size and forecast 2025-2030 ($ million)
Chart on Brazil - Year-over-year growth 2025-2030 (%)
Data Table on Brazil - Year-over-year growth 2025-2030 (%)

12.6.2 Argentina - Market size and forecast 2025-2030

Chart on Argentina - Market size and forecast 2025-2030 ($ million)
Data Table on Argentina - Market size and forecast 2025-2030 ($ million)
Chart on Argentina - Year-over-year growth 2025-2030 (%)
Data Table on Argentina - Year-over-year growth 2025-2030 (%)

12.6.3 Chile - Market size and forecast 2025-2030

Chart on Chile - Market size and forecast 2025-2030 ($ million)
Data Table on Chile - Market size and forecast 2025-2030 ($ million)
Chart on Chile - Year-over-year growth 2025-2030 (%)
Data Table on Chile - Year-over-year growth 2025-2030 (%)

12.7 Middle East and Africa - Market size and forecast 2025-2030

Chart on Middle East and Africa - Market size and forecast 2025-2030 ($ million)
Data Table on Middle East and Africa - Market size and forecast 2025-2030 ($ million)
Chart on Middle East and Africa - Year-over-year growth 2025-2030 (%)
Data Table on Middle East and Africa - Year-over-year growth 2025-2030 (%)
Chart on Regional Comparison - Middle East and Africa
Data Table on Regional Comparison - Middle East and Africa

12.7.1 Saudi Arabia - Market size and forecast 2025-2030

Chart on Saudi Arabia - Market size and forecast 2025-2030 ($ million)
Data Table on Saudi Arabia - Market size and forecast 2025-2030 ($ million)
Chart on Saudi Arabia - Year-over-year growth 2025-2030 (%)
Data Table on Saudi Arabia - Year-over-year growth 2025-2030 (%)

12.7.2 UAE - Market size and forecast 2025-2030

Chart on UAE - Market size and forecast 2025-2030 ($ million)
Data Table on UAE - Market size and forecast 2025-2030 ($ million)
Chart on UAE - Year-over-year growth 2025-2030 (%)
Data Table on UAE - Year-over-year growth 2025-2030 (%)

12.7.3 South Africa - Market size and forecast 2025-2030

Chart on South Africa - Market size and forecast 2025-2030 ($ million)
Data Table on South Africa - Market size and forecast 2025-2030 ($ million)
Chart on South Africa - Year-over-year growth 2025-2030 (%)
Data Table on South Africa - Year-over-year growth 2025-2030 (%)

12.7.4 Israel - Market size and forecast 2025-2030

Chart on Israel - Market size and forecast 2025-2030 ($ million)
Data Table on Israel - Market size and forecast 2025-2030 ($ million)
Chart on Israel - Year-over-year growth 2025-2030 (%)
Data Table on Israel - Year-over-year growth 2025-2030 (%)

12.7.5 Turkey - Market size and forecast 2025-2030

Chart on Turkey - Market size and forecast 2025-2030 ($ million)
Data Table on Turkey - Market size and forecast 2025-2030 ($ million)
Chart on Turkey - Year-over-year growth 2025-2030 (%)
Data Table on Turkey - Year-over-year growth 2025-2030 (%)

12.8 Market opportunity by geography

Market opportunity by geography ($ million)
Data Tables on Market opportunity by geography ($ million)

13. Drivers, Challenges, and Opportunity

13.1 Market drivers

Longevity shifts and proliferation of nuclear households
Growing adoption of ambient intelligence, assistive robotics, and smart infrastructure
Lifestyle-centric active adult living and preventive wellness

13.2 Market challenges

Increasing labor shortages and compounding personnel expenditures
High financing costs constraining facility development
Heightened regulatory oversight and quality compliance burdens

13.3 Impact of drivers and challenges

Impact of drivers and challenges in 2025 and 2030

13.4 Market opportunities

Chronic acuity levels and expansion of specialized cognitive care
Environmental sustainability and net-zero building standards
Middle-market rental tenures and flexible pricing formats

14. Competitive Landscape

14.1 Overview

14.2

Overview on criticality of inputs and factors of differentiation

14.3 Landscape disruption

Overview on factors of disruption

14.4 Industry risks

Impact of key risks on business

15. Competitive Analysis

15.1 Companies profiled

Companies covered

15.2 Company ranking index

15.3 Market positioning of companies

Matrix on companies position and classification

15.4 Affinity Living Communities

Affinity Living Communities - Overview
Affinity Living Communities - Product / Service
Affinity Living Communities - Key offerings
SWOT

15.5 Atria Senior Living Inc.

Atria Senior Living Inc. - Overview
Atria Senior Living Inc. - Product / Service
Atria Senior Living Inc. - Key offerings
SWOT

15.6 Belmont Village Senior Living

Belmont Village Senior Living - Overview
Belmont Village Senior Living - Product / Service
Belmont Village Senior Living - Key offerings
SWOT

15.7 Brookdale Senior Living Inc.

Brookdale Senior Living Inc. - Overview
Brookdale Senior Living Inc. - Business segments
Brookdale Senior Living Inc. - Key offerings
Brookdale Senior Living Inc. - Segment focus
SWOT

15.8 Bupa Group

Bupa Group - Overview
Bupa Group - Product / Service
Bupa Group - Key offerings
SWOT

15.9 Erickson Senior Living Management

Erickson Senior Living Management - Overview
Erickson Senior Living Management - Product / Service
Erickson Senior Living Management - Key offerings
SWOT

15.10 Frontier Senior Living

Frontier Senior Living - Overview
Frontier Senior Living - Product / Service
Frontier Senior Living - Key offerings
SWOT

15.11 Grace Management Inc.

Grace Management Inc. - Overview
Grace Management Inc. - Product / Service
Grace Management Inc. - Key offerings
SWOT

15.12 HC One Ltd.

HC One Ltd. - Overview
HC One Ltd. - Product / Service
HC One Ltd. - Key offerings
SWOT

15.13 Integrated Senior Lifestyles

Integrated Senior Lifestyles - Overview
Integrated Senior Lifestyles - Product / Service
Integrated Senior Lifestyles - Key offerings
SWOT

15.14 Juniper Communities

Juniper Communities - Overview
Juniper Communities - Product / Service
Juniper Communities - Key offerings
SWOT

15.15 Legend Senior Living

Legend Senior Living - Overview
Legend Senior Living - Product / Service
Legend Senior Living - Key offerings
SWOT

15.16 Leisure Care

Leisure Care - Overview
Leisure Care - Product / Service
Leisure Care - Key offerings
SWOT

15.17 Merrill Gardens

Merrill Gardens - Overview
Merrill Gardens - Product / Service
Merrill Gardens - Key offerings
SWOT

15.18 Sienna Senior Living Inc.

Sienna Senior Living Inc. - Overview
Sienna Senior Living Inc. - Business segments
Sienna Senior Living Inc. - Key offerings
Sienna Senior Living Inc. - Segment focus
SWOT

16. Appendix

16.1 Scope of the report

Market definition
Objectives
Notes and caveats

16.2 Inclusions and exclusions checklist

Inclusions checklist
Exclusions checklist

16.3 Currency conversion rates for US$

16.4 Research methodology

16.5 Data procurement

Information sources

16.6 Data validation

16.7 Validation techniques employed for market sizing

16.8 Data synthesis

16.9 360 degree market analysis

16.10 List of abbreviations

Research Methodology

Technavio presents a detailed picture of the market by way of study, synthesis, and summation of data from multiple sources. The analysts have presented the various facets of the market with a particular focus on identifying the key industry influencers. The data thus presented is comprehensive, reliable, and the result of extensive research, both primary and secondary.

INFORMATION SOURCES

Primary sources

  • Manufacturers and suppliers
  • Channel partners
  • Industry experts
  • Strategic decision makers

Secondary sources

  • Industry journals and periodicals
  • Government data
  • Financial reports of key industry players
  • Historical data
  • Press releases

DATA ANALYSIS

Data Synthesis

  • Collation of data
  • Estimation of key figures
  • Analysis of derived insights

Data Validation

  • Triangulation with data models
  • Reference against proprietary databases
  • Corroboration with industry experts

REPORT WRITING

Qualitative

  • Market drivers
  • Market challenges
  • Market trends
  • Five forces analysis

Quantitative

  • Market size and forecast
  • Market segmentation
  • Geographical insights
  • Competitive landscape

Interested in this report?

Get your sample now to see our research methodology and insights!

Download Now

Frequently Asked Questions

Retirement Communities market growth will increase by USD 48648.8 million during 2026-2030.

The Retirement Communities market is expected to grow at a CAGR of 4.8% during 2026-2030.

Retirement Communities market is segmented by Type (Assisted living facilities, Continuing care, Rest homes) Application (Elderly people, Disabled people) Gender (Female, Male)

Affinity Living Communities, Atria Senior Living Inc., Belmont Village Senior Living, Brookdale Senior Living Inc., Bupa Group, Erickson Senior Living Management, Frontier Senior Living, Grace Management Inc., HC One Ltd., Integrated Senior Lifestyles, Juniper Communities, Legend Senior Living, Leisure Care, Merrill Gardens, Senior Lifestyle Corp., Sienna Senior Living Inc., StoryPoint Group, Sunrise Senior Living LLC, Village Concepts, Watermark Retirement Communities are a few of the key vendors in the Retirement Communities market.

North America will register the highest growth rate of 39% among the other regions. Therefore, the Retirement Communities market in North America is expected to garner significant business opportunities for the vendors during the forecast period.

US, Canada, Mexico, Germany, UK, France, Italy, Spain, The Netherlands, China, Japan, India, South Korea, Australia, Indonesia, Brazil, Argentina, Chile, Saudi Arabia, UAE, South Africa, Israel, Turkey

  • Longevity shifts and proliferation of nuclear households is the driving factor this market.

The Retirement Communities market vendors should focus on grabbing business opportunities from the Type segment as it accounted for the largest market share in the base year.
RIA - Research AI Assistant
Ask RIA
