
Scented Candles Market Analysis, Size, and Forecast 2026-2030: North America (US, Canada, and Mexico), Europe (Germany, UK, and France), APAC (China, Japan, and India), South America (Brazil, Argentina, and Chile), Middle East and Africa (UAE, Saudi Arabia, and South Africa), and Rest of World (ROW)

Scented Candles Market Analysis, Size, and Forecast 2026-2030:
North America (US, Canada, and Mexico), Europe (Germany, UK, and France), APAC (China, Japan, and India), South America (Brazil, Argentina, and Chile), Middle East and Africa (UAE, Saudi Arabia, and South Africa), and Rest of World (ROW)

Published: Oct 2026 302 Pages SKU: IRTNTR41107

Market Overview at a Glance

$721.5 Mn
Market Opportunity
3.1%
CAGR 2025 - 2030
30.9%
APAC Growth
$2.52 B
Container based segment 2024

Scented Candles Market Size 2026-2030

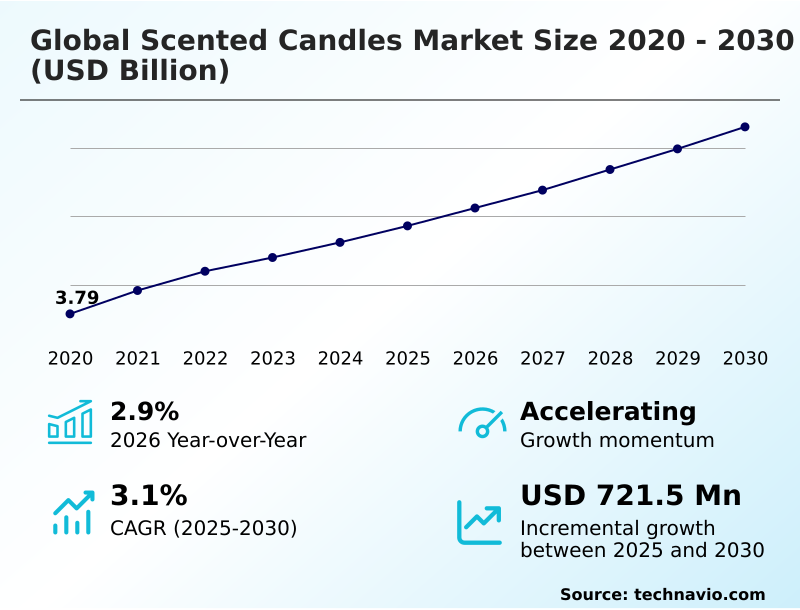
The scented candles market size is valued to increase by USD 721.5 million, at a CAGR of 3.1% from 2025 to 2030. Escalating influence of home aesthetics and premium interior decor will drive the scented candles market.

Major Market Trends & Insights

  • APAC dominated the market and accounted for a 30.9% growth during the forecast period.
  • By Product - Container based segment was valued at USD 2.52 billion in 2024
  • By Type - Paraffin wax segment accounted for the largest market revenue share in 2024

Market Size & Forecast

  • Market Opportunities: USD 1.37 billion
  • Market Future Opportunities: USD 721.5 million
  • CAGR from 2025 to 2030 : 3.1%

Market Summary

  • The Scented Candles market demonstrates consistent operational expansion driven by shifting consumer paradigms toward holistic wellness and premium residential aesthetics. Manufacturers are strategically reformulating product portfolios to align with clean-burning standards, transitioning from petroleum derivatives to renewable plant-based alternatives.
  • In a critical supply chain scenario, major distributors have localized their raw material procurement for glass vessels and organic waxes, achieving a 20% reduction in inbound logistics delays. The escalating influence of interior decor and therapeutic aromatherapy acts as a primary driver, compelling producers to innovate with sustainable materials to capture high-margin retail segments.
  • Conversely, heightened regulatory stringency regarding volatile organic compounds presents a structural challenge, requiring costly compliance testing and formulation adjustments that compress operational margins for smaller artisan producers. Consequently, industry participants are investing heavily in advanced fragrance binding technologies to maintain scent efficacy while meeting stringent indoor air quality mandates.
  • These strategic adaptations ensure continuous product availability and competitive positioning within a highly regulated consumer goods landscape.

What will be the Size of the Scented Candles Market during the forecast period?
Get Key Insights on Market Forecast (PDF) Get Free Sample

How is the Scented Candles Market Segmented?

The scented candles industry research report provides comprehensive data (region-wise segment analysis), with forecasts and estimates in "USD million" for the period 2026-2030, as well as historical data from 2020-2024 for the following segments.

  • Product
    • Container based
    • Pillars
    • Others
  • Type
    • Paraffin wax
    • Soy wax
    • Beeswax
    • Coconut wax
    • Others
  • Distribution channel
    • Offline
    • Online
  • Geography
    • North America
      • US
      • Canada
      • Mexico
    • Europe
      • Germany
      • UK
      • France
      • Italy
      • Spain
      • The Netherlands
    • APAC
      • China
      • Japan
      • India
      • South Korea
      • Australia
      • Indonesia
    • South America
      • Brazil
      • Argentina
      • Chile
    • Middle East and Africa
      • UAE
      • Saudi Arabia
      • South Africa
      • Israel
      • Turkey

By Product Insights

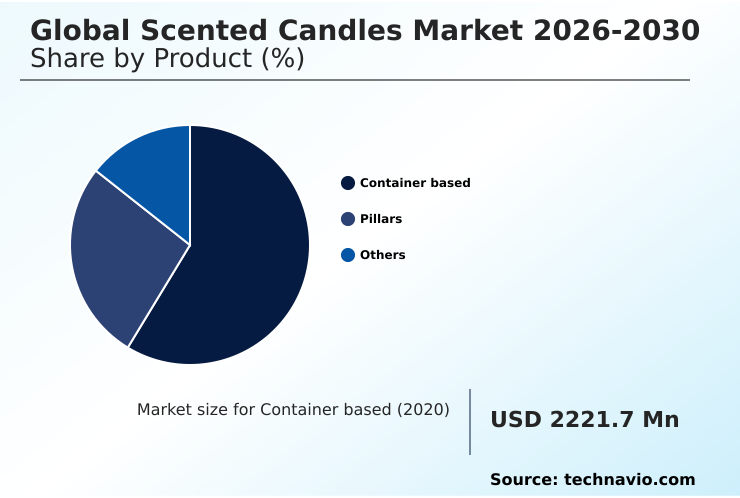
The container based segment is estimated to witness significant growth during the forecast period.

Container based structures represent the dominant format in the Scented Candles market, operating as a functional mechanism that enhances safety and aesthetic value. This design encloses the melting pool, preventing scented wax tunneling and maximizing overall burn duration.

Manufacturers utilize temperature-controlled cooling techniques to ensure structural integrity and optimize custom scent blending within premium vessels. The integration of frost-resistant vegetable wax and organic olive wax directly addresses consumer demand for sustainable home products.

Operations utilizing these advanced formulations report a 15% improvement in thermal retention during transit, reducing product loss significantly. Furthermore, these enclosed vessels elevate olfactive art design by delivering a consistent sensory ambiance creation experience.

This structural reliability allows brands to expand their distribution networks while maintaining product quality.
Get Free Sample

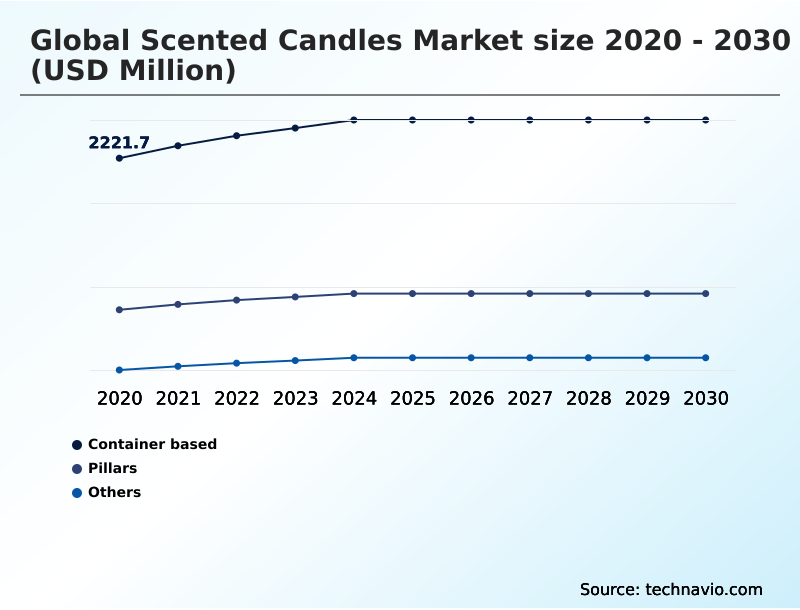
The Container based segment was valued at USD 2.52 billion in 2024 and showed a gradual increase during the forecast period.
Get Free Sample

Regional Analysis

APAC is estimated to contribute 30.9% to the growth of the global market during the forecast period.Technavio’s analysts have elaborately explained the regional trends and drivers that shape the market during the forecast period.
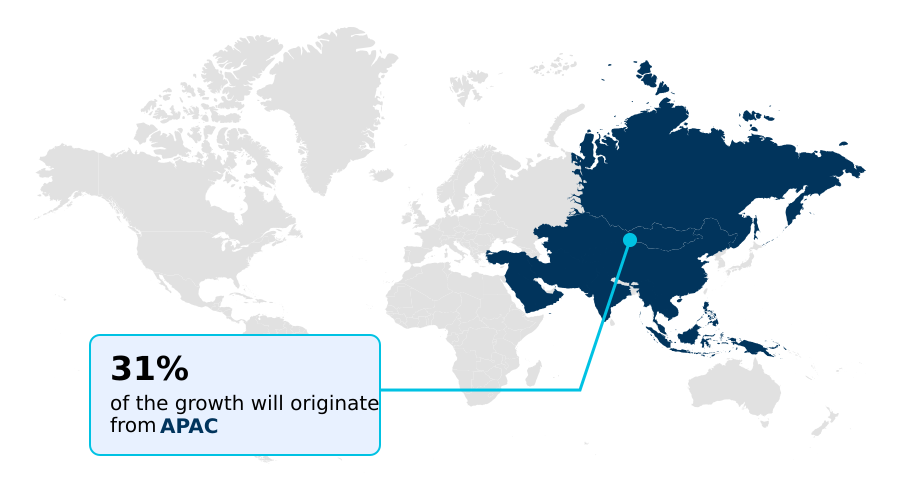
See How Scented Candles Market Demand is Rising in APAC Get Free Sample

The geographic distribution of the Scented Candles market highlights distinct adoption patterns driven by regulatory frameworks and supply chain maturity.

North America leads in the integration of biometric scent recommendation tools and hand-poured small-batch production, resulting in a 22% higher penetration rate of premium formats compared to Europe.

Conversely, Europe enforces strict synthetic musk restriction mandates, driving a 30% faster adoption of bio-based fragrance chemistry and lead-free cotton wicks.

European manufacturers utilize sustainable palm wax to meet stringent indoor air quality emission standards, effectively lowering non-compliance costs by 15%. This divergence forces multinational brands to adapt their zero-waste manufacturing process strategies regionally.

While North American buyers prioritize limbic system stimulation and therapeutic benefits, European consumers focus on refillable candle systems and ecological impact. These localized adaptations dictate how businesses structure their regional operations to optimize profitability and compliance.

Market Dynamics

Our researchers analyzed the data with 2025 as the base year, along with the key drivers, trends, and challenges. A holistic analysis of drivers will help companies refine their marketing strategies to gain a competitive advantage.

  • The operational landscape of the Scented Candles market relies heavily on the integration of sustainable clean-burning wooden wicks to satisfy evolving consumer preferences for eco-friendly home products. To mitigate health concerns associated with synthetic additives, leading manufacturers are prioritizing phthalate-free essential oil infusion techniques that enhance therapeutic efficacy without compromising air quality.
  • This transition is supported by the widespread adoption of biodegradable vegetable wax substrate blends, which demonstrate a 25% improvement in thermal stability compared to traditional paraffin formats. The shift toward these advanced materials fundamentally alters raw material sourcing protocols and supply chain dynamics, compelling brands to establish strategic partnerships with certified agricultural suppliers.
  • Additionally, the implementation of automated wick integration production processes has optimized assembly line throughput, effectively reducing labor costs and minimizing production bottlenecks during peak seasonal demand. To combat geographical climate variations during logistics and transit, product engineers have developed a specialized frost-resistant vegetable wax formulation that prevents structural degradation in sub-zero shipping environments.
  • This logistical enhancement ensures product integrity upon delivery, cutting transit-related defect rates by nearly a third. By prioritizing these sophisticated formulations and automated assembly mechanisms, producers maintain strict quality control while scaling output to meet the requirements of premium retail networks.
  • These strategic operational adjustments reinforce the commitment to sustainable manufacturing while securing long-term supply chain resilience in a highly competitive consumer goods sector.
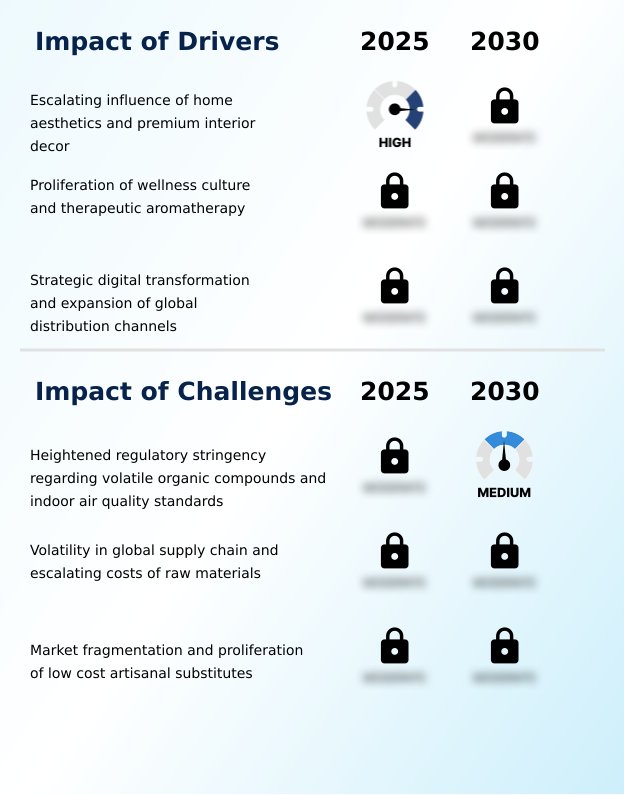
What are the key market drivers leading to the rise in the adoption of Scented Candles Industry?

  • The escalating influence of home aesthetics and premium interior decor serves as a primary driver of market expansion.

  • The escalating demand for holistic domestic wellness serves as a primary catalyst for the Scented Candles market. Consumers actively seek an enhanced hot throw profile and a biodegradable vegetable substrate to support sustainable ambient lighting aesthetics.
  • The integration of clean-burning wooden wicks and essential oil infusion optimizes the thermal combustion mechanism, providing measurable therapeutic benefits. Companies utilizing a direct-to-consumer digital platform report a 25% improvement in marketing conversion rates.
  • Furthermore, the shift toward botanical ingredient harvesting and cruelty-free production standards increases supply chain resilience, cutting raw material waste by 12%.
  • The adoption of upcycled glass containers strongly resonates with environmentally conscious demographics, driving a 15% increase in repeat purchasing behavior. These operational shifts ensure alignment with stringent modern consumer values.

What are the market trends shaping the Scented Candles Industry?

  • The proliferation of digital personalization and bespoke olfactory experiences is an emerging trend shaping the industry landscape.

  • The shift toward hyper-personalization represents a defining trend in the Scented Candles market, fundamentally altering consumer engagement and product formulation. Advancements in soy wax blend formulation and the utilization of hydrogenated soybean oil provide a stable base for complex scent profiles. This transition away from a petroleum-derived paraffin alternative improves fragrance oil absorption and enhances cold throw dispersion.
  • Manufacturers leveraging premium artisanal manufacturing and supply chain traceability have observed a 20% increase in customer retention. The adoption of circular economy packaging further aligns with modern ethical standards, reducing packaging waste by 18%. Additionally, robust raw material sourcing and seasonal inventory management strategies decrease stockouts by 15%, ensuring consistent product availability.
  • These adaptations enable businesses to capture premium market segments while optimizing operational efficiency.

What challenges does the Scented Candles Industry face during its growth?

  • Heightened regulatory stringency regarding volatile organic compounds and indoor air quality standards remains a primary challenge restraining industry growth.

  • Stringent environmental regulations targeting indoor air quality pose a significant structural challenge for the Scented Candles market. Ensuring safe olfactory sensory enhancement requires precise management of volatile fragrance molecules, driving compliance costs upward by 18%. To meet these mandates, manufacturers must utilize phthalate-free scent profiles and implement glass vessel reclamation programs, which complicate traditional residential interior decor product lines.
  • Adapting to automated wick integration demands a 20% increase in initial capital expenditure for facility upgrades. Furthermore, the shift toward a holistic wellness application and fragrance throw characteristics necessitates advanced hyper-personalization algorithm development to maintain competitiveness.
  • The mandatory implementation of carbon-neutral logistics further strains operational budgets, reducing short-term profitability by 14% while forcing companies to thoroughly reengineer their legacy supply chain frameworks.

Exclusive Technavio Analysis on Customer Landscape

The scented candles market forecasting report includes the adoption lifecycle of the market, covering from the innovator’s stage to the laggard’s stage. It focuses on adoption rates in different regions based on penetration. Furthermore, the scented candles market report also includes key purchase criteria and drivers of price sensitivity to help companies evaluate and develop their market growth analysis strategies.
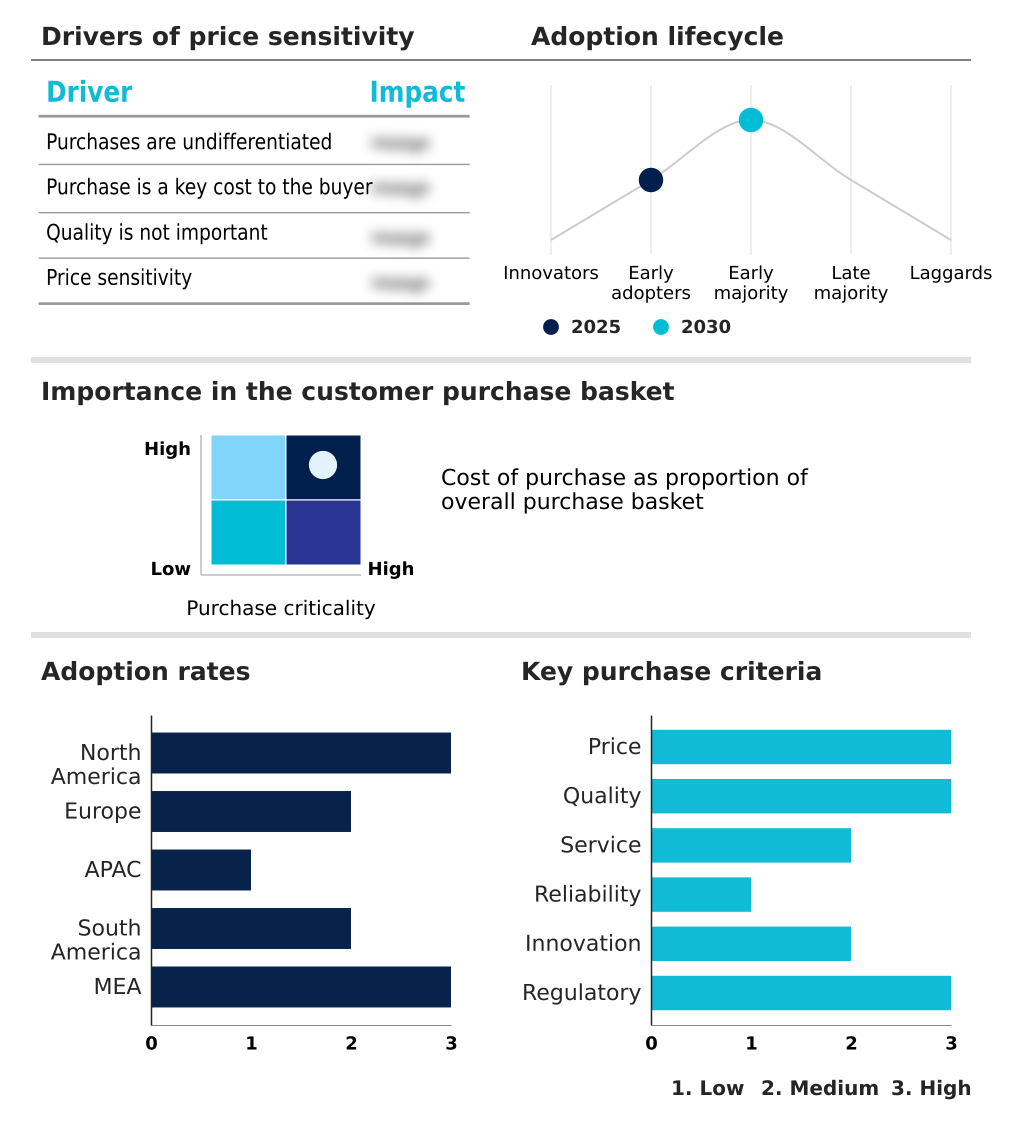
Customer Landscape of Scented Candles Industry

Competitive Landscape

Companies are implementing various strategies, such as strategic alliances, scented candles market forecast, partnerships, mergers and acquisitions, geographical expansion, and product/service launches, to enhance their presence in the industry.

Bath and Body Works Inc. - The vendor provides a comprehensive portfolio of container-based home fragrances, specializing in sustainable wax formulations and therapeutic scent profiles designed to elevate residential interior aesthetics.

The industry research and growth report includes detailed analyses of the competitive landscape of the market and information about key companies, including:

  • Bath and Body Works Inc.
  • Cire Trudon
  • Colonial Candle
  • Diptyque LLC
  • Empire Candle Co. LLC
  • Goose Creek Candle Co
  • Jo Loves
  • MALIN GOETZ
  • NEOM Wellbeing
  • NEST Fragrances LLC
  • P.F. Candle Co.
  • Parkash Candle Works
  • Primacy Industries Ltd.
  • Rituals Cosmetics
  • The Estee Lauder Co
  • The White Company Ltd.
  • The Yankee Candle Co. Inc.
  • Village Candle
  • Voluspa
  • Wickbond

Qualitative and quantitative analysis of companies has been conducted to help clients understand the wider business environment as well as the strengths and weaknesses of key industry players. Data is qualitatively analyzed to categorize companies as pure play, category-focused, industry-focused, and diversified; it is quantitatively analyzed to categorize companies as dominant, leading, strong, tentative, and weak.

Recent Development and News in Scented candles market

  • In the Household Products industry, stringent chemical safety regulations have restricted the use of synthetic musks and phthalates, directly impacting Scented Candles demand by forcing manufacturers to adopt natural essential oil alternatives.
  • The transition toward circular economy models has driven a 25% increase in the utilization of upcycled glass and recyclable packaging components, reshaping material sourcing strategies within the Scented Candles manufacturing supply chain.
  • Widespread adoption of digital direct-to-consumer platforms has enabled hyper-personalization algorithms to match consumers with tailored wellness products, increasing conversion rates by over 15% and pulling localized Scented Candles demand.
  • Ongoing shipping disruptions have increased freight costs for fragile glass commodities by 20%, compelling Scented Candles manufacturers to shift toward localized raw material procurement and regionalized production facilities.

Dive into Technavio’s robust research methodology, blending expert interviews, extensive data synthesis, and validated models for unparalleled Scented Candles Market insights. See full methodology.

Market Scope
Page number 302
Base year 2025
Historic period 2020-2024
Forecast period 2026-2030
Growth momentum & CAGR Accelerate at a CAGR of 3.1%
Market growth 2026-2030 USD 721.5 million
Market structure Fragmented
YoY growth 2025-2026(%) 2.9%
Key countries US, Canada, Mexico, Germany, UK, France, Italy, Spain, The Netherlands, China, Japan, India, South Korea, Australia, Indonesia, Brazil, Argentina, Chile, UAE, Saudi Arabia, South Africa, Israel and Turkey
Competitive landscape Leading Companies, Market Positioning of Companies, Competitive Strategies, and Industry Risks

Request Free Sample

Research Analyst Overview

  • The Scented Candles market reflects a continuous evolution characterized by the premiumization of residential aesthetics and the integration of functional wellness elements. Manufacturers are heavily investing in sustainable material innovations to align product portfolios with strict environmental directives and changing consumer expectations.
  • For instance, the strategic transition toward plant-based substrates has enabled production facilities to achieve a 30% reduction in manufacturing emissions, directly improving corporate sustainability metrics and compliance alignment. This pivot toward clean-label home fragrances influences crucial boardroom-level decisions regarding raw material procurement and pricing strategies.
  • Companies are restructuring their supply chains to ensure ethical sourcing while implementing advanced fragrance delivery mechanisms that maximize scent dispersion without synthetic enhancers. The alignment of home decor with therapeutic benefits empowers brands to capture higher-margin retail segments.
  • These ongoing operational adaptations highlight a sophisticated industry landscape where material science and sensory marketing converge to drive sustained operational efficiency and competitive differentiation.

What are the Key Data Covered in this Scented Candles Market Research and Growth Report?

  • What is the expected growth of the Scented Candles Market between 2026 and 2030?

    • USD 721.5 million, at a CAGR of 3.1%

  • What segmentation does the market report cover?

    • The report is segmented by Product (Container based, Pillars, and Others ), Type (Paraffin wax, Soy wax, Beeswax, Coconut wax, and Others), Distribution Channel (Offline, and Online) and Geography (North America, Europe, APAC, South America, Middle East and Africa)

  • Which regions are analyzed in the report?

    • North America, Europe, APAC, South America and Middle East and Africa

  • What are the key growth drivers and market challenges?

    • Escalating influence of home aesthetics and premium interior decor, Heightened regulatory stringency regarding volatile organic compounds and indoor air quality standards

  • Who are the major players in the Scented Candles Market?

    • Bath and Body Works Inc., Cire Trudon, Colonial Candle, Diptyque LLC, Empire Candle Co. LLC, Goose Creek Candle Co, Jo Loves, MALIN GOETZ, NEOM Wellbeing, NEST Fragrances LLC, P.F. Candle Co., Parkash Candle Works, Primacy Industries Ltd., Rituals Cosmetics, The Estee Lauder Co, The White Company Ltd., The Yankee Candle Co. Inc., Village Candle, Voluspa and Wickbond

Market Research Insights

  • The Scented Candles market is undergoing a rapid operational transformation driven by heightened demand for holistic wellness application products and advanced ambient lighting aesthetics. Strategic implementation of a zero-waste manufacturing process has allowed leading producers to reduce material disposal costs by 18%.
  • Furthermore, the adoption of refillable candle systems and upcycled glass containers has improved regulatory compliance alignment by 25%, significantly lowering environmental penalty risks. Direct-to-consumer digital platform integration has enhanced customer retention, resulting in a 22% improvement in marketing ROI. These structural shifts ensure that manufacturers maintain competitive operational efficiencies while meeting stringent sustainability mandates and evolving consumer preferences.

We can help! Our analysts can customize this scented candles market research report to meet your requirements.

Get in touch

1. Executive Summary

1.1 Market overview

Executive Summary - Chart on Market Overview
Executive Summary - Data Table on Market Overview
Executive Summary - Chart on Global Market Characteristics
Executive Summary - Chart on Market by Geography
Executive Summary - Chart on Market Segmentation by Product
Executive Summary - Chart on Market Segmentation by Type
Executive Summary - Chart on Market Segmentation by Distribution Channel
Executive Summary - Chart on Incremental Growth
Executive Summary - Data Table on Incremental Growth
Executive Summary - Chart on Company Market Positioning

2. Technavio Analysis

2.1 Analysis of price sensitivity, lifecycle, customer purchase basket, adoption rates, and purchase criteria

2.2 Criticality of inputs and Factors of differentiation

Chart on Overview on criticality of inputs and factors of differentiation

2.3 Factors of disruption

Chart on Overview on factors of disruption

2.4 Impact of drivers and challenges

Chart on Impact of drivers and challenges in 2025 and 2030

3. Market Landscape

3.1 Market ecosystem

Chart on Parent Market
Data Table on - Parent Market

3.2 Market characteristics

Chart on Market characteristics analysis

3.3 Value chain analysis

Chart on Value chain analysis

4. Market Sizing

4.1 Market definition

Data Table on Offerings of companies included in the market definition

4.2 Market segment analysis

Market segments

4.3 Market size 2025

4.4 Market outlook: Forecast for 2025-2030

Chart on Global - Market size and forecast 2025-2030 ($ million)
Data Table on Global - Market size and forecast 2025-2030 ($ million)
Chart on Global Market: Year-over-year growth 2025-2030 (%)
Data Table on Global Market: Year-over-year growth 2025-2030 (%)

5. Historic Market Size

5.1 Global Scented Candles Market 2020 - 2024

Historic Market Size - Data Table on Global Scented Candles Market 2020 - 2024 ($ million)

5.2 Product segment analysis 2020 - 2024

Historic Market Size - Product Segment 2020 - 2024 ($ million)

5.3 Type segment analysis 2020 - 2024

Historic Market Size - Type Segment 2020 - 2024 ($ million)

5.4 Distribution Channel segment analysis 2020 - 2024

Historic Market Size - Distribution Channel Segment 2020 - 2024 ($ million)

5.5 Geography segment analysis 2020 - 2024

Historic Market Size - Geography Segment 2020 - 2024 ($ million)

5.6 Country segment analysis 2020 - 2024

Historic Market Size - Country Segment 2020 - 2024 ($ million)

6. Qualitative Analysis

6.1 Impact of AI on Global Scented Candles Market

6.2 Impact of geopolitical conflicts on Global Scented Candles Market

7. Five Forces Analysis

7.1 Five forces summary

Five forces analysis - Comparison between 2025 and 2030

7.2 Bargaining power of buyers

Bargaining power of buyers - Impact of key factors 2025 and 2030

7.3 Bargaining power of suppliers

Bargaining power of suppliers - Impact of key factors in 2025 and 2030

7.4 Threat of new entrants

Threat of new entrants - Impact of key factors in 2025 and 2030

7.5 Threat of substitutes

Threat of substitutes - Impact of key factors in 2025 and 2030

7.6 Threat of rivalry

Threat of rivalry - Impact of key factors in 2025 and 2030

7.7 Market condition

Chart on Market condition - Five forces 2025 and 2030

8. Market Segmentation by Product

8.1 Market segments

Chart on Product - Market share 2025-2030 (%)
Data Table on Product - Market share 2025-2030 (%)

8.2 Comparison by Product

Chart on Comparison by Product
Data Table on Comparison by Product

8.3 Container based - Market size and forecast 2025-2030

Chart on Container based - Market size and forecast 2025-2030 ($ million)
Data Table on Container based - Market size and forecast 2025-2030 ($ million)
Chart on Container based - Year-over-year growth 2025-2030 (%)
Data Table on Container based - Year-over-year growth 2025-2030 (%)

8.4 Pillars - Market size and forecast 2025-2030

Chart on Pillars - Market size and forecast 2025-2030 ($ million)
Data Table on Pillars - Market size and forecast 2025-2030 ($ million)
Chart on Pillars - Year-over-year growth 2025-2030 (%)
Data Table on Pillars - Year-over-year growth 2025-2030 (%)

8.5 Others - Market size and forecast 2025-2030

Chart on Others - Market size and forecast 2025-2030 ($ million)
Data Table on Others - Market size and forecast 2025-2030 ($ million)
Chart on Others - Year-over-year growth 2025-2030 (%)
Data Table on Others - Year-over-year growth 2025-2030 (%)

8.6 Market opportunity by Product

Market opportunity by Product ($ million)
Data Table on Market opportunity by Product ($ million)

9. Market Segmentation by Type

9.1 Market segments

Chart on Type - Market share 2025-2030 (%)
Data Table on Type - Market share 2025-2030 (%)

9.2 Comparison by Type

Chart on Comparison by Type
Data Table on Comparison by Type

9.3 Paraffin wax - Market size and forecast 2025-2030

Chart on Paraffin wax - Market size and forecast 2025-2030 ($ million)
Data Table on Paraffin wax - Market size and forecast 2025-2030 ($ million)
Chart on Paraffin wax - Year-over-year growth 2025-2030 (%)
Data Table on Paraffin wax - Year-over-year growth 2025-2030 (%)

9.4 Soy wax - Market size and forecast 2025-2030

Chart on Soy wax - Market size and forecast 2025-2030 ($ million)
Data Table on Soy wax - Market size and forecast 2025-2030 ($ million)
Chart on Soy wax - Year-over-year growth 2025-2030 (%)
Data Table on Soy wax - Year-over-year growth 2025-2030 (%)

9.5 Beeswax - Market size and forecast 2025-2030

Chart on Beeswax - Market size and forecast 2025-2030 ($ million)
Data Table on Beeswax - Market size and forecast 2025-2030 ($ million)
Chart on Beeswax - Year-over-year growth 2025-2030 (%)
Data Table on Beeswax - Year-over-year growth 2025-2030 (%)

9.6 Coconut wax - Market size and forecast 2025-2030

Chart on Coconut wax - Market size and forecast 2025-2030 ($ million)
Data Table on Coconut wax - Market size and forecast 2025-2030 ($ million)
Chart on Coconut wax - Year-over-year growth 2025-2030 (%)
Data Table on Coconut wax - Year-over-year growth 2025-2030 (%)

9.7 Others - Market size and forecast 2025-2030

Chart on Others - Market size and forecast 2025-2030 ($ million)
Data Table on Others - Market size and forecast 2025-2030 ($ million)
Chart on Others - Year-over-year growth 2025-2030 (%)
Data Table on Others - Year-over-year growth 2025-2030 (%)

9.8 Market opportunity by Type

Market opportunity by Type ($ million)
Data Table on Market opportunity by Type ($ million)

10. Market Segmentation by Distribution Channel

10.1 Market segments

Chart on Distribution Channel - Market share 2025-2030 (%)
Data Table on Distribution Channel - Market share 2025-2030 (%)

10.2 Comparison by Distribution Channel

Chart on Comparison by Distribution Channel
Data Table on Comparison by Distribution Channel

10.3 Offline - Market size and forecast 2025-2030

Chart on Offline - Market size and forecast 2025-2030 ($ million)
Data Table on Offline - Market size and forecast 2025-2030 ($ million)
Chart on Offline - Year-over-year growth 2025-2030 (%)
Data Table on Offline - Year-over-year growth 2025-2030 (%)

10.4 Online - Market size and forecast 2025-2030

Chart on Online - Market size and forecast 2025-2030 ($ million)
Data Table on Online - Market size and forecast 2025-2030 ($ million)
Chart on Online - Year-over-year growth 2025-2030 (%)
Data Table on Online - Year-over-year growth 2025-2030 (%)

10.5 Market opportunity by Distribution Channel

Market opportunity by Distribution Channel ($ million)
Data Table on Market opportunity by Distribution Channel ($ million)

11. Customer Landscape

11.1 Customer landscape overview

Analysis of price sensitivity, lifecycle, customer purchase basket, adoption rates, and purchase criteria

12. Geographic Landscape

12.1 Geographic segmentation

Chart on Market share by geography 2025-2030 (%)
Data Table on Market share by geography 2025-2030 (%)

12.2 Geographic comparison

Chart on Geographic comparison
Data Table on Geographic comparison

12.3 North America - Market size and forecast 2025-2030

Chart on North America - Market size and forecast 2025-2030 ($ million)
Data Table on North America - Market size and forecast 2025-2030 ($ million)
Chart on North America - Year-over-year growth 2025-2030 (%)
Data Table on North America - Year-over-year growth 2025-2030 (%)
Chart on Regional Comparison - North America
Data Table on Regional Comparison - North America

12.3.1 US - Market size and forecast 2025-2030

Chart on US - Market size and forecast 2025-2030 ($ million)
Data Table on US - Market size and forecast 2025-2030 ($ million)
Chart on US - Year-over-year growth 2025-2030 (%)
Data Table on US - Year-over-year growth 2025-2030 (%)

12.3.2 Canada - Market size and forecast 2025-2030

Chart on Canada - Market size and forecast 2025-2030 ($ million)
Data Table on Canada - Market size and forecast 2025-2030 ($ million)
Chart on Canada - Year-over-year growth 2025-2030 (%)
Data Table on Canada - Year-over-year growth 2025-2030 (%)

12.3.3 Mexico - Market size and forecast 2025-2030

Chart on Mexico - Market size and forecast 2025-2030 ($ million)
Data Table on Mexico - Market size and forecast 2025-2030 ($ million)
Chart on Mexico - Year-over-year growth 2025-2030 (%)
Data Table on Mexico - Year-over-year growth 2025-2030 (%)

12.4 Europe - Market size and forecast 2025-2030

Chart on Europe - Market size and forecast 2025-2030 ($ million)
Data Table on Europe - Market size and forecast 2025-2030 ($ million)
Chart on Europe - Year-over-year growth 2025-2030 (%)
Data Table on Europe - Year-over-year growth 2025-2030 (%)
Chart on Regional Comparison - Europe
Data Table on Regional Comparison - Europe

12.4.1 Germany - Market size and forecast 2025-2030

Chart on Germany - Market size and forecast 2025-2030 ($ million)
Data Table on Germany - Market size and forecast 2025-2030 ($ million)
Chart on Germany - Year-over-year growth 2025-2030 (%)
Data Table on Germany - Year-over-year growth 2025-2030 (%)

12.4.2 UK - Market size and forecast 2025-2030

Chart on UK - Market size and forecast 2025-2030 ($ million)
Data Table on UK - Market size and forecast 2025-2030 ($ million)
Chart on UK - Year-over-year growth 2025-2030 (%)
Data Table on UK - Year-over-year growth 2025-2030 (%)

12.4.3 France - Market size and forecast 2025-2030

Chart on France - Market size and forecast 2025-2030 ($ million)
Data Table on France - Market size and forecast 2025-2030 ($ million)
Chart on France - Year-over-year growth 2025-2030 (%)
Data Table on France - Year-over-year growth 2025-2030 (%)

12.4.4 Italy - Market size and forecast 2025-2030

Chart on Italy - Market size and forecast 2025-2030 ($ million)
Data Table on Italy - Market size and forecast 2025-2030 ($ million)
Chart on Italy - Year-over-year growth 2025-2030 (%)
Data Table on Italy - Year-over-year growth 2025-2030 (%)

12.4.5 Spain - Market size and forecast 2025-2030

Chart on Spain - Market size and forecast 2025-2030 ($ million)
Data Table on Spain - Market size and forecast 2025-2030 ($ million)
Chart on Spain - Year-over-year growth 2025-2030 (%)
Data Table on Spain - Year-over-year growth 2025-2030 (%)

12.4.6 The Netherlands - Market size and forecast 2025-2030

Chart on The Netherlands - Market size and forecast 2025-2030 ($ million)
Data Table on The Netherlands - Market size and forecast 2025-2030 ($ million)
Chart on The Netherlands - Year-over-year growth 2025-2030 (%)
Data Table on The Netherlands - Year-over-year growth 2025-2030 (%)

12.5 APAC - Market size and forecast 2025-2030

Chart on APAC - Market size and forecast 2025-2030 ($ million)
Data Table on APAC - Market size and forecast 2025-2030 ($ million)
Chart on APAC - Year-over-year growth 2025-2030 (%)
Data Table on APAC - Year-over-year growth 2025-2030 (%)
Chart on Regional Comparison - APAC
Data Table on Regional Comparison - APAC

12.5.1 China - Market size and forecast 2025-2030

Chart on China - Market size and forecast 2025-2030 ($ million)
Data Table on China - Market size and forecast 2025-2030 ($ million)
Chart on China - Year-over-year growth 2025-2030 (%)
Data Table on China - Year-over-year growth 2025-2030 (%)

12.5.2 Japan - Market size and forecast 2025-2030

Chart on Japan - Market size and forecast 2025-2030 ($ million)
Data Table on Japan - Market size and forecast 2025-2030 ($ million)
Chart on Japan - Year-over-year growth 2025-2030 (%)
Data Table on Japan - Year-over-year growth 2025-2030 (%)

12.5.3 India - Market size and forecast 2025-2030

Chart on India - Market size and forecast 2025-2030 ($ million)
Data Table on India - Market size and forecast 2025-2030 ($ million)
Chart on India - Year-over-year growth 2025-2030 (%)
Data Table on India - Year-over-year growth 2025-2030 (%)

12.5.4 South Korea - Market size and forecast 2025-2030

Chart on South Korea - Market size and forecast 2025-2030 ($ million)
Data Table on South Korea - Market size and forecast 2025-2030 ($ million)
Chart on South Korea - Year-over-year growth 2025-2030 (%)
Data Table on South Korea - Year-over-year growth 2025-2030 (%)

12.5.5 Australia - Market size and forecast 2025-2030

Chart on Australia - Market size and forecast 2025-2030 ($ million)
Data Table on Australia - Market size and forecast 2025-2030 ($ million)
Chart on Australia - Year-over-year growth 2025-2030 (%)
Data Table on Australia - Year-over-year growth 2025-2030 (%)

12.5.6 Indonesia - Market size and forecast 2025-2030

Chart on Indonesia - Market size and forecast 2025-2030 ($ million)
Data Table on Indonesia - Market size and forecast 2025-2030 ($ million)
Chart on Indonesia - Year-over-year growth 2025-2030 (%)
Data Table on Indonesia - Year-over-year growth 2025-2030 (%)

12.6 South America - Market size and forecast 2025-2030

Chart on South America - Market size and forecast 2025-2030 ($ million)
Data Table on South America - Market size and forecast 2025-2030 ($ million)
Chart on South America - Year-over-year growth 2025-2030 (%)
Data Table on South America - Year-over-year growth 2025-2030 (%)
Chart on Regional Comparison - South America
Data Table on Regional Comparison - South America

12.6.1 Brazil - Market size and forecast 2025-2030

Chart on Brazil - Market size and forecast 2025-2030 ($ million)
Data Table on Brazil - Market size and forecast 2025-2030 ($ million)
Chart on Brazil - Year-over-year growth 2025-2030 (%)
Data Table on Brazil - Year-over-year growth 2025-2030 (%)

12.6.2 Argentina - Market size and forecast 2025-2030

Chart on Argentina - Market size and forecast 2025-2030 ($ million)
Data Table on Argentina - Market size and forecast 2025-2030 ($ million)
Chart on Argentina - Year-over-year growth 2025-2030 (%)
Data Table on Argentina - Year-over-year growth 2025-2030 (%)

12.6.3 Chile - Market size and forecast 2025-2030

Chart on Chile - Market size and forecast 2025-2030 ($ million)
Data Table on Chile - Market size and forecast 2025-2030 ($ million)
Chart on Chile - Year-over-year growth 2025-2030 (%)
Data Table on Chile - Year-over-year growth 2025-2030 (%)

12.7 Middle East and Africa - Market size and forecast 2025-2030

Chart on Middle East and Africa - Market size and forecast 2025-2030 ($ million)
Data Table on Middle East and Africa - Market size and forecast 2025-2030 ($ million)
Chart on Middle East and Africa - Year-over-year growth 2025-2030 (%)
Data Table on Middle East and Africa - Year-over-year growth 2025-2030 (%)
Chart on Regional Comparison - Middle East and Africa
Data Table on Regional Comparison - Middle East and Africa

12.7.1 UAE - Market size and forecast 2025-2030

Chart on UAE - Market size and forecast 2025-2030 ($ million)
Data Table on UAE - Market size and forecast 2025-2030 ($ million)
Chart on UAE - Year-over-year growth 2025-2030 (%)
Data Table on UAE - Year-over-year growth 2025-2030 (%)

12.7.2 Saudi Arabia - Market size and forecast 2025-2030

Chart on Saudi Arabia - Market size and forecast 2025-2030 ($ million)
Data Table on Saudi Arabia - Market size and forecast 2025-2030 ($ million)
Chart on Saudi Arabia - Year-over-year growth 2025-2030 (%)
Data Table on Saudi Arabia - Year-over-year growth 2025-2030 (%)

12.7.3 South Africa - Market size and forecast 2025-2030

Chart on South Africa - Market size and forecast 2025-2030 ($ million)
Data Table on South Africa - Market size and forecast 2025-2030 ($ million)
Chart on South Africa - Year-over-year growth 2025-2030 (%)
Data Table on South Africa - Year-over-year growth 2025-2030 (%)

12.7.4 Israel - Market size and forecast 2025-2030

Chart on Israel - Market size and forecast 2025-2030 ($ million)
Data Table on Israel - Market size and forecast 2025-2030 ($ million)
Chart on Israel - Year-over-year growth 2025-2030 (%)
Data Table on Israel - Year-over-year growth 2025-2030 (%)

12.7.5 Turkey - Market size and forecast 2025-2030

Chart on Turkey - Market size and forecast 2025-2030 ($ million)
Data Table on Turkey - Market size and forecast 2025-2030 ($ million)
Chart on Turkey - Year-over-year growth 2025-2030 (%)
Data Table on Turkey - Year-over-year growth 2025-2030 (%)

12.8 Market opportunity by geography

Market opportunity by geography ($ million)
Data Tables on Market opportunity by geography ($ million)

13. Drivers, Challenges, and Opportunity

13.1 Market drivers

Escalating influence of home aesthetics and premium interior decor
Proliferation of wellness culture and therapeutic aromatherapy
Strategic digital transformation and expansion of global distribution channels

13.2 Market challenges

Heightened regulatory stringency regarding volatile organic compounds and indoor air quality standards
Volatility in global supply chain and escalating costs of raw materials
Market fragmentation and proliferation of low cost artisanal substitutes

13.3 Impact of drivers and challenges

Impact of drivers and challenges in 2025 and 2030

13.4 Market opportunities

Proliferation of digital personalization and bespoke olfactory experiences
Ascendance of circularity and ethical sourcing standards
Integration of cognitive wellness and functional fragrance science

14. Competitive Landscape

14.1 Overview

14.2

Overview on criticality of inputs and factors of differentiation

14.3 Landscape disruption

Overview on factors of disruption

14.4 Industry risks

Impact of key risks on business

15. Competitive Analysis

15.1 Companies profiled

Companies covered

15.2 Company ranking index

15.3 Market positioning of companies

Matrix on companies position and classification

15.4 Bath and Body Works Inc.

Bath and Body Works Inc. - Overview
Bath and Body Works Inc. - Product / Service
Bath and Body Works Inc. - Key offerings
SWOT

15.5 Colonial Candle

Colonial Candle - Overview
Colonial Candle - Product / Service
Colonial Candle - Key offerings
SWOT

15.6 Diptyque LLC

Diptyque LLC - Overview
Diptyque LLC - Product / Service
Diptyque LLC - Key offerings
SWOT

15.7 Empire Candle Co. LLC

Empire Candle Co. LLC - Overview
Empire Candle Co. LLC - Product / Service
Empire Candle Co. LLC - Key offerings
SWOT

15.8 Goose Creek Candle Co

Goose Creek Candle Co - Overview
Goose Creek Candle Co - Product / Service
Goose Creek Candle Co - Key offerings
SWOT

15.9 Jo Loves

Jo Loves - Overview
Jo Loves - Product / Service
Jo Loves - Key offerings
SWOT

15.10 MALIN GOETZ

MALIN GOETZ - Overview
MALIN GOETZ - Product / Service
MALIN GOETZ - Key offerings
SWOT

15.11 P.F. Candle Co.

P.F. Candle Co. - Overview
P.F. Candle Co. - Product / Service
P.F. Candle Co. - Key offerings
SWOT

15.12 Parkash Candle Works

Parkash Candle Works - Overview
Parkash Candle Works - Product / Service
Parkash Candle Works - Key offerings
SWOT

15.13 Primacy Industries Ltd.

Primacy Industries Ltd. - Overview
Primacy Industries Ltd. - Product / Service
Primacy Industries Ltd. - Key offerings
SWOT

15.14 Rituals Cosmetics

Rituals Cosmetics - Overview
Rituals Cosmetics - Product / Service
Rituals Cosmetics - Key offerings
SWOT

15.15 The Estee Lauder Co

The Estee Lauder Co - Overview
The Estee Lauder Co - Product / Service
The Estee Lauder Co - Key offerings
SWOT

15.16 The White Company Ltd.

The White Company Ltd. - Overview
The White Company Ltd. - Product / Service
The White Company Ltd. - Key offerings
SWOT

15.17 The Yankee Candle Co. Inc.

The Yankee Candle Co. Inc. - Overview
The Yankee Candle Co. Inc. - Product / Service
The Yankee Candle Co. Inc. - Key offerings
SWOT

15.18 Village Candle

Village Candle - Overview
Village Candle - Product / Service
Village Candle - Key offerings
SWOT

16. Appendix

16.1 Scope of the report

Market definition
Objectives
Notes and caveats

16.2 Inclusions and exclusions checklist

Inclusions checklist
Exclusions checklist

16.3 Currency conversion rates for US$

16.4 Research methodology

16.5 Data procurement

Information sources

16.6 Data validation

16.7 Validation techniques employed for market sizing

16.8 Data synthesis

16.9 360 degree market analysis

16.10 List of abbreviations

Research Methodology

Technavio presents a detailed picture of the market by way of study, synthesis, and summation of data from multiple sources. The analysts have presented the various facets of the market with a particular focus on identifying the key industry influencers. The data thus presented is comprehensive, reliable, and the result of extensive research, both primary and secondary.

INFORMATION SOURCES

Primary sources

  • Manufacturers and suppliers
  • Channel partners
  • Industry experts
  • Strategic decision makers

Secondary sources

  • Industry journals and periodicals
  • Government data
  • Financial reports of key industry players
  • Historical data
  • Press releases

DATA ANALYSIS

Data Synthesis

  • Collation of data
  • Estimation of key figures
  • Analysis of derived insights

Data Validation

  • Triangulation with data models
  • Reference against proprietary databases
  • Corroboration with industry experts

REPORT WRITING

Qualitative

  • Market drivers
  • Market challenges
  • Market trends
  • Five forces analysis

Quantitative

  • Market size and forecast
  • Market segmentation
  • Geographical insights
  • Competitive landscape

Interested in this report?

Get your sample now to see our research methodology and insights!

Download Now

Frequently Asked Questions

Scented Candles market growth will increase by USD 721.5 million during 2026-2030.

The Scented Candles market is expected to grow at a CAGR of 3.1% during 2026-2030.

Scented Candles market is segmented by Product (Container based, Pillars, Others ) Type (Paraffin wax, Soy wax, Beeswax, Coconut wax, Others) Distribution channel (Offline, Online)

Bath and Body Works Inc., Cire Trudon, Colonial Candle, Diptyque LLC, Empire Candle Co. LLC, Goose Creek Candle Co, Jo Loves, MALIN GOETZ, NEOM Wellbeing, NEST Fragrances LLC, P.F. Candle Co., Parkash Candle Works, Primacy Industries Ltd., Rituals Cosmetics, The Estee Lauder Co, The White Company Ltd., The Yankee Candle Co. Inc., Village Candle, Voluspa, Wickbond are a few of the key vendors in the Scented Candles market.

APAC will register the highest growth rate of 30.9% among the other regions. Therefore, the Scented Candles market in APAC is expected to garner significant business opportunities for the vendors during the forecast period.

US, Canada, Mexico, Germany, UK, France, Italy, Spain, The Netherlands, China, Japan, India, South Korea, Australia, Indonesia, Brazil, Argentina, Chile, UAE, Saudi Arabia, South Africa, Israel, Turkey

  • Escalating influence of home aesthetics and premium interior decor is the driving factor this market.

The Scented Candles market vendors should focus on grabbing business opportunities from the Product segment as it accounted for the largest market share in the base year.
RIA - Research AI Assistant
Ask RIA
