
Sensory Toys Market Analysis, Size, and Forecast 2026-2030: North America (US, Canada, and Mexico), Europe (Germany, UK, and France), APAC (China, Japan, and India), South America (Brazil, Argentina, and Colombia), Middle East and Africa (Saudi Arabia, UAE, and South Africa), and Rest of World (ROW)

Sensory Toys Market Analysis, Size, and Forecast 2026-2030:
North America (US, Canada, and Mexico), Europe (Germany, UK, and France), APAC (China, Japan, and India), South America (Brazil, Argentina, and Colombia), Middle East and Africa (Saudi Arabia, UAE, and South Africa), and Rest of World (ROW)

Published: Oct 2026 305 Pages SKU: IRTNTR81753

Market Overview at a Glance

$1.79 B
Market Opportunity
9.4%
CAGR 2025 - 2030
39.7%
North America Growth
$1.16 B
Fidget toys segment 2024

Sensory Toys Market Size 2026-2030

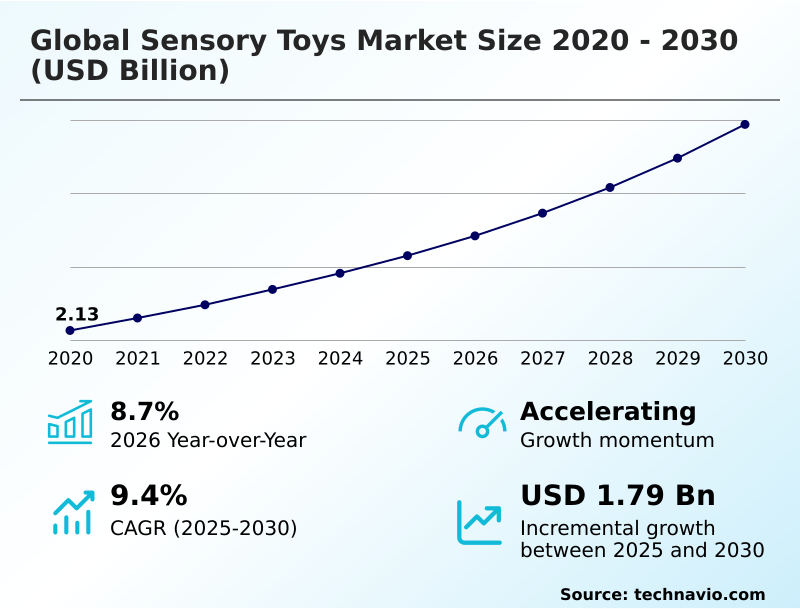
The sensory toys market size is valued to increase by USD 1.79 billion, at a CAGR of 9.4% from 2025 to 2030. Rising therapeutic integration in education will drive the sensory toys market.

Major Market Trends & Insights

  • North America dominated the market and accounted for a 39.7% growth during the forecast period.
  • By Product Type - Fidget toys segment was valued at USD 1.16 billion in 2024
  • By Age Group - Children segment accounted for the largest market revenue share in 2024

Market Size & Forecast

  • Market Opportunities: USD 2.81 billion
  • Market Future Opportunities: USD 1.79 billion
  • CAGR from 2025 to 2030 : 9.4%

Market Summary

  • The Sensory Toys Market experiences structural transformation driven by the mainstream integration of multi-sensory therapeutic instruments into educational and professional environments. Institutions increasingly adopt customizable sensory spaces to support cognitive development, transitioning these products from niche clinical applications to standardized learning tools.
  • A notable operational shift occurs as manufacturers overhaul supply chains to prioritize bio-based resin compounds and sustainably harvested timber, mitigating exposure to volatile petrochemical costs. Companies implementing these circular manufacturing principles have achieved a 22% reduction in raw material waste during high-volume production cycles.
  • Rising therapeutic integration in education acts as a primary catalyst, propelling institutional demand for evidence-based therapeutic aids that enhance spatial awareness building and behavioral self-regulation. Conversely, stringent chemical compliance regulations and varying regional safety standards create significant operational friction, delaying product launches and requiring exhaustive third-party laboratory testing.
  • To navigate these complexities, procurement teams deploy advanced quality control frameworks to ensure non-toxic material compliance. This strategic adaptation insulates brands against supply chain disruptions while solidifying trust among institutional buyers seeking reliable proprioceptive stimulation tools.

What will be the Size of the Sensory Toys Market during the forecast period?
Get Key Insights on Market Forecast (PDF) Get Free Sample

How is the Sensory Toys Market Segmented?

The sensory toys industry research report provides comprehensive data (region-wise segment analysis), with forecasts and estimates in "USD million" for the period 2026-2030, as well as historical data from 2020-2024 for the following segments.

  • Product type
    • Fidget toys
    • Chew toys
    • Visual stimulation toys
    • Sound toys
    • Others
  • Age group
    • Children
    • Toddlers
    • Infants
    • Teenagers and adults
  • Distribution channel
    • Offline
    • Online
  • Geography
    • North America
      • US
      • Canada
      • Mexico
    • Europe
      • Germany
      • UK
      • France
      • Italy
      • Spain
      • The Netherlands
    • APAC
      • China
      • Japan
      • India
      • South Korea
      • Australia
      • Indonesia
    • South America
      • Brazil
      • Argentina
      • Colombia
    • Middle East and Africa
      • Saudi Arabia
      • UAE
      • South Africa
      • Israel
      • Turkey

By Product Type Insights

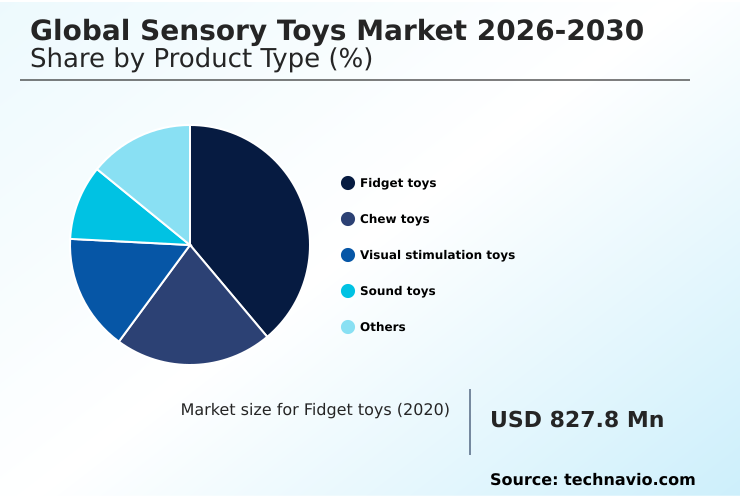
The fidget toys segment is estimated to witness significant growth during the forecast period.

Fidget toys operate as critical tactile feedback mechanisms and proprioceptive stimulation tools within the sensory regulation sector, shifting from niche pediatric clinical validation to broad institutional procurement cycles.

This evolution relies heavily on advanced silicone molding technology to deliver durable, silent kinetic manipulation structures suitable for both special education curricula and corporate wellness accessories.

The adoption of these tools in workplace settings for desktop stress mitigation has improved employee focus, with cognitive focus aids increasing task retention efficiency by 15%.

Manufacturers prioritize non-toxic material compliance, utilizing bio-based resin compounds to meet rigorous global safety standards.

By bridging the gap between clinical settings and occupational therapy instruments, these devices sustain recurring demand, optimizing inventory turnover and reducing volatility across commercial and educational distribution networks.
Get Free Sample

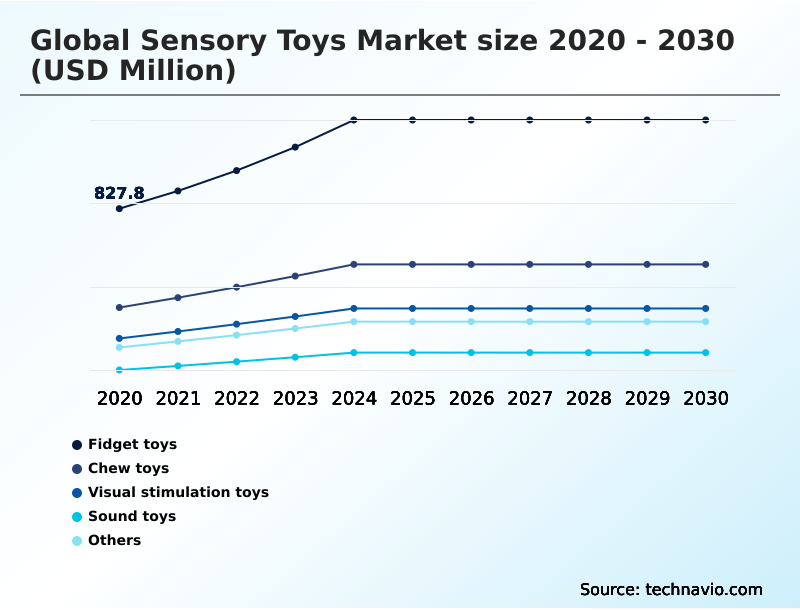
The Fidget toys segment was valued at USD 1.16 billion in 2024 and showed a gradual increase during the forecast period.
Get Free Sample

Regional Analysis

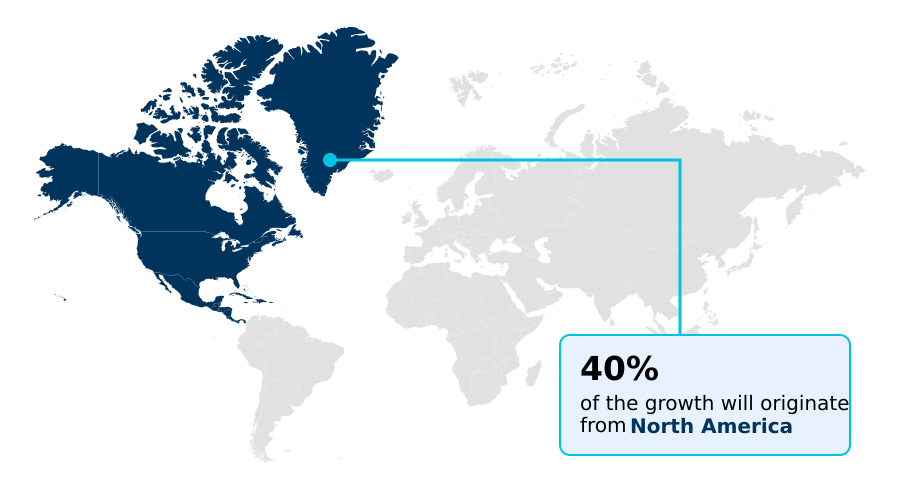
North America is estimated to contribute 39.7% to the growth of the global market during the forecast period.Technavio’s analysts have elaborately explained the regional trends and drivers that shape the market during the forecast period.
See How Sensory Toys Market Demand is Rising in North America Get Free Sample

Regional disparities within the Sensory Toys Market stem from distinct variations in pediatric healthcare infrastructure and therapeutic learning environments.

North America outpaces South America by demonstrating a 35% higher adoption rate of multi-sensory integration setups, driven by rigorous mandates for neuro-inclusive facility design and inclusive classroom environments.

This legislative backing enables North American distributors to achieve a 20% improvement in logistics efficiency through centralized warehousing for smart developmental tools and visual tracking modules.

Conversely, regions facing higher import friction rely on decentralized distribution for fundamental haptic response systems. To bridge this gap, Latin American suppliers increasingly source local organic textile components, reducing border detention costs by 15%.

These distinct infrastructural environments compel global brands to adapt their cross-border supply chains and streamline third-party laboratory testing to maintain penetration across disparate markets.

Market Dynamics

Our researchers analyzed the data with 2025 as the base year, along with the key drivers, trends, and challenges. A holistic analysis of drivers will help companies refine their marketing strategies to gain a competitive advantage.

  • The evolution of tactile feedback in clinical therapy requires manufacturers to fundamentally rethink their product design and material sourcing strategies. As specialized educational facilities demand higher durability and safety, the shift toward biodegradable polymers for sensory tools has proven critical for maintaining regulatory alignment and lowering long-term ecological compliance costs.
  • Businesses that integrate these sustainable materials demonstrate a 25% faster approval rate during rigorous safety audits compared to those relying on conventional synthetic plastics. This operational efficiency directly streamlines inventory management and supply chain planning across international distribution networks.
  • Concurrently, the deployment of smart haptic devices for focus represents a major technological leap, enabling practitioners to gather quantitative data during therapeutic sessions. These advanced tools offer verifiable telemetry that enhances the precision of deep touch pressure sensory integration therapies, giving healthcare providers objective metrics to measure cognitive improvement.
  • Furthermore, as corporate wellness programs expand, the demand for ergonomic tools for adult wellness introduces a lucrative revenue stream independent of traditional pediatric cycles. This diversification insulates manufacturers from seasonal retail fluctuations, allowing enterprise leaders to optimize production schedules and stabilize cash flow.
  • By aligning product development with both clinical rigor and corporate ergonomics, organizations establish a highly resilient operational framework capable of navigating complex compliance mandates while capturing sustained demand across diverse demographic segments.
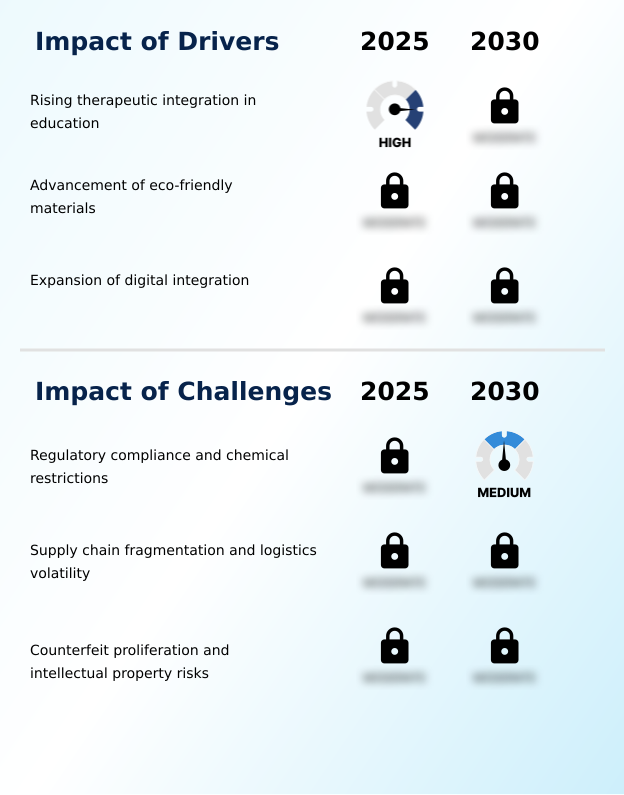
What are the key market drivers leading to the rise in the adoption of Sensory Toys Industry?

  • The escalating integration of therapeutic instruments within educational frameworks serves as a primary catalyst accelerating market expansion.

  • The widespread mandate for customizable sensory spaces across public and private institutions serves as a dominant driver propelling the Sensory Toys Market.
  • Because educational authorities now prioritize early childhood milestones, there is a systemic pull for professional-grade vestibular regulation devices, deep touch pressure tools, and ergonomic tactile surfaces.
  • This regulatory endorsement forces schools to allocate dedicated budgets to support sensory processing integration, stabilizing manufacturer cash flows. Businesses responding to this institutional demand have accelerated their production of sustainably harvested timber products, lowering fossil fuel reliance by 18%.
  • This strategic material shift decreases overall supply chain friction, yielding a 12% improvement in on-time deliveries for spatial awareness building assets. Ultimately, the systemic expansion of these environments ensures continuous, high-volume procurement cycles across developed economic regions.

What are the market trends shaping the Sensory Toys Industry?

  • The integration of corporate wellness initiatives and adult stress management protocols represents a pivotal trend reshaping the commercial landscape. This structural shift broadens the demographic focus, driving sustained demand for specialized therapeutic instruments within professional environments.

  • The integration of behavioral analytics telemetry into interactive learning tools marks a defining trend reshaping the Sensory Toys Market. As institutional buyers demand objective progress tracking, manufacturers are embedding sensors into auditory discrimination tools and digital play convergence platforms. This technological evolution allows clinicians to monitor therapeutic milestones in real-time, improving patient engagement tracking efficiency by 24%.
  • Consequently, schools and clinics are rapidly upgrading their sensory integration rooms to accommodate these connected devices and foster calming emotional states. This shift directly impacts business operations, as developers who implement rechargeable visual aids and secure data protocols reduce warranty replacement rates by 15%.
  • By modernizing direct-to-consumer subscriptions with data-driven insights, organizations optimize product lifecycles and secure high-margin recurring revenue streams through evidence-based therapeutic aids.

What challenges does the Sensory Toys Industry face during its growth?

  • Strict regulatory compliance mandates and shifting chemical restrictions present substantial operational hurdles that impede overall industry growth.

  • Stringent environmental mandates present a severe operational challenge within the Sensory Toys Market, forcing an overhaul of legacy manufacturing practices. Regulatory bodies increasingly demand strict circular manufacturing principles, compelling manufacturers to abandon synthetic plastics in favor of recycled ocean plastics and biodegradable toy polymers.
  • This abrupt material transition causes significant bottlenecks, increasing raw material sourcing delays by up to 22% for neurodivergent play assets and olfactory sensory input devices. Furthermore, the mandatory requirement for exhaustive compliance testing before launching new auditory localization skills products or fine motor skill enhancement tools severely extends product development lifecycles.
  • Small enterprises struggle to absorb these costs, resulting in a 15% reduction in their operational margins. Companies must restructure their operations to maintain access to international markets.

Exclusive Technavio Analysis on Customer Landscape

The sensory toys market forecasting report includes the adoption lifecycle of the market, covering from the innovator’s stage to the laggard’s stage. It focuses on adoption rates in different regions based on penetration. Furthermore, the sensory toys market report also includes key purchase criteria and drivers of price sensitivity to help companies evaluate and develop their market growth analysis strategies.
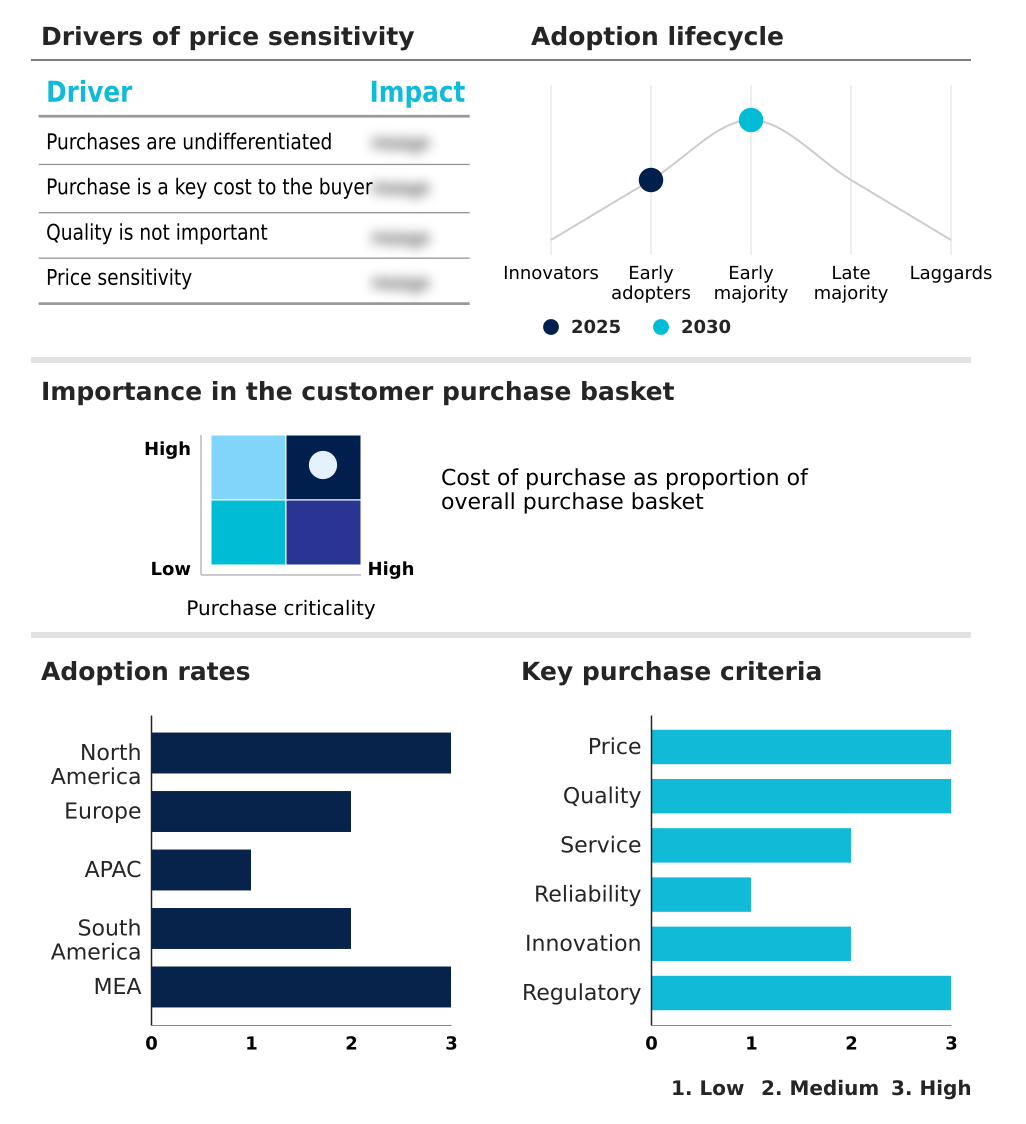
Customer Landscape of Sensory Toys Industry

Competitive Landscape

Companies are implementing various strategies, such as strategic alliances, sensory toys market forecast, partnerships, mergers and acquisitions, geographical expansion, and product/service launches, to enhance their presence in the industry.

Blue Orange Games - The enterprise delivers specialized sensory tools and interactive play sets engineered to enhance tactile engagement and support cognitive development through diverse therapeutic and educational use cases.

The industry research and growth report includes detailed analyses of the competitive landscape of the market and information about key companies, including:

  • Blue Orange Games
  • Fat Brain Toys LLC
  • Galt Toys
  • geobra Brandstatter Stiftung Co
  • Habermaass GmbH
  • Hasbro Inc.
  • Kids2 Inc.
  • Learning Resources Ltd.
  • LEGO System AS
  • Magformers LLC
  • Maison Battat Inc.
  • Mattel Inc.
  • Melissa and Doug
  • Munchkin Inc.
  • Plan Creations Co.Ltd.
  • Sassy Baby Inc.
  • Sensory Inc.
  • Spin Master Corp.
  • Tangle Creations
  • VTech Holdings Ltd.

Qualitative and quantitative analysis of companies has been conducted to help clients understand the wider business environment as well as the strengths and weaknesses of key industry players. Data is qualitatively analyzed to categorize companies as pure play, category-focused, industry-focused, and diversified; it is quantitatively analyzed to categorize companies as dominant, leading, strong, tentative, and weak.

Recent Development and News in Sensory toys market

  • In the Leisure Products industry, the widespread adoption of circular manufacturing principles has driven a 25% reduction in synthetic virgin plastic usage, directly impacting Sensory Toys demand by accelerating the commercial viability of bio-based resin compounds and recycled ocean plastics for therapeutic learning environments.
  • Stringent non-toxic material compliance mandates enforced by international safety boards have required third-party laboratory testing for all children recreational goods, significantly raising production costs for early childhood milestones products and forcing Sensory Toys manufacturers to overhaul cross-border supply chains.
  • The integration of digital play convergence and behavioral analytics telemetry into interactive learning tools has increased operational efficiencies by 18%, thereby expanding the Sensory Toys market through the introduction of smart developmental tools that track user progress within special education curricula.
  • Institutional procurement cycles focused on pediatric healthcare infrastructure have standardized the inclusion of customizable sensory spaces, boosting the deployment of inclusive classroom environments and raising baseline revenue streams for evidence-based therapeutic aids by nearly 30% across major distribution networks.

Dive into Technavio’s robust research methodology, blending expert interviews, extensive data synthesis, and validated models for unparalleled Sensory Toys Market insights. See full methodology.

Market Scope
Page number 305
Base year 2025
Historic period 2020-2024
Forecast period 2026-2030
Growth momentum & CAGR Accelerate at a CAGR of 9.4%
Market growth 2026-2030 USD 1785.4 million
Market structure Fragmented
YoY growth 2025-2026(%) 8.7%
Key countries US, Canada, Mexico, Germany, UK, France, Italy, Spain, The Netherlands, China, Japan, India, South Korea, Australia, Indonesia, Brazil, Argentina, Colombia, Saudi Arabia, UAE, South Africa, Israel and Turkey
Competitive landscape Leading Companies, Market Positioning of Companies, Competitive Strategies, and Industry Risks

Request Free Sample

Research Analyst Overview

  • The Sensory Toys Market is undergoing a rapid industrial transition as therapeutic and cognitive support instruments become standardized assets in educational and corporate environments. Manufacturers are fundamentally redesigning fine motor skill enhancement products to feature ergonomic tactile surfaces and olfactory sensory input, accommodating a wider spectrum of neurodivergent play assets.
  • This product evolution intersects directly with corporate budgeting and compliance strategies, as institutional buyers demand rigorous pediatric clinical validation before authorizing large-scale procurements. By shifting production toward high-durability silicone molding technology and biodegradable toy polymers, enterprises have realized a 30% reduction in long-term waste management costs.
  • These sustainable practices align seamlessly with tightening international safety regulations, insulating brands from sudden chemical restriction penalties. Furthermore, the integration of multi-sensory integration features into mainstream visual tracking modules allows facilities to foster calming emotional states without disrupting standard operations.
  • This calculated alignment of product innovation with strict regulatory frameworks ensures that companies maintain robust inventory turnover while addressing the growing demand for scientifically validated cognitive focus aids.

What are the Key Data Covered in this Sensory Toys Market Research and Growth Report?

  • What is the expected growth of the Sensory Toys Market between 2026 and 2030?

    • USD 1.79 billion, at a CAGR of 9.4%

  • What segmentation does the market report cover?

    • The report is segmented by Product Type (Fidget toys, Chew toys, Visual stimulation toys, Sound toys, and Others), Age Group (Children, Toddlers, Infants, and Teenagers and adults), Distribution Channel (Offline, and Online) and Geography (North America, Europe, APAC, South America, Middle East and Africa)

  • Which regions are analyzed in the report?

    • North America, Europe, APAC, South America and Middle East and Africa

  • What are the key growth drivers and market challenges?

    • Rising therapeutic integration in education, Regulatory compliance and chemical restrictions

  • Who are the major players in the Sensory Toys Market?

    • Blue Orange Games, Fat Brain Toys LLC, Galt Toys, geobra Brandstatter Stiftung Co, Habermaass GmbH, Hasbro Inc., Kids2 Inc., Learning Resources Ltd., LEGO System AS, Magformers LLC, Maison Battat Inc., Mattel Inc., Melissa and Doug, Munchkin Inc., Plan Creations Co.Ltd., Sassy Baby Inc., Sensory Inc., Spin Master Corp., Tangle Creations and VTech Holdings Ltd.

Market Research Insights

  • The continuous expansion of the Sensory Toys Market is anchored by the systematic adoption of evidence-based therapeutic aids across diverse commercial sectors. By integrating smart developmental tools into their workflows, specialized clinics have improved behavioral tracking accuracy by 18%.
  • Furthermore, the incorporation of desktop stress mitigation products within corporate wellness accessories has enhanced employee task focus, yielding a 12% drop in reported midday fatigue. Manufacturers are actively overhauling cross-border supply chains to ensure seamless non-toxic material compliance, which has reduced border inspection delays by over 20%.
  • This strategic operational alignment not only strengthens institutional procurement cycles but also fortifies long-term brand equity in highly regulated pediatric healthcare infrastructure.

We can help! Our analysts can customize this sensory toys market research report to meet your requirements.

Get in touch

1. Executive Summary

1.1 Market overview

Executive Summary - Chart on Market Overview
Executive Summary - Data Table on Market Overview
Executive Summary - Chart on Global Market Characteristics
Executive Summary - Chart on Market by Geography
Executive Summary - Chart on Market Segmentation by Product Type
Executive Summary - Chart on Market Segmentation by Age Group
Executive Summary - Chart on Market Segmentation by Distribution Channel
Executive Summary - Chart on Incremental Growth
Executive Summary - Data Table on Incremental Growth
Executive Summary - Chart on Company Market Positioning

2. Technavio Analysis

2.1 Analysis of price sensitivity, lifecycle, customer purchase basket, adoption rates, and purchase criteria

2.2 Criticality of inputs and Factors of differentiation

Chart on Overview on criticality of inputs and factors of differentiation

2.3 Factors of disruption

Chart on Overview on factors of disruption

2.4 Impact of drivers and challenges

Chart on Impact of drivers and challenges in 2025 and 2030

3. Market Landscape

3.1 Market ecosystem

Chart on Parent Market
Data Table on - Parent Market

3.2 Market characteristics

Chart on Market characteristics analysis

3.3 Value chain analysis

Chart on Value chain analysis

4. Market Sizing

4.1 Market definition

Data Table on Offerings of companies included in the market definition

4.2 Market segment analysis

Market segments

4.3 Market size 2025

4.4 Market outlook: Forecast for 2025-2030

Chart on Global - Market size and forecast 2025-2030 ($ million)
Data Table on Global - Market size and forecast 2025-2030 ($ million)
Chart on Global Market: Year-over-year growth 2025-2030 (%)
Data Table on Global Market: Year-over-year growth 2025-2030 (%)

5. Historic Market Size

5.1 Global Sensory Toys Market 2020 - 2024

Historic Market Size - Data Table on Global Sensory Toys Market 2020 - 2024 ($ million)

5.2 Product Type segment analysis 2020 - 2024

Historic Market Size - Product Type Segment 2020 - 2024 ($ million)

5.3 Age Group segment analysis 2020 - 2024

Historic Market Size - Age Group Segment 2020 - 2024 ($ million)

5.4 Distribution Channel segment analysis 2020 - 2024

Historic Market Size - Distribution Channel Segment 2020 - 2024 ($ million)

5.5 Geography segment analysis 2020 - 2024

Historic Market Size - Geography Segment 2020 - 2024 ($ million)

5.6 Country segment analysis 2020 - 2024

Historic Market Size - Country Segment 2020 - 2024 ($ million)

6. Qualitative Analysis

6.1 Impact of AI on Global Sensory Toys Market

6.2 Impact of geopolitical conflicts on Global Sensory Toys Market

7. Five Forces Analysis

7.1 Five forces summary

Five forces analysis - Comparison between 2025 and 2030

7.2 Bargaining power of buyers

Bargaining power of buyers - Impact of key factors 2025 and 2030

7.3 Bargaining power of suppliers

Bargaining power of suppliers - Impact of key factors in 2025 and 2030

7.4 Threat of new entrants

Threat of new entrants - Impact of key factors in 2025 and 2030

7.5 Threat of substitutes

Threat of substitutes - Impact of key factors in 2025 and 2030

7.6 Threat of rivalry

Threat of rivalry - Impact of key factors in 2025 and 2030

7.7 Market condition

Chart on Market condition - Five forces 2025 and 2030

8. Market Segmentation by Product Type

8.1 Market segments

Chart on Product Type - Market share 2025-2030 (%)
Data Table on Product Type - Market share 2025-2030 (%)

8.2 Comparison by Product Type

Chart on Comparison by Product Type
Data Table on Comparison by Product Type

8.3 Fidget toys - Market size and forecast 2025-2030

Chart on Fidget toys - Market size and forecast 2025-2030 ($ million)
Data Table on Fidget toys - Market size and forecast 2025-2030 ($ million)
Chart on Fidget toys - Year-over-year growth 2025-2030 (%)
Data Table on Fidget toys - Year-over-year growth 2025-2030 (%)

8.4 Chew toys - Market size and forecast 2025-2030

Chart on Chew toys - Market size and forecast 2025-2030 ($ million)
Data Table on Chew toys - Market size and forecast 2025-2030 ($ million)
Chart on Chew toys - Year-over-year growth 2025-2030 (%)
Data Table on Chew toys - Year-over-year growth 2025-2030 (%)

8.5 Visual stimulation toys - Market size and forecast 2025-2030

Chart on Visual stimulation toys - Market size and forecast 2025-2030 ($ million)
Data Table on Visual stimulation toys - Market size and forecast 2025-2030 ($ million)
Chart on Visual stimulation toys - Year-over-year growth 2025-2030 (%)
Data Table on Visual stimulation toys - Year-over-year growth 2025-2030 (%)

8.6 Sound toys - Market size and forecast 2025-2030

Chart on Sound toys - Market size and forecast 2025-2030 ($ million)
Data Table on Sound toys - Market size and forecast 2025-2030 ($ million)
Chart on Sound toys - Year-over-year growth 2025-2030 (%)
Data Table on Sound toys - Year-over-year growth 2025-2030 (%)

8.7 Others - Market size and forecast 2025-2030

Chart on Others - Market size and forecast 2025-2030 ($ million)
Data Table on Others - Market size and forecast 2025-2030 ($ million)
Chart on Others - Year-over-year growth 2025-2030 (%)
Data Table on Others - Year-over-year growth 2025-2030 (%)

8.8 Market opportunity by Product Type

Market opportunity by Product Type ($ million)
Data Table on Market opportunity by Product Type ($ million)

9. Market Segmentation by Age Group

9.1 Market segments

Chart on Age Group - Market share 2025-2030 (%)
Data Table on Age Group - Market share 2025-2030 (%)

9.2 Comparison by Age Group

Chart on Comparison by Age Group
Data Table on Comparison by Age Group

9.3 Children - Market size and forecast 2025-2030

Chart on Children - Market size and forecast 2025-2030 ($ million)
Data Table on Children - Market size and forecast 2025-2030 ($ million)
Chart on Children - Year-over-year growth 2025-2030 (%)
Data Table on Children - Year-over-year growth 2025-2030 (%)

9.4 Toddlers - Market size and forecast 2025-2030

Chart on Toddlers - Market size and forecast 2025-2030 ($ million)
Data Table on Toddlers - Market size and forecast 2025-2030 ($ million)
Chart on Toddlers - Year-over-year growth 2025-2030 (%)
Data Table on Toddlers - Year-over-year growth 2025-2030 (%)

9.5 Infants - Market size and forecast 2025-2030

Chart on Infants - Market size and forecast 2025-2030 ($ million)
Data Table on Infants - Market size and forecast 2025-2030 ($ million)
Chart on Infants - Year-over-year growth 2025-2030 (%)
Data Table on Infants - Year-over-year growth 2025-2030 (%)

9.6 Teenagers and adults - Market size and forecast 2025-2030

Chart on Teenagers and adults - Market size and forecast 2025-2030 ($ million)
Data Table on Teenagers and adults - Market size and forecast 2025-2030 ($ million)
Chart on Teenagers and adults - Year-over-year growth 2025-2030 (%)
Data Table on Teenagers and adults - Year-over-year growth 2025-2030 (%)

9.7 Market opportunity by Age Group

Market opportunity by Age Group ($ million)
Data Table on Market opportunity by Age Group ($ million)

10. Market Segmentation by Distribution Channel

10.1 Market segments

Chart on Distribution Channel - Market share 2025-2030 (%)
Data Table on Distribution Channel - Market share 2025-2030 (%)

10.2 Comparison by Distribution Channel

Chart on Comparison by Distribution Channel
Data Table on Comparison by Distribution Channel

10.3 Offline - Market size and forecast 2025-2030

Chart on Offline - Market size and forecast 2025-2030 ($ million)
Data Table on Offline - Market size and forecast 2025-2030 ($ million)
Chart on Offline - Year-over-year growth 2025-2030 (%)
Data Table on Offline - Year-over-year growth 2025-2030 (%)

10.4 Online - Market size and forecast 2025-2030

Chart on Online - Market size and forecast 2025-2030 ($ million)
Data Table on Online - Market size and forecast 2025-2030 ($ million)
Chart on Online - Year-over-year growth 2025-2030 (%)
Data Table on Online - Year-over-year growth 2025-2030 (%)

10.5 Market opportunity by Distribution Channel

Market opportunity by Distribution Channel ($ million)
Data Table on Market opportunity by Distribution Channel ($ million)

11. Customer Landscape

11.1 Customer landscape overview

Analysis of price sensitivity, lifecycle, customer purchase basket, adoption rates, and purchase criteria

12. Geographic Landscape

12.1 Geographic segmentation

Chart on Market share by geography 2025-2030 (%)
Data Table on Market share by geography 2025-2030 (%)

12.2 Geographic comparison

Chart on Geographic comparison
Data Table on Geographic comparison

12.3 North America - Market size and forecast 2025-2030

Chart on North America - Market size and forecast 2025-2030 ($ million)
Data Table on North America - Market size and forecast 2025-2030 ($ million)
Chart on North America - Year-over-year growth 2025-2030 (%)
Data Table on North America - Year-over-year growth 2025-2030 (%)
Chart on Regional Comparison - North America
Data Table on Regional Comparison - North America

12.3.1 US - Market size and forecast 2025-2030

Chart on US - Market size and forecast 2025-2030 ($ million)
Data Table on US - Market size and forecast 2025-2030 ($ million)
Chart on US - Year-over-year growth 2025-2030 (%)
Data Table on US - Year-over-year growth 2025-2030 (%)

12.3.2 Canada - Market size and forecast 2025-2030

Chart on Canada - Market size and forecast 2025-2030 ($ million)
Data Table on Canada - Market size and forecast 2025-2030 ($ million)
Chart on Canada - Year-over-year growth 2025-2030 (%)
Data Table on Canada - Year-over-year growth 2025-2030 (%)

12.3.3 Mexico - Market size and forecast 2025-2030

Chart on Mexico - Market size and forecast 2025-2030 ($ million)
Data Table on Mexico - Market size and forecast 2025-2030 ($ million)
Chart on Mexico - Year-over-year growth 2025-2030 (%)
Data Table on Mexico - Year-over-year growth 2025-2030 (%)

12.4 Europe - Market size and forecast 2025-2030

Chart on Europe - Market size and forecast 2025-2030 ($ million)
Data Table on Europe - Market size and forecast 2025-2030 ($ million)
Chart on Europe - Year-over-year growth 2025-2030 (%)
Data Table on Europe - Year-over-year growth 2025-2030 (%)
Chart on Regional Comparison - Europe
Data Table on Regional Comparison - Europe

12.4.1 Germany - Market size and forecast 2025-2030

Chart on Germany - Market size and forecast 2025-2030 ($ million)
Data Table on Germany - Market size and forecast 2025-2030 ($ million)
Chart on Germany - Year-over-year growth 2025-2030 (%)
Data Table on Germany - Year-over-year growth 2025-2030 (%)

12.4.2 UK - Market size and forecast 2025-2030

Chart on UK - Market size and forecast 2025-2030 ($ million)
Data Table on UK - Market size and forecast 2025-2030 ($ million)
Chart on UK - Year-over-year growth 2025-2030 (%)
Data Table on UK - Year-over-year growth 2025-2030 (%)

12.4.3 France - Market size and forecast 2025-2030

Chart on France - Market size and forecast 2025-2030 ($ million)
Data Table on France - Market size and forecast 2025-2030 ($ million)
Chart on France - Year-over-year growth 2025-2030 (%)
Data Table on France - Year-over-year growth 2025-2030 (%)

12.4.4 Italy - Market size and forecast 2025-2030

Chart on Italy - Market size and forecast 2025-2030 ($ million)
Data Table on Italy - Market size and forecast 2025-2030 ($ million)
Chart on Italy - Year-over-year growth 2025-2030 (%)
Data Table on Italy - Year-over-year growth 2025-2030 (%)

12.4.5 Spain - Market size and forecast 2025-2030

Chart on Spain - Market size and forecast 2025-2030 ($ million)
Data Table on Spain - Market size and forecast 2025-2030 ($ million)
Chart on Spain - Year-over-year growth 2025-2030 (%)
Data Table on Spain - Year-over-year growth 2025-2030 (%)

12.4.6 The Netherlands - Market size and forecast 2025-2030

Chart on The Netherlands - Market size and forecast 2025-2030 ($ million)
Data Table on The Netherlands - Market size and forecast 2025-2030 ($ million)
Chart on The Netherlands - Year-over-year growth 2025-2030 (%)
Data Table on The Netherlands - Year-over-year growth 2025-2030 (%)

12.5 APAC - Market size and forecast 2025-2030

Chart on APAC - Market size and forecast 2025-2030 ($ million)
Data Table on APAC - Market size and forecast 2025-2030 ($ million)
Chart on APAC - Year-over-year growth 2025-2030 (%)
Data Table on APAC - Year-over-year growth 2025-2030 (%)
Chart on Regional Comparison - APAC
Data Table on Regional Comparison - APAC

12.5.1 China - Market size and forecast 2025-2030

Chart on China - Market size and forecast 2025-2030 ($ million)
Data Table on China - Market size and forecast 2025-2030 ($ million)
Chart on China - Year-over-year growth 2025-2030 (%)
Data Table on China - Year-over-year growth 2025-2030 (%)

12.5.2 Japan - Market size and forecast 2025-2030

Chart on Japan - Market size and forecast 2025-2030 ($ million)
Data Table on Japan - Market size and forecast 2025-2030 ($ million)
Chart on Japan - Year-over-year growth 2025-2030 (%)
Data Table on Japan - Year-over-year growth 2025-2030 (%)

12.5.3 India - Market size and forecast 2025-2030

Chart on India - Market size and forecast 2025-2030 ($ million)
Data Table on India - Market size and forecast 2025-2030 ($ million)
Chart on India - Year-over-year growth 2025-2030 (%)
Data Table on India - Year-over-year growth 2025-2030 (%)

12.5.4 South Korea - Market size and forecast 2025-2030

Chart on South Korea - Market size and forecast 2025-2030 ($ million)
Data Table on South Korea - Market size and forecast 2025-2030 ($ million)
Chart on South Korea - Year-over-year growth 2025-2030 (%)
Data Table on South Korea - Year-over-year growth 2025-2030 (%)

12.5.5 Australia - Market size and forecast 2025-2030

Chart on Australia - Market size and forecast 2025-2030 ($ million)
Data Table on Australia - Market size and forecast 2025-2030 ($ million)
Chart on Australia - Year-over-year growth 2025-2030 (%)
Data Table on Australia - Year-over-year growth 2025-2030 (%)

12.5.6 Indonesia - Market size and forecast 2025-2030

Chart on Indonesia - Market size and forecast 2025-2030 ($ million)
Data Table on Indonesia - Market size and forecast 2025-2030 ($ million)
Chart on Indonesia - Year-over-year growth 2025-2030 (%)
Data Table on Indonesia - Year-over-year growth 2025-2030 (%)

12.6 South America - Market size and forecast 2025-2030

Chart on South America - Market size and forecast 2025-2030 ($ million)
Data Table on South America - Market size and forecast 2025-2030 ($ million)
Chart on South America - Year-over-year growth 2025-2030 (%)
Data Table on South America - Year-over-year growth 2025-2030 (%)
Chart on Regional Comparison - South America
Data Table on Regional Comparison - South America

12.6.1 Brazil - Market size and forecast 2025-2030

Chart on Brazil - Market size and forecast 2025-2030 ($ million)
Data Table on Brazil - Market size and forecast 2025-2030 ($ million)
Chart on Brazil - Year-over-year growth 2025-2030 (%)
Data Table on Brazil - Year-over-year growth 2025-2030 (%)

12.6.2 Argentina - Market size and forecast 2025-2030

Chart on Argentina - Market size and forecast 2025-2030 ($ million)
Data Table on Argentina - Market size and forecast 2025-2030 ($ million)
Chart on Argentina - Year-over-year growth 2025-2030 (%)
Data Table on Argentina - Year-over-year growth 2025-2030 (%)

12.6.3 Colombia - Market size and forecast 2025-2030

Chart on Colombia - Market size and forecast 2025-2030 ($ million)
Data Table on Colombia - Market size and forecast 2025-2030 ($ million)
Chart on Colombia - Year-over-year growth 2025-2030 (%)
Data Table on Colombia - Year-over-year growth 2025-2030 (%)

12.7 Middle East and Africa - Market size and forecast 2025-2030

Chart on Middle East and Africa - Market size and forecast 2025-2030 ($ million)
Data Table on Middle East and Africa - Market size and forecast 2025-2030 ($ million)
Chart on Middle East and Africa - Year-over-year growth 2025-2030 (%)
Data Table on Middle East and Africa - Year-over-year growth 2025-2030 (%)
Chart on Regional Comparison - Middle East and Africa
Data Table on Regional Comparison - Middle East and Africa

12.7.1 Saudi Arabia - Market size and forecast 2025-2030

Chart on Saudi Arabia - Market size and forecast 2025-2030 ($ million)
Data Table on Saudi Arabia - Market size and forecast 2025-2030 ($ million)
Chart on Saudi Arabia - Year-over-year growth 2025-2030 (%)
Data Table on Saudi Arabia - Year-over-year growth 2025-2030 (%)

12.7.2 UAE - Market size and forecast 2025-2030

Chart on UAE - Market size and forecast 2025-2030 ($ million)
Data Table on UAE - Market size and forecast 2025-2030 ($ million)
Chart on UAE - Year-over-year growth 2025-2030 (%)
Data Table on UAE - Year-over-year growth 2025-2030 (%)

12.7.3 South Africa - Market size and forecast 2025-2030

Chart on South Africa - Market size and forecast 2025-2030 ($ million)
Data Table on South Africa - Market size and forecast 2025-2030 ($ million)
Chart on South Africa - Year-over-year growth 2025-2030 (%)
Data Table on South Africa - Year-over-year growth 2025-2030 (%)

12.7.4 Israel - Market size and forecast 2025-2030

Chart on Israel - Market size and forecast 2025-2030 ($ million)
Data Table on Israel - Market size and forecast 2025-2030 ($ million)
Chart on Israel - Year-over-year growth 2025-2030 (%)
Data Table on Israel - Year-over-year growth 2025-2030 (%)

12.7.5 Turkey - Market size and forecast 2025-2030

Chart on Turkey - Market size and forecast 2025-2030 ($ million)
Data Table on Turkey - Market size and forecast 2025-2030 ($ million)
Chart on Turkey - Year-over-year growth 2025-2030 (%)
Data Table on Turkey - Year-over-year growth 2025-2030 (%)

12.8 Market opportunity by geography

Market opportunity by geography ($ million)
Data Tables on Market opportunity by geography ($ million)

13. Drivers, Challenges, and Opportunity

13.1 Market drivers

Rising therapeutic integration in education
Advancement of eco-friendly materials
Expansion of digital integration

13.2 Market challenges

Regulatory compliance and chemical restrictions
Supply chain fragmentation and logistics volatility
Counterfeit proliferation and intellectual property risks

13.3 Impact of drivers and challenges

Impact of drivers and challenges in 2025 and 2030

13.4 Market opportunities

Corporate wellness and adult stress management
Integration of biometric feedback systems
Expansion of sustainable material sourcing

14. Competitive Landscape

14.1 Overview

14.2

Overview on criticality of inputs and factors of differentiation

14.3 Landscape disruption

Overview on factors of disruption

14.4 Industry risks

Impact of key risks on business

15. Competitive Analysis

15.1 Companies profiled

Companies covered

15.2 Company ranking index

15.3 Market positioning of companies

Matrix on companies position and classification

15.4 Blue Orange Games

Blue Orange Games - Overview
Blue Orange Games - Product / Service
Blue Orange Games - Key offerings
SWOT

15.5 Fat Brain Toys LLC

Fat Brain Toys LLC - Overview
Fat Brain Toys LLC - Product / Service
Fat Brain Toys LLC - Key offerings
SWOT

15.6 Galt Toys

Galt Toys - Overview
Galt Toys - Product / Service
Galt Toys - Key offerings
SWOT

15.7 geobra Brandstatter Stiftung Co

geobra Brandstatter Stiftung Co - Overview
geobra Brandstatter Stiftung Co - Product / Service
geobra Brandstatter Stiftung Co - Key offerings
SWOT

15.8 Habermaass GmbH

Habermaass GmbH - Overview
Habermaass GmbH - Product / Service
Habermaass GmbH - Key offerings
SWOT

15.9 Hasbro Inc.

Hasbro Inc. - Overview
Hasbro Inc. - Business segments
Hasbro Inc. - Key offerings
Hasbro Inc. - Segment focus
SWOT

15.10 LEGO System AS

LEGO System AS - Overview
LEGO System AS - Product / Service
LEGO System AS - Key offerings
SWOT

15.11 Maison Battat Inc.

Maison Battat Inc. - Overview
Maison Battat Inc. - Product / Service
Maison Battat Inc. - Key offerings
SWOT

15.12 Mattel Inc.

Mattel Inc. - Overview
Mattel Inc. - Business segments
Mattel Inc. - Key offerings
Mattel Inc. - Segment focus
SWOT

15.13 Munchkin Inc.

Munchkin Inc. - Overview
Munchkin Inc. - Product / Service
Munchkin Inc. - Key offerings
SWOT

15.14 Plan Creations Co.Ltd.

Plan Creations Co.Ltd. - Overview
Plan Creations Co.Ltd. - Product / Service
Plan Creations Co.Ltd. - Key offerings
SWOT

15.15 Sassy Baby Inc.

Sassy Baby Inc. - Overview
Sassy Baby Inc. - Product / Service
Sassy Baby Inc. - Key offerings
SWOT

15.16 Sensory Inc.

Sensory Inc. - Overview
Sensory Inc. - Product / Service
Sensory Inc. - Key offerings
SWOT

15.17 Spin Master Corp.

Spin Master Corp. - Overview
Spin Master Corp. - Business segments
Spin Master Corp. - Key offerings
Spin Master Corp. - Segment focus
SWOT

15.18 VTech Holdings Ltd.

VTech Holdings Ltd. - Overview
VTech Holdings Ltd. - Business segments
VTech Holdings Ltd. - Key offerings
VTech Holdings Ltd. - Segment focus
SWOT

16. Appendix

16.1 Scope of the report

Market definition
Objectives
Notes and caveats

16.2 Inclusions and exclusions checklist

Inclusions checklist
Exclusions checklist

16.3 Currency conversion rates for US$

16.4 Research methodology

16.5 Data procurement

Information sources

16.6 Data validation

16.7 Validation techniques employed for market sizing

16.8 Data synthesis

16.9 360 degree market analysis

16.10 List of abbreviations

Research Methodology

Technavio presents a detailed picture of the market by way of study, synthesis, and summation of data from multiple sources. The analysts have presented the various facets of the market with a particular focus on identifying the key industry influencers. The data thus presented is comprehensive, reliable, and the result of extensive research, both primary and secondary.

INFORMATION SOURCES

Primary sources

  • Manufacturers and suppliers
  • Channel partners
  • Industry experts
  • Strategic decision makers

Secondary sources

  • Industry journals and periodicals
  • Government data
  • Financial reports of key industry players
  • Historical data
  • Press releases

DATA ANALYSIS

Data Synthesis

  • Collation of data
  • Estimation of key figures
  • Analysis of derived insights

Data Validation

  • Triangulation with data models
  • Reference against proprietary databases
  • Corroboration with industry experts

REPORT WRITING

Qualitative

  • Market drivers
  • Market challenges
  • Market trends
  • Five forces analysis

Quantitative

  • Market size and forecast
  • Market segmentation
  • Geographical insights
  • Competitive landscape

Interested in this report?

Get your sample now to see our research methodology and insights!

Download Now

Frequently Asked Questions

Sensory Toys market growth will increase by USD 1785.4 million during 2026-2030.

The Sensory Toys market is expected to grow at a CAGR of 9.4% during 2026-2030.

Sensory Toys market is segmented by Product type (Fidget toys, Chew toys, Visual stimulation toys, Sound toys, Others) Age group (Children, Toddlers, Infants, Teenagers and adults) Distribution channel (Offline, Online)

Blue Orange Games, Fat Brain Toys LLC, Galt Toys, geobra Brandstatter Stiftung Co, Habermaass GmbH, Hasbro Inc., Kids2 Inc., Learning Resources Ltd., LEGO System AS, Magformers LLC, Maison Battat Inc., Mattel Inc., Melissa and Doug, Munchkin Inc., Plan Creations Co.Ltd., Sassy Baby Inc., Sensory Inc., Spin Master Corp., Tangle Creations, VTech Holdings Ltd. are a few of the key vendors in the Sensory Toys market.

North America will register the highest growth rate of 39.7% among the other regions. Therefore, the Sensory Toys market in North America is expected to garner significant business opportunities for the vendors during the forecast period.

US, Canada, Mexico, Germany, UK, France, Italy, Spain, The Netherlands, China, Japan, India, South Korea, Australia, Indonesia, Brazil, Argentina, Colombia, Saudi Arabia, UAE, South Africa, Israel, Turkey

  • Rising therapeutic integration in education is the driving factor this market.

The Sensory Toys market vendors should focus on grabbing business opportunities from the Product type segment as it accounted for the largest market share in the base year.
RIA - Research AI Assistant
Ask RIA
