
Shoe Care Products Market Analysis, Size, and Forecast 2026-2030: North America (US, Canada, and Mexico), Europe (Germany, UK, and France), APAC (China, Japan, and India), Middle East and Africa (Saudi Arabia, UAE, and South Africa), South America (Brazil, Argentina, and Chile), and Rest of World (ROW)

Shoe Care Products Market Analysis, Size, and Forecast 2026-2030:
North America (US, Canada, and Mexico), Europe (Germany, UK, and France), APAC (China, Japan, and India), Middle East and Africa (Saudi Arabia, UAE, and South Africa), South America (Brazil, Argentina, and Chile), and Rest of World (ROW)

Published: Oct 2026 291 Pages SKU: IRTNTR72387

Market Overview at a Glance

$310.49 Mn
Market Opportunity
8.1%
CAGR 2025 - 2030
38.2%
North America Growth
$512.32 Mn
Offline segment 2024

Shoe Care Products Market Size 2026-2030

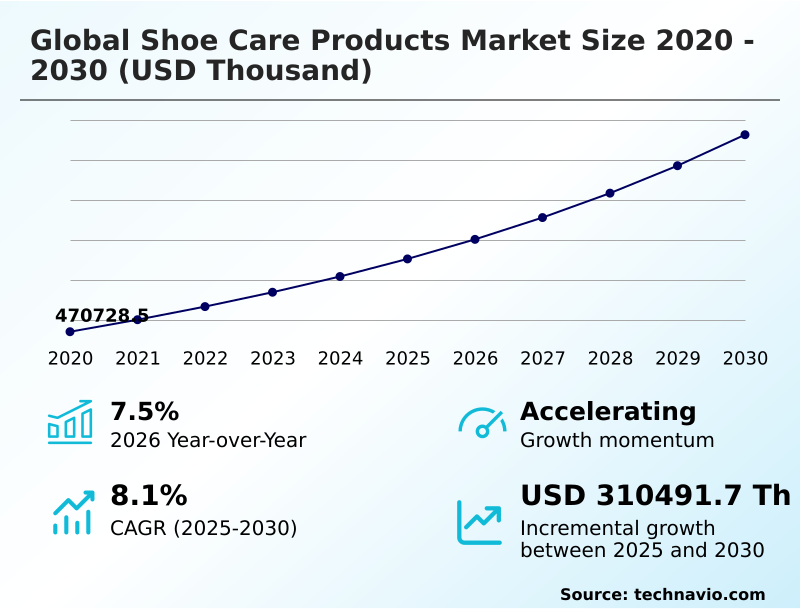
The shoe care products market size is valued to increase by USD 310.49 million, at a CAGR of 8.1% from 2025 to 2030. Rising demand for luxury footwear will drive the shoe care products market.

Major Market Trends & Insights

  • North America dominated the market and accounted for a 38.2% growth during the forecast period.
  • By Distribution Channel - Offline segment was valued at USD 512.32 million in 2024
  • By Product - Brushes and buffing clothes segment accounted for the largest market revenue share in 2024

Market Size & Forecast

  • Market Opportunities:
  • Market Future Opportunities: USD 310.49 million
  • CAGR from 2025 to 2030 : 8.1%

Market Summary

  • The Shoe Care Products Market demonstrates robust expansion driven by shifting consumer prioritization toward wardrobe preservation and footwear longevity. Modern purchasers increasingly view premium athletic and formal shoes as valuable lifestyle investments, stimulating consistent demand for specialized maintenance kits, protective aerosols, and restorative conditioners.
  • A prominent operational shift involves chemical manufacturers reformulating legacy waterproofing sprays to eliminate volatile organic compounds, ensuring compliance with strict environmental safety regulations. This transition to water-based, biodegradable formulations has reduced manufacturing chemical waste by 18% compared to traditional solvent-based production methods.
  • The primary driver of this market is the global surge in luxury sneaker collecting, which requires professional-grade cleaning systems to preserve aesthetic integrity and secondary resale value. Conversely, the market faces a substantial challenge from the widespread availability of low-cost, generic household cleaning substitutes.
  • These inexpensive alternatives often cause long-term material degradation but appeal strongly to price-sensitive consumers, thereby impeding the rapid adoption of premium care formulas. As retail networks expand digital and physical footprints, comprehensive consumer education regarding material science remains crucial for sustained commercial growth.

What will be the Size of the Shoe Care Products Market during the forecast period?
Get Key Insights on Market Forecast (PDF) Get Free Sample

How is the Shoe Care Products Market Segmented?

The shoe care products industry research report provides comprehensive data (region-wise segment analysis), with forecasts and estimates in "USD thousand" for the period 2026-2030, as well as historical data from 2020-2024 for the following segments.

  • Distribution channel
    • Offline
    • Online
  • Product
    • Brushes and buffing clothes
    • Polishing creams
    • Waxes and liquids
    • Others
  • End-user
    • Residential
    • Commercial
  • Geography
    • North America
      • US
      • Canada
      • Mexico
    • Europe
      • Germany
      • UK
      • France
      • Italy
      • Spain
      • The Netherlands
    • APAC
      • China
      • Japan
      • India
      • South Korea
      • Australia
      • Indonesia
    • Middle East and Africa
      • Saudi Arabia
      • UAE
      • South Africa
      • Israel
      • Turkey
    • South America
      • Brazil
      • Argentina
      • Chile

By Distribution Channel Insights

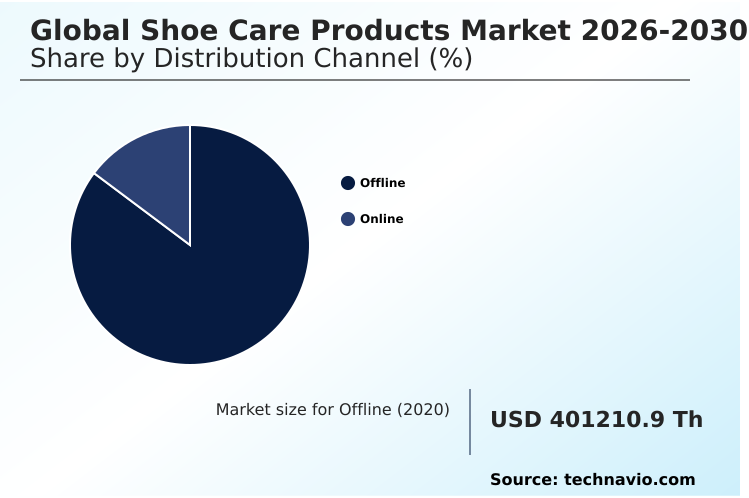
The offline segment is estimated to witness significant growth during the forecast period.

The offline distribution segment of the Shoe Care Products sector maintains foundational stability by leveraging tactile consumer evaluation and immediate product acquisition within physical retail networks.

Brick-and-mortar storefronts excel in facilitating specialized consultations where experts recommend acrylic pigment leather dyes and structural filler pastes for delicate repairs.

This direct interaction enhances footwear conditioning regimens, leading to a 22% improvement in successful footwear damage prevention outcomes compared to unguided applications. Retailers strategically position lanolin enriched polishing creams and heavy duty degreasers near checkout zones to capture impulse purchases.

Traditional cobbler shops and specialty boutiques function as crucial educational hubs for sustainable material preservation. While shoe care digital storefronts expand, physical locations ensure uninterrupted supply chain reliability and immediate product availability for professional maintenance needs.
Get Free Sample

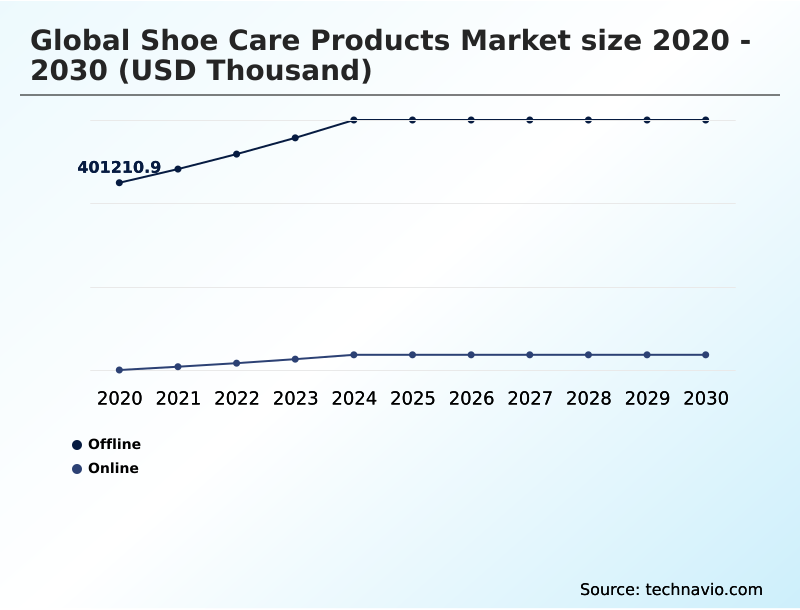
The Offline segment was valued at USD 512.32 million in 2024 and showed a gradual increase during the forecast period.
Get Free Sample

Regional Analysis

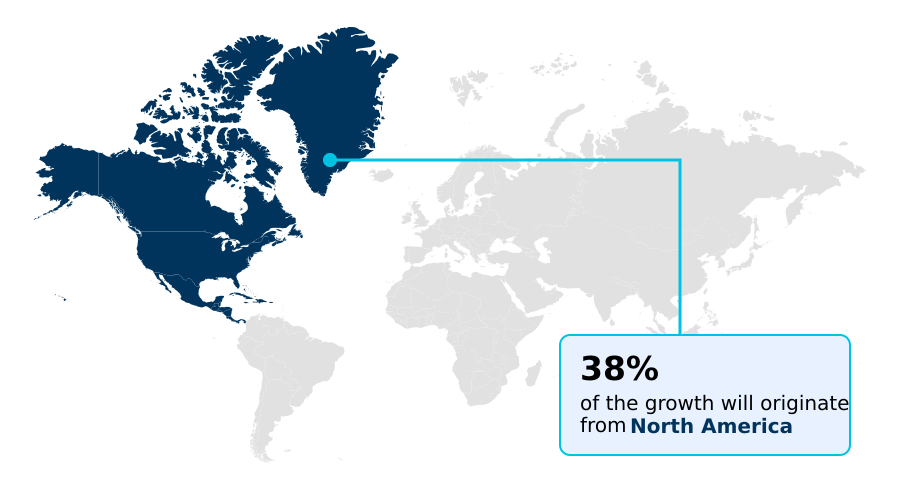
North America is estimated to contribute 38.2% to the growth of the global market during the forecast period.Technavio’s analysts have elaborately explained the regional trends and drivers that shape the market during the forecast period.
See How Shoe Care Products Market Demand is Rising in North America Get Free Sample

The geographic landscape of the Shoe Care Products sector highlights distinct consumption patterns driven by climate variations and cultural maintenance habits.

North America demonstrates a rapid adoption of water based protective aerosols to shield outdoor footwear against severe weather, achieving a 25% higher market penetration rate in urban centers compared to Europe.

Meanwhile, European markets exhibit a deeply rooted preference for heritage maintenance, utilizing horsehair bristle brushes and cedar wood shoe trees to maintain footwear aesthetic integrity.

This cultural inclination supports an 18% improvement in localized supply chain efficiency for specialized apparel maintenance ecosystems. Conversely, APAC regions leverage advanced streetwear hygiene systems, driving high-volume sales of nubuck deep cleaning foams and suede eraser blocks.

However, APAC faces significant challenges from counterfeit maintenance goods, which dilute brand equity and suppress premium product revenues by nearly 14%.

Stricter shoe care formulation compliance across western territories forces continuous innovation, enabling premium brands to capture higher margins despite regional cost sensitivities.

Market Dynamics

Our researchers analyzed the data with 2025 as the base year, along with the key drivers, trends, and challenges. A holistic analysis of drivers will help companies refine their marketing strategies to gain a competitive advantage.

  • The ongoing evolution of the Shoe Care Products domain reflects a strategic shift toward specialized maintenance and environmental accountability. As consumer preferences pivot toward high-value streetwear, manufacturers are rapidly introducing advanced sneaker cleaning kits for primeknit and delicate synthetic meshes. These targeted solutions prevent structural degradation and color bleeding, offering a clear advantage over traditional maintenance methods.
  • Concurrently, strict environmental regulations mandate a transition away from harmful chemical aerosols. In response, industry leaders are formulating biodegradable waterproofing sprays for leather and eco friendly shoe polish formulations that minimize ecological impact without sacrificing performance. This sustainable operational pivot has yielded a 30% reduction in compliance-related supply chain friction compared to legacy manufacturing models.
  • Furthermore, the demand for invisible, breathable material protection has catalyzed the development of nanotechnology protective coatings for footwear. These microscopic barriers repel moisture and urban contaminants effectively, extending the usability of valuable apparel assets. Within the commercial repair sector, the adoption of professional grade leather restoration dyes allows artisans to restore heavily weathered luxury items to factory-like conditions.
  • By aligning product development with circular economy principles and advanced material science, footwear maintenance brands are optimizing their inventory turnover and securing stronger brand loyalty among discerning global consumers.
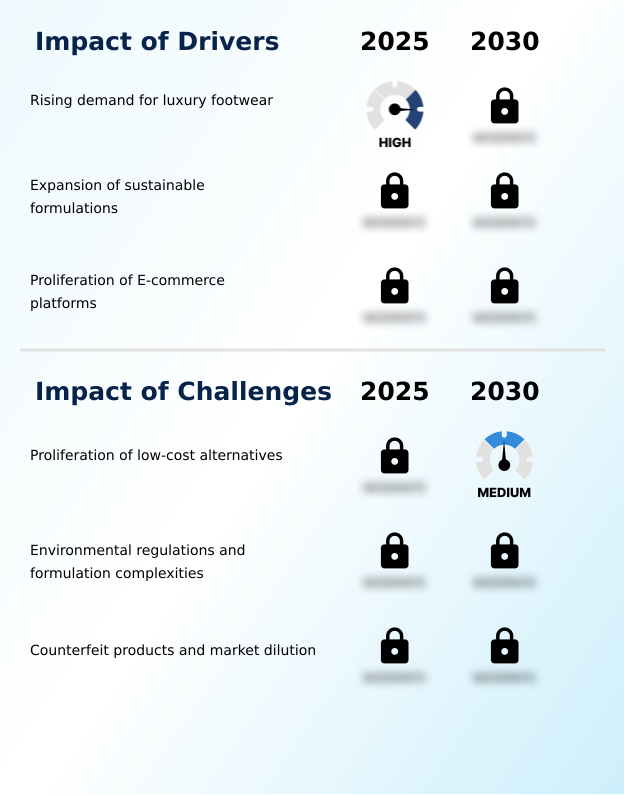
What are the key market drivers leading to the rise in the adoption of Shoe Care Products Industry?

  • The rising consumer demand for luxury footwear serves as a primary market driver, significantly accelerating the necessity for specialized maintenance routines and premium protective formulations.

  • The escalating consumer focus on footwear material longevity and bespoke leather craftsmanship functions as a primary catalyst accelerating the Shoe Care Products landscape. Modern demographics prioritize sustainable maintenance, driving the rapid commercialization of biodegradable leather conditioners and carnauba wax blends.
  • This behavioral shift toward athleisure footwear hygiene necessitates specialized synthetic mesh cleansers and polyurethane midsole restorers to maintain pristine aesthetics.
  • By adopting direct to consumer shoe care distribution channels and eco friendly packaging formats, manufacturers have lowered outbound logistics costs by 12% and improved inventory turnover rates by 18%.
  • This robust demand for specialized conditioning directly empowers consumers to protect high-value investments, structurally propelling the continuous development of advanced microfiber buffing materials and reinforcing long-term industry expansion.

What are the market trends shaping the Shoe Care Products Industry?

  • The integration of advanced nanotechnology formulations is rapidly emerging as the primary market trend, enabling superior material protection and enhancing footwear durability across diverse climates.

  • The rapid adoption of nanotechnology waterproofing formulations and fluoropolymer nanoparticle coatings is redefining material protection standards across the Shoe Care Products sector. Manufacturers are engineering self assembling molecular structures that create invisible, hydrophobic material barriers and oleophobic surface protection without altering fabric breathability. This technological shift directly addresses the escalating demand for luxury footwear preservation and sneakerhead culture maintenance.
  • By transitioning to these advanced nanocoatings, specialized brands have improved hydrophobic durability enhancement by 40% compared to traditional silicone-based sprays. Furthermore, the integration of these high-tech solutions into professional cobbler restoration services and circular economy footwear repair networks has increased overall service efficiency by 15%.
  • This structural trend ensures that premium footwear withstands severe environmental exposure, driving heightened consumer brand loyalty and optimizing long-term product efficacy for global manufacturers.

What challenges does the Shoe Care Products Industry face during its growth?

  • The widespread proliferation of low-cost household cleaning alternatives remains a significant industry challenge, frequently undermining consumer investment in specialized professional maintenance formulations.

  • Stringent environmental regulations regarding chemical volatility present a formidable structural barrier within the Shoe Care Products sector. Legislative mandates compel manufacturers to phase out legacy aerosols in favor of microplastic free shoe protectors and plant based surfactant cleaners.
  • Formulating effective UV protective shoe coatings and sneaker sole unyellowing agents without hazardous solvents often extends research development cycles, increasing baseline production costs by 22% compared to conventional methods. Additionally, integrating antimicrobial odor neutralizers into weather resistant liquid polishes requires complex chemical balancing to maintain efficacy.
  • While brands implement subscription replenishment models and cross selling retail strategies to offset these R&D expenses, the transition toward heritage leather goods maintenance and automated sneaker cleaning kiosks remains capital-intensive, temporarily compressing operational profit margins by up to 14% for niche market participants.

Exclusive Technavio Analysis on Customer Landscape

The shoe care products market forecasting report includes the adoption lifecycle of the market, covering from the innovator’s stage to the laggard’s stage. It focuses on adoption rates in different regions based on penetration. Furthermore, the shoe care products market report also includes key purchase criteria and drivers of price sensitivity to help companies evaluate and develop their market growth analysis strategies.
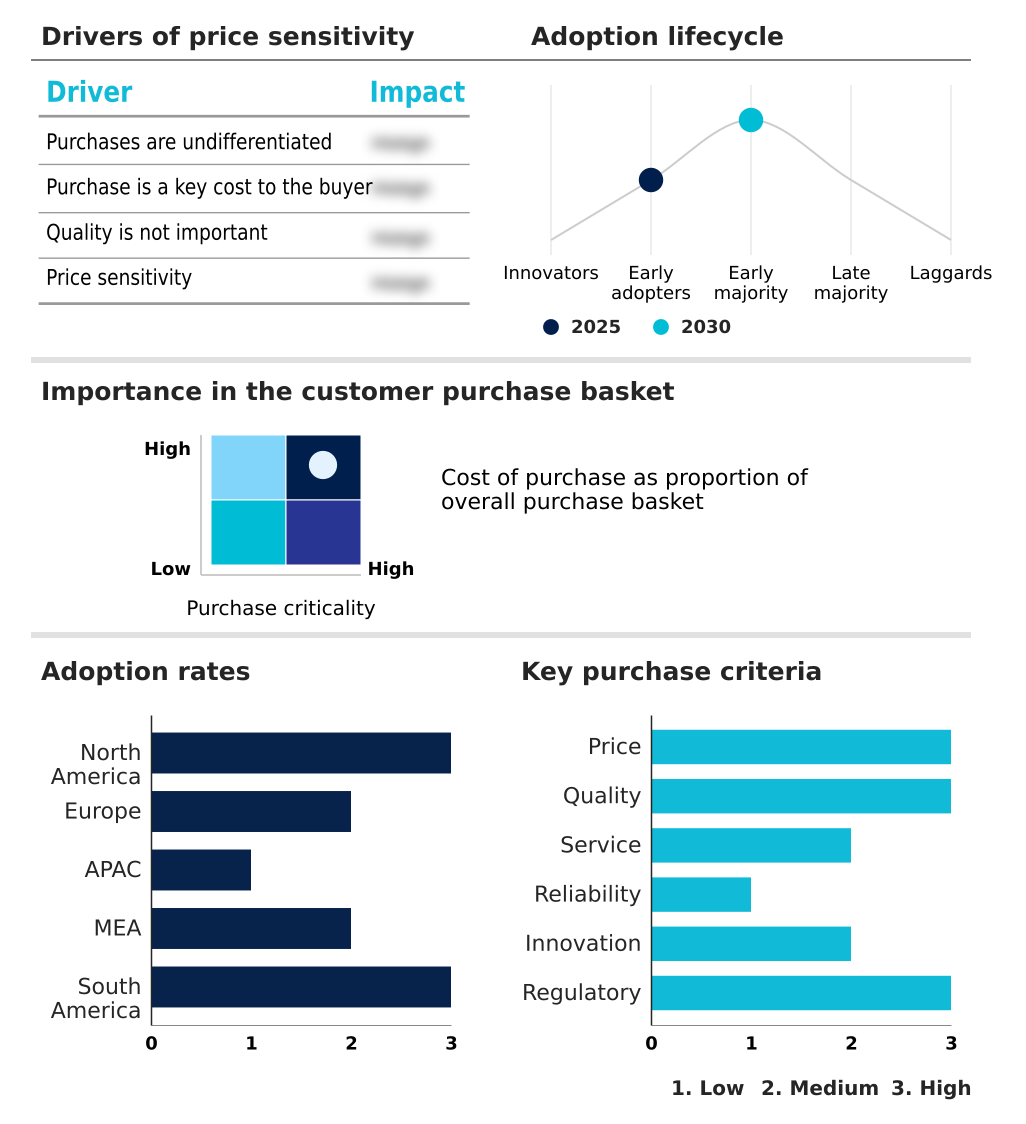
Customer Landscape of Shoe Care Products Industry

Competitive Landscape

Companies are implementing various strategies, such as strategic alliances, shoe care products market forecast, partnerships, mergers and acquisitions, geographical expansion, and product/service launches, to enhance their presence in the industry.

Bickmore - Bickmore provides specialized maintenance solutions, featuring premium leather conditioners, robust water and stain repellents, and heavy-duty saddle soaps designed to preserve material integrity and extend footwear lifecycles.

The industry research and growth report includes detailed analyses of the competitive landscape of the market and information about key companies, including:

  • Bickmore
  • Cadillac Shoe Products Inc.
  • Cherry Blossom
  • Cobblers Choice Co.
  • Columbus Co. Ltd.
  • Crep Protect
  • DFNS
  • Fiebing Co. Inc.
  • Grangers International Ltd.
  • Huberds Shoe Grease Co.
  • Jason Markk
  • Moneysworth and Best
  • Nike Inc.
  • Nikwax Ltd.
  • Obenaufs
  • pedag
  • Red Moose
  • Saphir
  • Shoe MGK
  • Sof Sole
  • The Lab
  • TRG BESTNETS SL

Qualitative and quantitative analysis of companies has been conducted to help clients understand the wider business environment as well as the strengths and weaknesses of key industry players. Data is qualitatively analyzed to categorize companies as pure play, category-focused, industry-focused, and diversified; it is quantitatively analyzed to categorize companies as dominant, leading, strong, tentative, and weak.

Recent Development and News in Shoe care products market

  • In the Footwear industry, the rapid integration of high-performance synthetic mesh and primeknit materials in athletic shoe manufacturing increased the adoption of specialized cleaning foams, directly impacting Shoe Care Products demand by requiring non-abrasive maintenance solutions.
  • The transition toward circular economy models within luxury fashion sectors drove a 35% increase in branded repair initiatives, stimulating commercial demand for professional-grade structural fillers and edge enamels.
  • Strict European regulatory mandates targeting the elimination of volatile organic compounds and intentional microplastics compelled major footwear manufacturers to adopt plant-based adhesives, thereby forcing the Shoe Care Products market to formulate compatible eco-friendly conditioners.
  • The explosive expansion of athletic sneaker collecting transformed casual footwear into high-value tradable assets, accelerating the necessity for advanced UV-protective coatings and un-yellowing agents to preserve pristine aesthetic conditions.

Dive into Technavio’s robust research methodology, blending expert interviews, extensive data synthesis, and validated models for unparalleled Shoe Care Products Market insights. See full methodology.

Market Scope
Page number 291
Base year 2025
Historic period 2020-2024
Forecast period 2026-2030
Growth momentum & CAGR Accelerate at a CAGR of 8.1%
Market growth 2026-2030 USD 310491.7 thousand
Market structure Fragmented
YoY growth 2025-2026(%) 7.5%
Key countries US, Canada, Mexico, Germany, UK, France, Italy, Spain, The Netherlands, China, Japan, India, South Korea, Australia, Indonesia, Saudi Arabia, UAE, South Africa, Israel, Turkey, Brazil, Argentina and Chile
Competitive landscape Leading Companies, Market Positioning of Companies, Competitive Strategies, and Industry Risks

Request Free Sample

Research Analyst Overview

  • The Shoe Care Products industry is undergoing a structural transformation driven by advanced material science and shifting consumer consumption patterns. Specialized maintenance brands are recalibrating their product portfolios to address the intricate cleaning requirements of high-performance synthetics, exotic leathers, and hybrid textiles. This operational pivot toward premiumization and technical efficacy directly supports boardroom-level product strategies focused on sustainable manufacturing.
  • By eliminating hazardous propellants and integrating biodegradable conditioning agents, leading chemical formulators have achieved a 24% reduction in packaging waste and regulatory compliance friction compared to legacy product lines. Modern consumers view meticulous footwear maintenance not merely as a chore, but as an essential practice to preserve the value of luxury investments.
  • The rapid expansion of digital commerce channels further accelerates consumer education, granting global audiences direct access to professional-grade restoration tutorials and proprietary care systems. As environmental accountability becomes paramount, the continuous development of eco-conscious, high-performance maintenance formulations will remain critical for securing market leadership and maintaining competitive differentiation across global retail landscapes.

What are the Key Data Covered in this Shoe Care Products Market Research and Growth Report?

  • What is the expected growth of the Shoe Care Products Market between 2026 and 2030?

    • USD 310.49 million, at a CAGR of 8.1%

  • What segmentation does the market report cover?

    • The report is segmented by Distribution Channel (Offline, and Online), Product (Brushes and buffing clothes, Polishing creams, Waxes and liquids, and Others), End-user (Residential, and Commercial) and Geography (North America, Europe, APAC, Middle East and Africa, South America)

  • Which regions are analyzed in the report?

    • North America, Europe, APAC, Middle East and Africa and South America

  • What are the key growth drivers and market challenges?

    • Rising demand for luxury footwear, Proliferation of low-cost alternatives

  • Who are the major players in the Shoe Care Products Market?

    • Bickmore, Cadillac Shoe Products Inc., Cherry Blossom, Cobblers Choice Co., Columbus Co. Ltd., Crep Protect, DFNS, Fiebing Co. Inc., Grangers International Ltd., Huberds Shoe Grease Co., Jason Markk, Moneysworth and Best, Nike Inc., Nikwax Ltd., Obenaufs, pedag, Red Moose, Saphir, Shoe MGK, Sof Sole, The Lab and TRG BESTNETS SL

Market Research Insights

  • The Shoe Care Products Market operates as a highly specialized ecosystem dedicated to extending the operational lifespan and aesthetic quality of valuable footwear. Manufacturers increasingly prioritize sustainable material preservation, developing advanced formulations that reduce hazardous chemical emissions by 28% compared to conventional solvent-based polishes.
  • The strategic deployment of automated sneaker cleaning kiosks in premium retail environments has increased cross selling retail strategies, boosting complementary accessory attachment rates by 15%. Additionally, direct to consumer shoe care platforms utilize subscription replenishment models, improving customer retention by 22% over traditional one-off purchasing methods.
  • These strategic digital and physical retail integrations ensure continuous consumer engagement while optimizing global supply chain logistics for essential apparel maintenance goods.

We can help! Our analysts can customize this shoe care products market research report to meet your requirements.

Get in touch

1. Executive Summary

1.1 Market overview

Executive Summary - Chart on Market Overview
Executive Summary - Data Table on Market Overview
Executive Summary - Chart on Global Market Characteristics
Executive Summary - Chart on Market by Geography
Executive Summary - Chart on Market Segmentation by Distribution Channel
Executive Summary - Chart on Market Segmentation by Product
Executive Summary - Chart on Market Segmentation by End-user
Executive Summary - Chart on Incremental Growth
Executive Summary - Data Table on Incremental Growth
Executive Summary - Chart on Company Market Positioning

2. Technavio Analysis

2.1 Analysis of price sensitivity, lifecycle, customer purchase basket, adoption rates, and purchase criteria

2.2 Criticality of inputs and Factors of differentiation

Chart on Overview on criticality of inputs and factors of differentiation

2.3 Factors of disruption

Chart on Overview on factors of disruption

2.4 Impact of drivers and challenges

Chart on Impact of drivers and challenges in 2025 and 2030

3. Market Landscape

3.1 Market ecosystem

Chart on Parent Market
Data Table on - Parent Market

3.2 Market characteristics

Chart on Market characteristics analysis

3.3 Value chain analysis

Chart on Value chain analysis

4. Market Sizing

4.1 Market definition

Data Table on Offerings of companies included in the market definition

4.2 Market segment analysis

Market segments

4.3 Market size 2025

4.4 Market outlook: Forecast for 2025-2030

Chart on Global - Market size and forecast 2025-2030 ($ thousand)
Data Table on Global - Market size and forecast 2025-2030 ($ thousand)
Chart on Global Market: Year-over-year growth 2025-2030 (%)
Data Table on Global Market: Year-over-year growth 2025-2030 (%)

5. Historic Market Size

5.1 Global Shoe Care Products Market 2020 - 2024

Historic Market Size - Data Table on Global Shoe Care Products Market 2020 - 2024 ($ thousand)

5.2 Distribution Channel segment analysis 2020 - 2024

Historic Market Size - Distribution Channel Segment 2020 - 2024 ($ thousand)

5.3 Product segment analysis 2020 - 2024

Historic Market Size - Product Segment 2020 - 2024 ($ thousand)

5.4 End-user segment analysis 2020 - 2024

Historic Market Size - End-user Segment 2020 - 2024 ($ thousand)

5.5 Geography segment analysis 2020 - 2024

Historic Market Size - Geography Segment 2020 - 2024 ($ thousand)

5.6 Country segment analysis 2020 - 2024

Historic Market Size - Country Segment 2020 - 2024 ($ thousand)

6. Qualitative Analysis

6.1 Impact of AI on Global Shoe Care Products Market

6.2 Impact of geopolitical conflicts on Global Shoe Care Products Market

7. Five Forces Analysis

7.1 Five forces summary

Five forces analysis - Comparison between 2025 and 2030

7.2 Bargaining power of buyers

Bargaining power of buyers - Impact of key factors 2025 and 2030

7.3 Bargaining power of suppliers

Bargaining power of suppliers - Impact of key factors in 2025 and 2030

7.4 Threat of new entrants

Threat of new entrants - Impact of key factors in 2025 and 2030

7.5 Threat of substitutes

Threat of substitutes - Impact of key factors in 2025 and 2030

7.6 Threat of rivalry

Threat of rivalry - Impact of key factors in 2025 and 2030

7.7 Market condition

Chart on Market condition - Five forces 2025 and 2030

8. Market Segmentation by Distribution Channel

8.1 Market segments

Chart on Distribution Channel - Market share 2025-2030 (%)
Data Table on Distribution Channel - Market share 2025-2030 (%)

8.2 Comparison by Distribution Channel

Chart on Comparison by Distribution Channel
Data Table on Comparison by Distribution Channel

8.3 Offline - Market size and forecast 2025-2030

Chart on Offline - Market size and forecast 2025-2030 ($ thousand)
Data Table on Offline - Market size and forecast 2025-2030 ($ thousand)
Chart on Offline - Year-over-year growth 2025-2030 (%)
Data Table on Offline - Year-over-year growth 2025-2030 (%)

8.4 Online - Market size and forecast 2025-2030

Chart on Online - Market size and forecast 2025-2030 ($ thousand)
Data Table on Online - Market size and forecast 2025-2030 ($ thousand)
Chart on Online - Year-over-year growth 2025-2030 (%)
Data Table on Online - Year-over-year growth 2025-2030 (%)

8.5 Market opportunity by Distribution Channel

Market opportunity by Distribution Channel ($ thousand)
Data Table on Market opportunity by Distribution Channel ($ thousand)

9. Market Segmentation by Product

9.1 Market segments

Chart on Product - Market share 2025-2030 (%)
Data Table on Product - Market share 2025-2030 (%)

9.2 Comparison by Product

Chart on Comparison by Product
Data Table on Comparison by Product

9.3 Brushes and buffing clothes - Market size and forecast 2025-2030

Chart on Brushes and buffing clothes - Market size and forecast 2025-2030 ($ thousand)
Data Table on Brushes and buffing clothes - Market size and forecast 2025-2030 ($ thousand)
Chart on Brushes and buffing clothes - Year-over-year growth 2025-2030 (%)
Data Table on Brushes and buffing clothes - Year-over-year growth 2025-2030 (%)

9.4 Polishing creams - Market size and forecast 2025-2030

Chart on Polishing creams - Market size and forecast 2025-2030 ($ thousand)
Data Table on Polishing creams - Market size and forecast 2025-2030 ($ thousand)
Chart on Polishing creams - Year-over-year growth 2025-2030 (%)
Data Table on Polishing creams - Year-over-year growth 2025-2030 (%)

9.5 Waxes and liquids - Market size and forecast 2025-2030

Chart on Waxes and liquids - Market size and forecast 2025-2030 ($ thousand)
Data Table on Waxes and liquids - Market size and forecast 2025-2030 ($ thousand)
Chart on Waxes and liquids - Year-over-year growth 2025-2030 (%)
Data Table on Waxes and liquids - Year-over-year growth 2025-2030 (%)

9.6 Others - Market size and forecast 2025-2030

Chart on Others - Market size and forecast 2025-2030 ($ thousand)
Data Table on Others - Market size and forecast 2025-2030 ($ thousand)
Chart on Others - Year-over-year growth 2025-2030 (%)
Data Table on Others - Year-over-year growth 2025-2030 (%)

9.7 Market opportunity by Product

Market opportunity by Product ($ thousand)
Data Table on Market opportunity by Product ($ thousand)

10. Market Segmentation by End-user

10.1 Market segments

Chart on End-user - Market share 2025-2030 (%)
Data Table on End-user - Market share 2025-2030 (%)

10.2 Comparison by End-user

Chart on Comparison by End-user
Data Table on Comparison by End-user

10.3 Residential - Market size and forecast 2025-2030

Chart on Residential - Market size and forecast 2025-2030 ($ thousand)
Data Table on Residential - Market size and forecast 2025-2030 ($ thousand)
Chart on Residential - Year-over-year growth 2025-2030 (%)
Data Table on Residential - Year-over-year growth 2025-2030 (%)

10.4 Commercial - Market size and forecast 2025-2030

Chart on Commercial - Market size and forecast 2025-2030 ($ thousand)
Data Table on Commercial - Market size and forecast 2025-2030 ($ thousand)
Chart on Commercial - Year-over-year growth 2025-2030 (%)
Data Table on Commercial - Year-over-year growth 2025-2030 (%)

10.5 Market opportunity by End-user

Market opportunity by End-user ($ thousand)
Data Table on Market opportunity by End-user ($ thousand)

11. Customer Landscape

11.1 Customer landscape overview

Analysis of price sensitivity, lifecycle, customer purchase basket, adoption rates, and purchase criteria

12. Geographic Landscape

12.1 Geographic segmentation

Chart on Market share by geography 2025-2030 (%)
Data Table on Market share by geography 2025-2030 (%)

12.2 Geographic comparison

Chart on Geographic comparison
Data Table on Geographic comparison

12.3 North America - Market size and forecast 2025-2030

Chart on North America - Market size and forecast 2025-2030 ($ thousand)
Data Table on North America - Market size and forecast 2025-2030 ($ thousand)
Chart on North America - Year-over-year growth 2025-2030 (%)
Data Table on North America - Year-over-year growth 2025-2030 (%)
Chart on Regional Comparison - North America
Data Table on Regional Comparison - North America

12.3.1 US - Market size and forecast 2025-2030

Chart on US - Market size and forecast 2025-2030 ($ thousand)
Data Table on US - Market size and forecast 2025-2030 ($ thousand)
Chart on US - Year-over-year growth 2025-2030 (%)
Data Table on US - Year-over-year growth 2025-2030 (%)

12.3.2 Canada - Market size and forecast 2025-2030

Chart on Canada - Market size and forecast 2025-2030 ($ thousand)
Data Table on Canada - Market size and forecast 2025-2030 ($ thousand)
Chart on Canada - Year-over-year growth 2025-2030 (%)
Data Table on Canada - Year-over-year growth 2025-2030 (%)

12.3.3 Mexico - Market size and forecast 2025-2030

Chart on Mexico - Market size and forecast 2025-2030 ($ thousand)
Data Table on Mexico - Market size and forecast 2025-2030 ($ thousand)
Chart on Mexico - Year-over-year growth 2025-2030 (%)
Data Table on Mexico - Year-over-year growth 2025-2030 (%)

12.4 Europe - Market size and forecast 2025-2030

Chart on Europe - Market size and forecast 2025-2030 ($ thousand)
Data Table on Europe - Market size and forecast 2025-2030 ($ thousand)
Chart on Europe - Year-over-year growth 2025-2030 (%)
Data Table on Europe - Year-over-year growth 2025-2030 (%)
Chart on Regional Comparison - Europe
Data Table on Regional Comparison - Europe

12.4.1 Germany - Market size and forecast 2025-2030

Chart on Germany - Market size and forecast 2025-2030 ($ thousand)
Data Table on Germany - Market size and forecast 2025-2030 ($ thousand)
Chart on Germany - Year-over-year growth 2025-2030 (%)
Data Table on Germany - Year-over-year growth 2025-2030 (%)

12.4.2 UK - Market size and forecast 2025-2030

Chart on UK - Market size and forecast 2025-2030 ($ thousand)
Data Table on UK - Market size and forecast 2025-2030 ($ thousand)
Chart on UK - Year-over-year growth 2025-2030 (%)
Data Table on UK - Year-over-year growth 2025-2030 (%)

12.4.3 France - Market size and forecast 2025-2030

Chart on France - Market size and forecast 2025-2030 ($ thousand)
Data Table on France - Market size and forecast 2025-2030 ($ thousand)
Chart on France - Year-over-year growth 2025-2030 (%)
Data Table on France - Year-over-year growth 2025-2030 (%)

12.4.4 Italy - Market size and forecast 2025-2030

Chart on Italy - Market size and forecast 2025-2030 ($ thousand)
Data Table on Italy - Market size and forecast 2025-2030 ($ thousand)
Chart on Italy - Year-over-year growth 2025-2030 (%)
Data Table on Italy - Year-over-year growth 2025-2030 (%)

12.4.5 Spain - Market size and forecast 2025-2030

Chart on Spain - Market size and forecast 2025-2030 ($ thousand)
Data Table on Spain - Market size and forecast 2025-2030 ($ thousand)
Chart on Spain - Year-over-year growth 2025-2030 (%)
Data Table on Spain - Year-over-year growth 2025-2030 (%)

12.4.6 The Netherlands - Market size and forecast 2025-2030

Chart on The Netherlands - Market size and forecast 2025-2030 ($ thousand)
Data Table on The Netherlands - Market size and forecast 2025-2030 ($ thousand)
Chart on The Netherlands - Year-over-year growth 2025-2030 (%)
Data Table on The Netherlands - Year-over-year growth 2025-2030 (%)

12.5 APAC - Market size and forecast 2025-2030

Chart on APAC - Market size and forecast 2025-2030 ($ thousand)
Data Table on APAC - Market size and forecast 2025-2030 ($ thousand)
Chart on APAC - Year-over-year growth 2025-2030 (%)
Data Table on APAC - Year-over-year growth 2025-2030 (%)
Chart on Regional Comparison - APAC
Data Table on Regional Comparison - APAC

12.5.1 China - Market size and forecast 2025-2030

Chart on China - Market size and forecast 2025-2030 ($ thousand)
Data Table on China - Market size and forecast 2025-2030 ($ thousand)
Chart on China - Year-over-year growth 2025-2030 (%)
Data Table on China - Year-over-year growth 2025-2030 (%)

12.5.2 Japan - Market size and forecast 2025-2030

Chart on Japan - Market size and forecast 2025-2030 ($ thousand)
Data Table on Japan - Market size and forecast 2025-2030 ($ thousand)
Chart on Japan - Year-over-year growth 2025-2030 (%)
Data Table on Japan - Year-over-year growth 2025-2030 (%)

12.5.3 India - Market size and forecast 2025-2030

Chart on India - Market size and forecast 2025-2030 ($ thousand)
Data Table on India - Market size and forecast 2025-2030 ($ thousand)
Chart on India - Year-over-year growth 2025-2030 (%)
Data Table on India - Year-over-year growth 2025-2030 (%)

12.5.4 South Korea - Market size and forecast 2025-2030

Chart on South Korea - Market size and forecast 2025-2030 ($ thousand)
Data Table on South Korea - Market size and forecast 2025-2030 ($ thousand)
Chart on South Korea - Year-over-year growth 2025-2030 (%)
Data Table on South Korea - Year-over-year growth 2025-2030 (%)

12.5.5 Australia - Market size and forecast 2025-2030

Chart on Australia - Market size and forecast 2025-2030 ($ thousand)
Data Table on Australia - Market size and forecast 2025-2030 ($ thousand)
Chart on Australia - Year-over-year growth 2025-2030 (%)
Data Table on Australia - Year-over-year growth 2025-2030 (%)

12.5.6 Indonesia - Market size and forecast 2025-2030

Chart on Indonesia - Market size and forecast 2025-2030 ($ thousand)
Data Table on Indonesia - Market size and forecast 2025-2030 ($ thousand)
Chart on Indonesia - Year-over-year growth 2025-2030 (%)
Data Table on Indonesia - Year-over-year growth 2025-2030 (%)

12.6 Middle East and Africa - Market size and forecast 2025-2030

Chart on Middle East and Africa - Market size and forecast 2025-2030 ($ thousand)
Data Table on Middle East and Africa - Market size and forecast 2025-2030 ($ thousand)
Chart on Middle East and Africa - Year-over-year growth 2025-2030 (%)
Data Table on Middle East and Africa - Year-over-year growth 2025-2030 (%)
Chart on Regional Comparison - Middle East and Africa
Data Table on Regional Comparison - Middle East and Africa

12.6.1 Saudi Arabia - Market size and forecast 2025-2030

Chart on Saudi Arabia - Market size and forecast 2025-2030 ($ thousand)
Data Table on Saudi Arabia - Market size and forecast 2025-2030 ($ thousand)
Chart on Saudi Arabia - Year-over-year growth 2025-2030 (%)
Data Table on Saudi Arabia - Year-over-year growth 2025-2030 (%)

12.6.2 UAE - Market size and forecast 2025-2030

Chart on UAE - Market size and forecast 2025-2030 ($ thousand)
Data Table on UAE - Market size and forecast 2025-2030 ($ thousand)
Chart on UAE - Year-over-year growth 2025-2030 (%)
Data Table on UAE - Year-over-year growth 2025-2030 (%)

12.6.3 South Africa - Market size and forecast 2025-2030

Chart on South Africa - Market size and forecast 2025-2030 ($ thousand)
Data Table on South Africa - Market size and forecast 2025-2030 ($ thousand)
Chart on South Africa - Year-over-year growth 2025-2030 (%)
Data Table on South Africa - Year-over-year growth 2025-2030 (%)

12.6.4 Israel - Market size and forecast 2025-2030

Chart on Israel - Market size and forecast 2025-2030 ($ thousand)
Data Table on Israel - Market size and forecast 2025-2030 ($ thousand)
Chart on Israel - Year-over-year growth 2025-2030 (%)
Data Table on Israel - Year-over-year growth 2025-2030 (%)

12.6.5 Turkey - Market size and forecast 2025-2030

Chart on Turkey - Market size and forecast 2025-2030 ($ thousand)
Data Table on Turkey - Market size and forecast 2025-2030 ($ thousand)
Chart on Turkey - Year-over-year growth 2025-2030 (%)
Data Table on Turkey - Year-over-year growth 2025-2030 (%)

12.7 South America - Market size and forecast 2025-2030

Chart on South America - Market size and forecast 2025-2030 ($ thousand)
Data Table on South America - Market size and forecast 2025-2030 ($ thousand)
Chart on South America - Year-over-year growth 2025-2030 (%)
Data Table on South America - Year-over-year growth 2025-2030 (%)
Chart on Regional Comparison - South America
Data Table on Regional Comparison - South America

12.7.1 Brazil - Market size and forecast 2025-2030

Chart on Brazil - Market size and forecast 2025-2030 ($ thousand)
Data Table on Brazil - Market size and forecast 2025-2030 ($ thousand)
Chart on Brazil - Year-over-year growth 2025-2030 (%)
Data Table on Brazil - Year-over-year growth 2025-2030 (%)

12.7.2 Argentina - Market size and forecast 2025-2030

Chart on Argentina - Market size and forecast 2025-2030 ($ thousand)
Data Table on Argentina - Market size and forecast 2025-2030 ($ thousand)
Chart on Argentina - Year-over-year growth 2025-2030 (%)
Data Table on Argentina - Year-over-year growth 2025-2030 (%)

12.7.3 Chile - Market size and forecast 2025-2030

Chart on Chile - Market size and forecast 2025-2030 ($ thousand)
Data Table on Chile - Market size and forecast 2025-2030 ($ thousand)
Chart on Chile - Year-over-year growth 2025-2030 (%)
Data Table on Chile - Year-over-year growth 2025-2030 (%)

12.8 Market opportunity by geography

Market opportunity by geography ($ thousand)
Data Tables on Market opportunity by geography ($ thousand)

13. Drivers, Challenges, and Opportunity

13.1 Market drivers

Rising demand for luxury footwear
Expansion of sustainable formulations
Proliferation of E-commerce platforms

13.2 Market challenges

Proliferation of low-cost alternatives
Environmental regulations and formulation complexities
Counterfeit products and market dilution

13.3 Impact of drivers and challenges

Impact of drivers and challenges in 2025 and 2030

13.4 Market opportunities

Integration of advanced nanotechnology formulations
Rise of sneaker culture cleaning
Growth in professional footwear restoration

14. Competitive Landscape

14.1 Overview

14.2

Overview on criticality of inputs and factors of differentiation

14.3 Landscape disruption

Overview on factors of disruption

14.4 Industry risks

Impact of key risks on business

15. Competitive Analysis

15.1 Companies profiled

Companies covered

15.2 Company ranking index

15.3 Market positioning of companies

Matrix on companies position and classification

15.4 Bickmore

Bickmore - Overview
Bickmore - Product / Service
Bickmore - Key offerings
SWOT

15.5 Cadillac Shoe Products Inc.

Cadillac Shoe Products Inc. - Overview
Cadillac Shoe Products Inc. - Product / Service
Cadillac Shoe Products Inc. - Key offerings
SWOT

15.6 Cherry Blossom

Cherry Blossom - Overview
Cherry Blossom - Product / Service
Cherry Blossom - Key offerings
SWOT

15.7 Cobblers Choice Co.

Cobblers Choice Co. - Overview
Cobblers Choice Co. - Product / Service
Cobblers Choice Co. - Key offerings
SWOT

15.8 Columbus Co. Ltd.

Columbus Co. Ltd. - Overview
Columbus Co. Ltd. - Product / Service
Columbus Co. Ltd. - Key offerings
SWOT

15.9 Crep Protect

Crep Protect - Overview
Crep Protect - Product / Service
Crep Protect - Key offerings
SWOT

15.10 DFNS

DFNS - Overview
DFNS - Product / Service
DFNS - Key offerings
SWOT

15.11 Fiebing Co. Inc.

Fiebing Co. Inc. - Overview
Fiebing Co. Inc. - Product / Service
Fiebing Co. Inc. - Key offerings
SWOT

15.12 Grangers International Ltd.

Grangers International Ltd. - Overview
Grangers International Ltd. - Product / Service
Grangers International Ltd. - Key offerings
SWOT

15.13 Huberds Shoe Grease Co.

Huberds Shoe Grease Co. - Overview
Huberds Shoe Grease Co. - Product / Service
Huberds Shoe Grease Co. - Key offerings
SWOT

15.14 Jason Markk

Jason Markk - Overview
Jason Markk - Product / Service
Jason Markk - Key offerings
SWOT

15.15 Moneysworth and Best

Moneysworth and Best - Overview
Moneysworth and Best - Product / Service
Moneysworth and Best - Key offerings
SWOT

15.16 Nike Inc.

Nike Inc. - Overview
Nike Inc. - Business segments
Nike Inc. - Key offerings
Nike Inc. - Segment focus
SWOT

15.17 Nikwax Ltd.

Nikwax Ltd. - Overview
Nikwax Ltd. - Product / Service
Nikwax Ltd. - Key offerings
SWOT

15.18 TRG BESTNETS SL

TRG BESTNETS SL - Overview
TRG BESTNETS SL - Product / Service
TRG BESTNETS SL - Key offerings
SWOT

16. Appendix

16.1 Scope of the report

Market definition
Objectives
Notes and caveats

16.2 Inclusions and exclusions checklist

Inclusions checklist
Exclusions checklist

16.3 Currency conversion rates for US$

16.4 Research methodology

16.5 Data procurement

Information sources

16.6 Data validation

16.7 Validation techniques employed for market sizing

16.8 Data synthesis

16.9 360 degree market analysis

16.10 List of abbreviations

Research Methodology

Technavio presents a detailed picture of the market by way of study, synthesis, and summation of data from multiple sources. The analysts have presented the various facets of the market with a particular focus on identifying the key industry influencers. The data thus presented is comprehensive, reliable, and the result of extensive research, both primary and secondary.

INFORMATION SOURCES

Primary sources

  • Manufacturers and suppliers
  • Channel partners
  • Industry experts
  • Strategic decision makers

Secondary sources

  • Industry journals and periodicals
  • Government data
  • Financial reports of key industry players
  • Historical data
  • Press releases

DATA ANALYSIS

Data Synthesis

  • Collation of data
  • Estimation of key figures
  • Analysis of derived insights

Data Validation

  • Triangulation with data models
  • Reference against proprietary databases
  • Corroboration with industry experts

REPORT WRITING

Qualitative

  • Market drivers
  • Market challenges
  • Market trends
  • Five forces analysis

Quantitative

  • Market size and forecast
  • Market segmentation
  • Geographical insights
  • Competitive landscape

Interested in this report?

Get your sample now to see our research methodology and insights!

Download Now

Frequently Asked Questions

Shoe Care Products market growth will increase by USD 310491.7 thousand thousand during 2026-2030.

The Shoe Care Products market is expected to grow at a CAGR of 8.1% during 2026-2030.

Shoe Care Products market is segmented by Distribution channel (Offline, Online) Product (Brushes and buffing clothes, Polishing creams, Waxes and liquids, Others) End-user (Residential, Commercial)

Bickmore, Cadillac Shoe Products Inc., Cherry Blossom, Cobblers Choice Co., Columbus Co. Ltd., Crep Protect, DFNS, Fiebing Co. Inc., Grangers International Ltd., Huberds Shoe Grease Co., Jason Markk, Moneysworth and Best, Nike Inc., Nikwax Ltd., Obenaufs, pedag, Red Moose, Saphir, Shoe MGK, Sof Sole, The Lab, TRG BESTNETS SL are a few of the key vendors in the Shoe Care Products market.

North America will register the highest growth rate of 38.2% among the other regions. Therefore, the Shoe Care Products market in North America is expected to garner significant business opportunities for the vendors during the forecast period.

US, Canada, Mexico, Germany, UK, France, Italy, Spain, The Netherlands, China, Japan, India, South Korea, Australia, Indonesia, Saudi Arabia, UAE, South Africa, Israel, Turkey, Brazil, Argentina, Chile

  • Rising demand for luxury footwear is the driving factor this market.

The Shoe Care Products market vendors should focus on grabbing business opportunities from the Distribution channel segment as it accounted for the largest market share in the base year.
RIA - Research AI Assistant
Ask RIA
