
Shrink Sleeve And Stretch Sleeve Labels Market Analysis, Size, and Forecast 2026-2030: APAC (China, India, and Japan), North America (US, Canada, and Mexico), Europe (Germany, UK, and France), South America (Brazil, Argentina, and Chile), Middle East and Africa (Saudi Arabia, UAE, and South Africa), and Rest of World (ROW)

Shrink Sleeve And Stretch Sleeve Labels Market Analysis, Size, and Forecast 2026-2030:
APAC (China, India, and Japan), North America (US, Canada, and Mexico), Europe (Germany, UK, and France), South America (Brazil, Argentina, and Chile), Middle East and Africa (Saudi Arabia, UAE, and South Africa), and Rest of World (ROW)

Published: Oct 2026 303 Pages SKU: IRTNTR74173

Market Overview at a Glance

$5.53 B
Market Opportunity
5.9%
CAGR 2025 - 2030
43%
APAC Growth
$4.06 B
Food and beverage segment 2024

Shrink Sleeve And Stretch Sleeve Labels Market Size 2026-2030

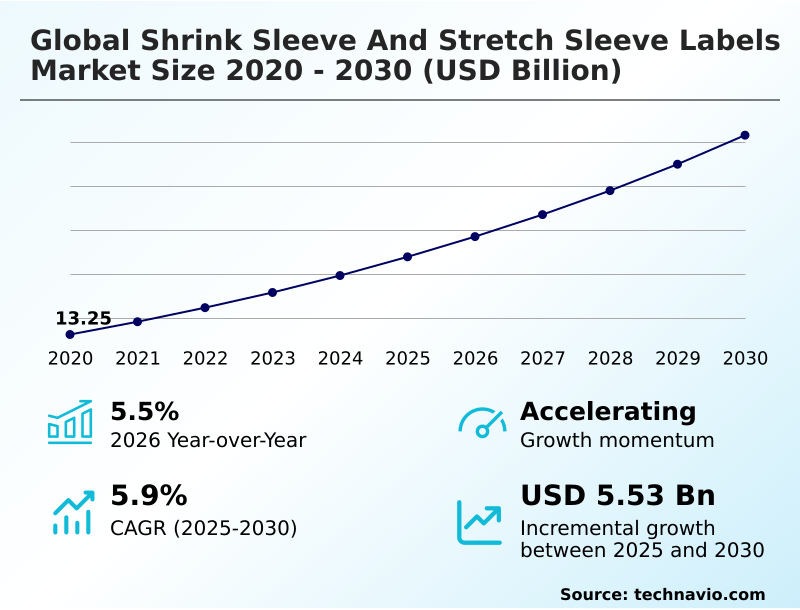
The shrink sleeve and stretch sleeve labels market size is valued to increase by USD 5.53 billion, at a CAGR of 5.9% from 2025 to 2030. Surging beverage and personal care demand for 360 degree branding will drive the shrink sleeve and stretch sleeve labels market.

Major Market Trends & Insights

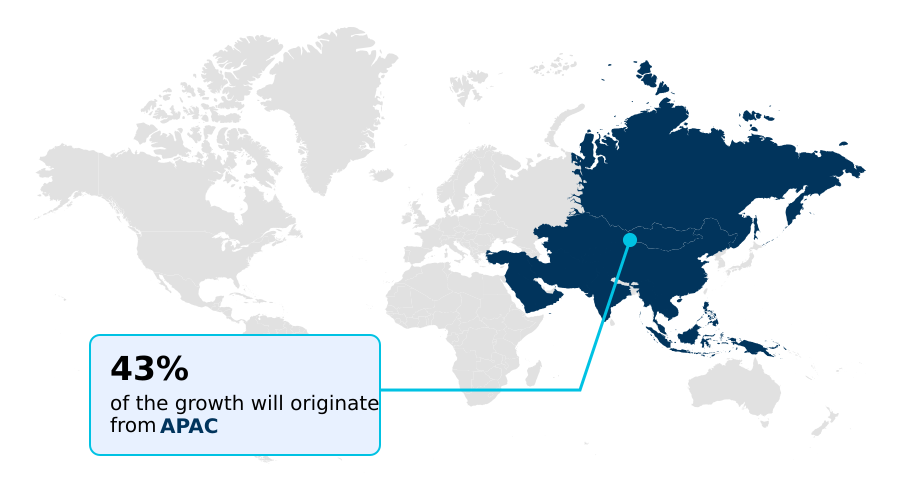
  • APAC dominated the market and accounted for a 43% growth during the forecast period.
  • By Application - Food and beverage segment was valued at USD 4.06 billion in 2024
  • By Product Type - Stretch sleeves label segment accounted for the largest market revenue share in 2024

Market Size & Forecast

  • Market Opportunities: USD 9.06 billion
  • Market Future Opportunities: USD 5.53 billion
  • CAGR from 2025 to 2030 : 5.9%

Market Summary

  • The Shrink Sleeve And Stretch Sleeve Labels Market operates as a critical component of modern consumer goods packaging, providing essential 360-degree visual branding and structural product security. Surging demand across the beverage and personal care sectors acts as a primary driver, as brand owners rapidly transition from traditional pressure-sensitive labels to high-coverage sleeve formats to maximize retail shelf impact.
  • This shift enables manufacturers to incorporate vibrant graphics and built-in tamper-evident security directly into a single packaging component. In a practical supply chain scenario, a major dairy producer transitioning to cold-applied stretch sleeves successfully reduced utility consumption and floor space requirements, yielding a 25% decrease in overall operational energy costs compared to traditional thermal tunnel systems.
  • However, the industry faces severe structural challenges regarding end-of-life material sortability. High-density polymer films frequently cause severe cross-contamination within municipal recycling streams during industrial wash-tank processing. To resolve this friction, material scientists are actively engineering low-density, floatable substrates that ensure clean separation from rigid containers, aligning labeling capabilities with stringent circular economy compliance mandates.

What will be the Size of the Shrink Sleeve And Stretch Sleeve Labels Market during the forecast period?
Get Key Insights on Market Forecast (PDF) Get Free Sample

How is the Shrink Sleeve And Stretch Sleeve Labels Market Segmented?

The shrink sleeve and stretch sleeve labels industry research report provides comprehensive data (region-wise segment analysis), with forecasts and estimates in "USD million" for the period 2026-2030, as well as historical data from 2020-2024 for the following segments.

  • Application
    • Food and beverage
    • Healthcare
    • Beauty and personnel care
    • Others
  • Product type
    • Stretch sleeves label
    • Shrink sleeves label
  • Material
    • PVC
    • PETG
    • OPS
    • PE
    • Others
  • Geography
    • APAC
      • China
      • India
      • Japan
      • South Korea
      • Indonesia
      • Australia
    • North America
      • US
      • Canada
      • Mexico
    • Europe
      • Germany
      • UK
      • France
      • Italy
      • Spain
      • The Netherlands
    • South America
      • Brazil
      • Argentina
      • Chile
    • Middle East and Africa
      • Saudi Arabia
      • UAE
      • South Africa
      • Turkey
      • Israel

By Application Insights

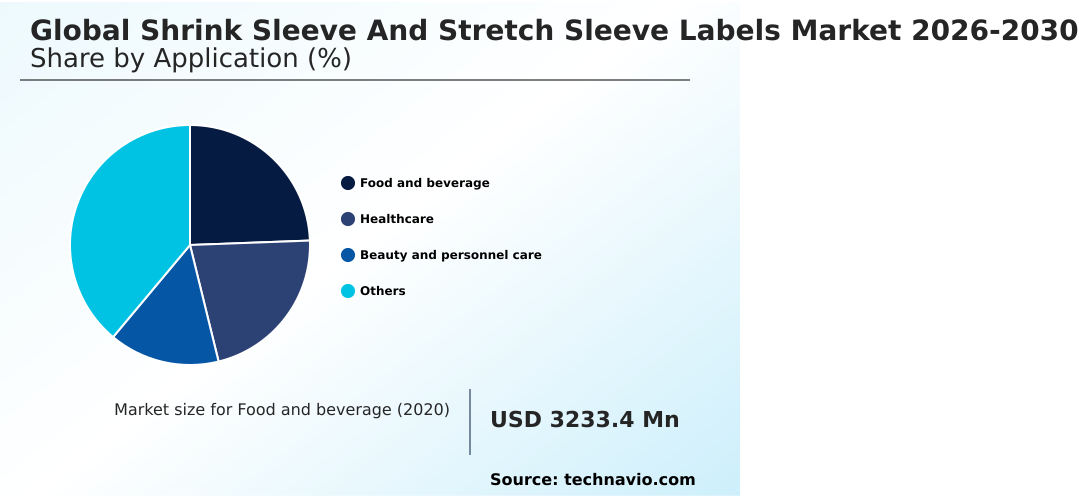
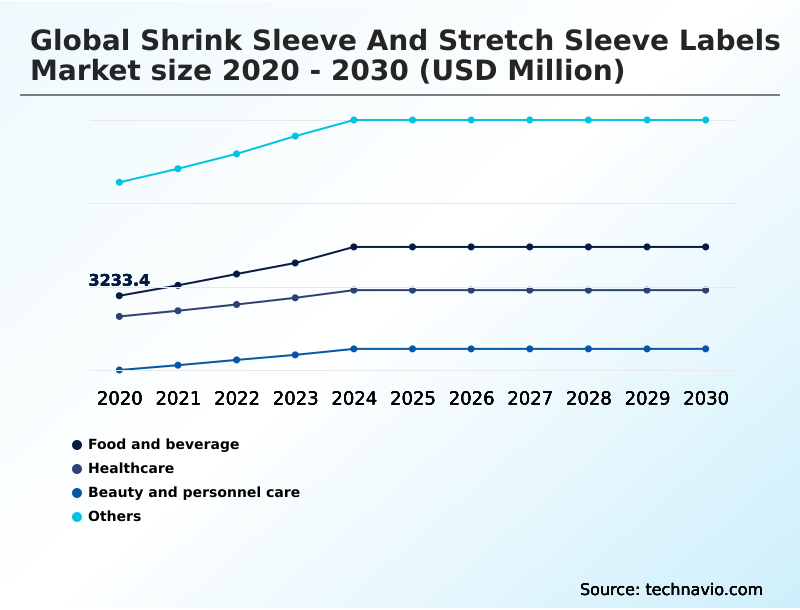
The food and beverage segment is estimated to witness significant growth during the forecast period.

The food and beverage segment commands the primary revenue share, driven by intense retail competition and rapid container geometry diversification. Beverage manufacturers rely extensively on shrink and stretch sleeves to conform seamlessly to complex contours, achieving superior product differentiation.

By transitioning to full-body decoration, companies enhance functional benefits like light barrier protection and tamper evident band security. Adoption of advanced mono material packaging has improved processing efficiency by 15%, reducing material waste on high speed bottling line configurations.

The market is experiencing a notable technical shift toward floatable polyolefin and low density polyethylene films engineered to detach easily during industrial float sink separation, thereby preserving the purity of recycled plastic streams.

These substrates support bottle to bottle recycling, yielding measurable improvements in supply chain traceability and operational energy profile optimization.
Get Free Sample

The Food and beverage segment was valued at USD 4.06 billion in 2024 and showed a gradual increase during the forecast period.
Get Free Sample

Regional Analysis

APAC is estimated to contribute 43% to the growth of the global market during the forecast period.Technavio’s analysts have elaborately explained the regional trends and drivers that shape the market during the forecast period.
See How Shrink Sleeve And Stretch Sleeve Labels Market Demand is Rising in APAC Get Free Sample

The geographic landscape for Shrink Sleeve And Stretch Sleeve Labels reveals distinct regional adoption trajectories shaped by regulatory pressures and packaging infrastructure.

The North America region exhibits mature adoption of digital technologies, leading to a 20% faster turnaround time in customized variations compared to traditional flexographic printing setups.

Conversely, countries in APAC are aggressively expanding their manufacturing output, where high-volume production of polyvinyl chloride and polyethylene terephthalate glycol substrates has lowered per-unit procurement costs by 15% relative to European markets.

European converters prioritize extended producer responsibility, driving investments in thermal shrink tunnel systems that handle crystallizable pet. The adoption of water washable ink has increased municipal waste management separation efficiency by 22%.

These regional variances highlight how a contract packaging enterprise adapts to local compliance demands to mitigate rpet resin repelletization contamination risks.

Market Dynamics

Our researchers analyzed the data with 2025 as the base year, along with the key drivers, trends, and challenges. A holistic analysis of drivers will help companies refine their marketing strategies to gain a competitive advantage.

  • The structural progression of the labeling industry is increasingly dependent on the strategic integration of advanced polymer science and highly efficient application technology. A fundamental shift is underway as commercial brand owners demand floatable sleeve films for circular economy compliance, ensuring that packaging components separate cleanly during municipal wash cycles.
  • Simultaneously, the deployment of energy efficient stretch sleeve application machinery is allowing high-volume beverage and chemical bottlers to eliminate the need for thermal heat tunnels. This mechanical transition provides a 30% reduction in electrical utility consumption when compared directly to legacy steam-based shrinking processes, optimizing both operational planning and corporate carbon footprint metrics.
  • Furthermore, pharmaceutical and healthcare manufacturers are prioritizing tamper evident security for pharmaceutical packaging, utilizing full-body sleeves that natively incorporate micro-perforated tear lines to prevent illicit product contamination and verify chain-of-custody integrity.
  • To minimize the environmental impact of raw material extraction, forward-thinking converters are actively scaling bio based polymer integration in labeling, leveraging renewable resources like polylactic acid to replace traditional fossil-derived plastics. However, maintaining absolute visual consistency remains a technical hurdle, making managing visual distortion in shrink sleeves across highly asymmetrical or contoured containers a critical priority for pre-press engineering departments.
  • By addressing these complex structural parameters, packaging developers ensure that continuous container decoration supports strict regulatory alignment and robust supply chain durability.
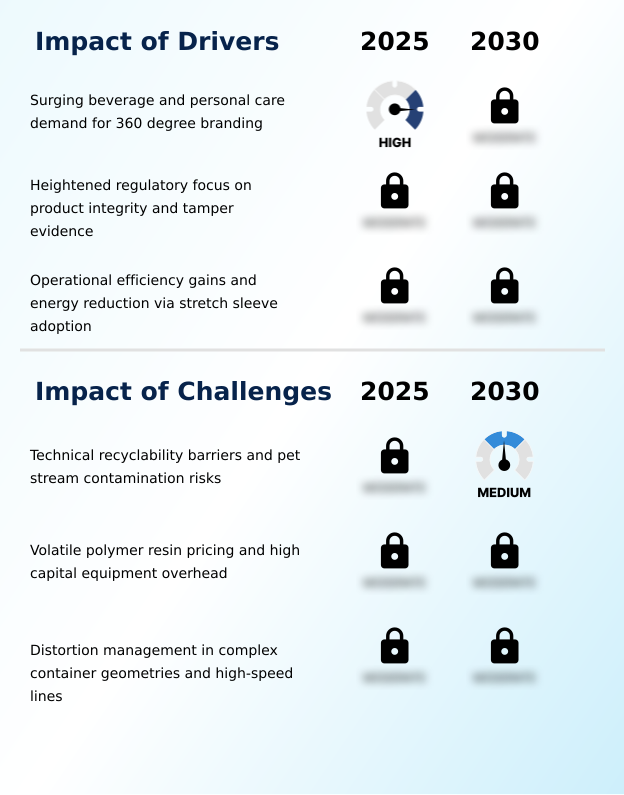
What are the key market drivers leading to the rise in the adoption of Shrink Sleeve And Stretch Sleeve Labels Industry?

  • Surging demand within the beverage and personal care sectors for 360-degree branding acts as a primary catalyst for market expansion.

  • Heightened regulatory focus on product integrity and the universal demand for high-density shelf appeal act as primary catalysts for Shrink Sleeve And Stretch Sleeve Labels expansion.
  • Pharmaceutical and fast-moving consumer goods sectors are systematically transitioning to packaging formats equipped with a micro perforated tear line, thermochromic ink, and a uv reflective marker to guarantee consumer safety.
  • Implementing these unified security measures has reduced tampering incidents by 22% across retail distribution networks. Additionally, the shift toward biaxial orientation technology enables the production of ultra-thin, high shrinkage film that minimizes margin compression for converters.
  • This down-gauging process has successfully lowered transportation freight costs by 12% per labeled unit. As corporate buyers prioritize dynamic inventory management, the reliance on secure, visually dominant 360-degree branding continues to dictate packaging procurement strategies globally.

What are the market trends shaping the Shrink Sleeve And Stretch Sleeve Labels Industry?

  • The accelerated scaling of floatable and label-to-label recyclable films constitutes a primary technological trend. This shift is driven by the industry-wide mandate to achieve circular economy integration and reduce plastic waste.

  • The evolution of Shrink Sleeve And Stretch Sleeve Labels is characterized by the accelerated commercialization of sustainable film technologies designed for closed loop processing. Material developers are engineering a robust cpet shrink sleeve to address stringent circular economy integration guidelines.
  • The transition toward a highly precise rotary application turret handling oriented polystyrene has improved application throughput efficiency by 18% over legacy equipment. Simultaneously, the integration of a digital serialization marker directly into the label provides real-time track and trace authentication, reducing supply chain inventory errors by 14%.
  • The incorporation of a near field communication chip within premium packaging lines further enhances anti counterfeiting security. These trends demonstrate how the petrochemical supply chain is optimizing the embodied carbon footprint by utilizing post consumer recycled content, ultimately maximizing cold application cost efficiency.

What challenges does the Shrink Sleeve And Stretch Sleeve Labels Industry face during its growth?

  • Technical recyclability barriers and the persistent risk of polyethylene terephthalate stream contamination pose significant structural challenges to industry advancement.

  • Achieving precise graphic fidelity across highly asymmetrical container geometries presents a critical structural challenge for Shrink Sleeve And Stretch Sleeve Labels manufacturers. During heat activation, non-uniform dimensional contraction frequently causes thermal seam failure, increasing scrap rates by 15% on high-speed production lines. Overcoming these distortions requires complex three dimensional grid projection software, which extends pre-press setup durations.
  • Furthermore, dense polymers often sink alongside a rigid pet container flake, creating persistent friction with recycling streams. These materials obstruct an optical near infrared sensor, diverting otherwise recyclable items to landfills and penalizing packaging sustainability metrics by 20%.
  • The volatile pricing of bio based resin, such as polylactic acid, and the high capital overhead required for precision rotogravure press equipment further restrict small-scale packagers from adopting advanced circular labeling solutions efficiently.

Exclusive Technavio Analysis on Customer Landscape

The shrink sleeve and stretch sleeve labels market forecasting report includes the adoption lifecycle of the market, covering from the innovator’s stage to the laggard’s stage. It focuses on adoption rates in different regions based on penetration. Furthermore, the shrink sleeve and stretch sleeve labels market report also includes key purchase criteria and drivers of price sensitivity to help companies evaluate and develop their market growth analysis strategies.
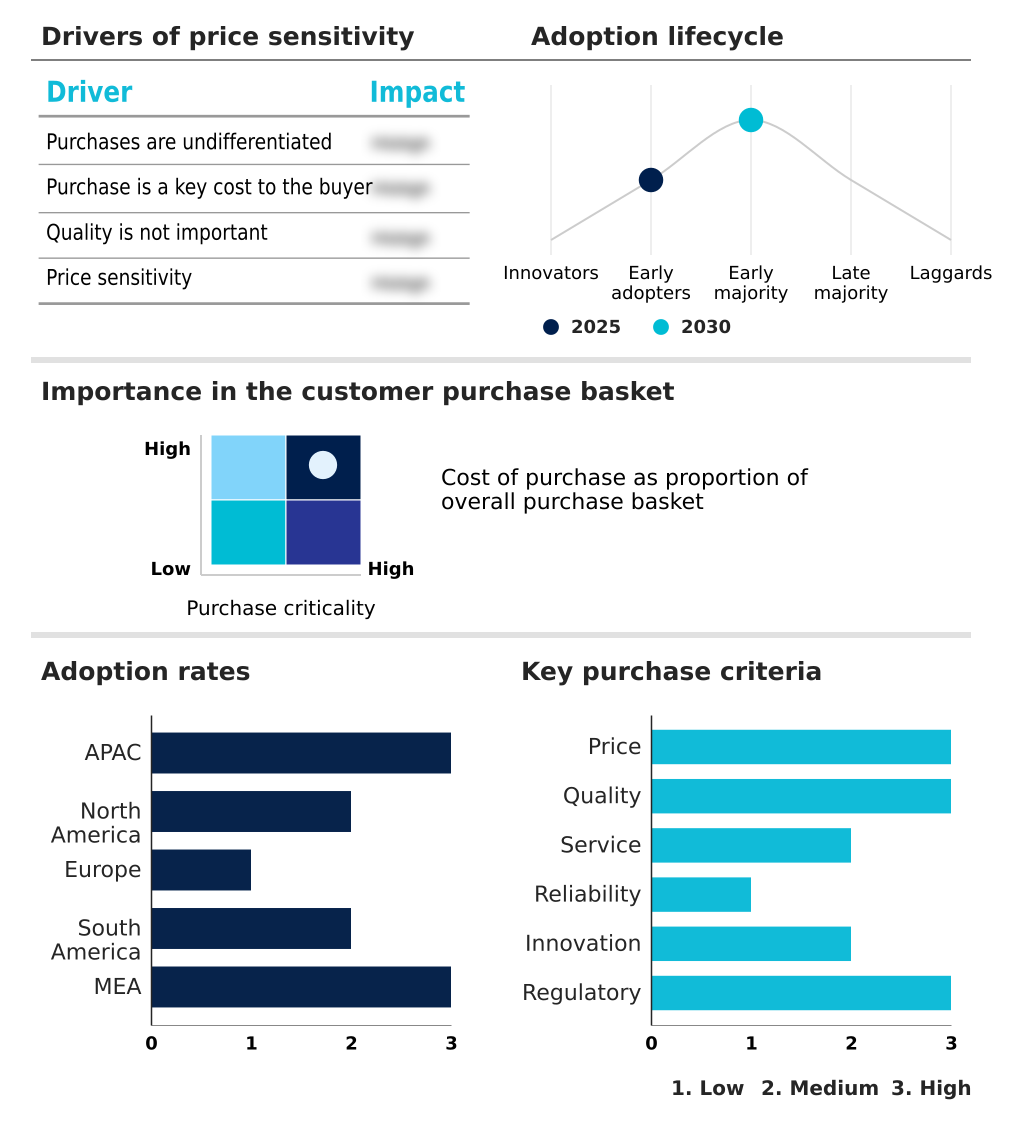
Customer Landscape of Shrink Sleeve And Stretch Sleeve Labels Industry

Competitive Landscape

Companies are implementing various strategies, such as strategic alliances, shrink sleeve and stretch sleeve labels market forecast, partnerships, mergers and acquisitions, geographical expansion, and product/service launches, to enhance their presence in the industry.

All4Labels Global Packaging - The enterprise provides specialized labeling solutions, including full-body and stretch sleeves, tailored for consumer goods to maximize brand visibility and ensure secure packaging conformity.

The industry research and growth report includes detailed analyses of the competitive landscape of the market and information about key companies, including:

  • All4Labels Global Packaging
  • Asteria Group
  • Belmark Inc.
  • Blue Label Packaging Co
  • Brook and Whittle Ltd
  • CCL Label
  • Century Label
  • Consolidated Label Co.
  • Constantia Flexibles GmbH
  • Dase Sing Packaging Technology
  • Fortis Solutions Group
  • Fuji Seal International Inc.
  • Groupe Autajon
  • Huhtamaki Oyj
  • Inland Label and Marketing Service
  • Masterpress S.A.
  • Multi Color Corp.
  • Reflex Labels Ltd.
  • Resource Label Group LLC
  • Smyth Companies LLC

Qualitative and quantitative analysis of companies has been conducted to help clients understand the wider business environment as well as the strengths and weaknesses of key industry players. Data is qualitatively analyzed to categorize companies as pure play, category-focused, industry-focused, and diversified; it is quantitatively analyzed to categorize companies as dominant, leading, strong, tentative, and weak.

Recent Development and News in Shrink sleeve and stretch sleeve labels market

  • In the Diversified Support Services industry, the transition toward closed loop processing for commercial waste management has forced material suppliers to formulate water washable ink, directly impacting Shrink Sleeve And Stretch Sleeve Labels demand by necessitating the adoption of crystallizable pet substrates that separate cleanly from rigid pet container flake.
  • Mandated extended producer responsibility frameworks across retail sectors have penalized non-separable packaging decorations, driving a 22% increase in the procurement of high shrinkage film designed with post consumer recycled content.
  • The automation of anti counterfeiting security protocols in pharmaceutical logistics has accelerated the integration of digital serialization marker technology and a near field communication chip into primary packaging, altering labeling workflows to include dynamic inventory management capabilities.
  • Advancements in biaxial orientation technology by heavy industrial packaging providers have reduced the embodied carbon footprint of commercial supplies, shifting labeling preferences toward ultra-thin stretch materials that improve cold application cost efficiency by 18% during high-volume production.

Dive into Technavio’s robust research methodology, blending expert interviews, extensive data synthesis, and validated models for unparalleled Shrink Sleeve And Stretch Sleeve Labels Market insights. See full methodology.

Market Scope
Page number 303
Base year 2025
Historic period 2020-2024
Forecast period 2026-2030
Growth momentum & CAGR Accelerate at a CAGR of 5.9%
Market growth 2026-2030 USD 5530.0 million
Market structure Fragmented
YoY growth 2025-2026(%) 5.5%
Key countries China, India, Japan, South Korea, Indonesia, Australia, US, Canada, Mexico, Germany, UK, France, Italy, Spain, The Netherlands, Brazil, Argentina, Chile, Saudi Arabia, UAE, South Africa, Turkey and Israel
Competitive landscape Leading Companies, Market Positioning of Companies, Competitive Strategies, and Industry Risks

Request Free Sample

Research Analyst Overview

  • The Shrink Sleeve And Stretch Sleeve Labels domain is rapidly advancing through the integration of sophisticated materials and high-precision converting processes. A dominant structural trend is the transition toward intelligent packaging, directly influencing boardroom-level product strategy and compliance planning.
  • Companies are actively substituting dense polyvinyl chloride with a sustainable bio based resin, such as polylactic acid, to align with stringent environmental targets without sacrificing mechanical performance. This strategic material shift has generated a 24% improvement in automated optical near infrared sensor detection rates at municipal recovery facilities compared to legacy high-density films.
  • Furthermore, to combat illicit supply chain diversion, brand owners are leveraging advanced rotogravure press capabilities to embed covert security features directly into a cpet shrink sleeve. These continuous technical evolutions highlight how specialized sleeve solutions are structurally optimizing consumer safety, mitigating product counterfeiting risks, and satisfying rigorous corporate sustainability mandates across complex international retail networks.

What are the Key Data Covered in this Shrink Sleeve And Stretch Sleeve Labels Market Research and Growth Report?

  • What is the expected growth of the Shrink Sleeve And Stretch Sleeve Labels Market between 2026 and 2030?

    • USD 5.53 billion, at a CAGR of 5.9%

  • What segmentation does the market report cover?

    • The report is segmented by Application (Food and beverage, Healthcare, Beauty and personnel care, and Others), Product Type (Stretch sleeves label, and Shrink sleeves label), Material (PVC, PETG, OPS, PE, and Others) and Geography (APAC, North America, Europe, South America, Middle East and Africa)

  • Which regions are analyzed in the report?

    • APAC, North America, Europe, South America and Middle East and Africa

  • What are the key growth drivers and market challenges?

    • Surging beverage and personal care demand for 360 degree branding, Technical recyclability barriers and pet stream contamination risks

  • Who are the major players in the Shrink Sleeve And Stretch Sleeve Labels Market?

    • All4Labels Global Packaging, Asteria Group, Belmark Inc., Blue Label Packaging Co, Brook and Whittle Ltd, CCL Label, Century Label, Consolidated Label Co., Constantia Flexibles GmbH, Dase Sing Packaging Technology, Fortis Solutions Group, Fuji Seal International Inc., Groupe Autajon, Huhtamaki Oyj, Inland Label and Marketing Service, Masterpress S.A., Multi Color Corp., Reflex Labels Ltd., Resource Label Group LLC and Smyth Companies LLC

Market Research Insights

  • The Shrink Sleeve And Stretch Sleeve Labels Market is undergoing a rapid transformation driven by strict circular economy integration and advanced packaging mandates. Enterprises are prioritizing cold application cost efficiency, resulting in a 25% reduction in utility overhead compared to legacy heat-intensive labeling processes.
  • The strategic adoption of post consumer recycled content within film manufacturing has improved material sustainability metrics by 18%, directly lowering the embodied carbon footprint of finished consumer goods. Furthermore, the integration of track and trace authentication into printed sleeves has enhanced anti counterfeiting security, reducing illicit product diversion by 14% across pharmaceutical supply chains.
  • These quantifiable operational improvements demonstrate how modern packaging networks are simultaneously optimizing cost margins and regulatory compliance profiles.

We can help! Our analysts can customize this shrink sleeve and stretch sleeve labels market research report to meet your requirements.

Get in touch

1. Executive Summary

1.1 Market overview

Executive Summary - Chart on Market Overview
Executive Summary - Data Table on Market Overview
Executive Summary - Chart on Global Market Characteristics
Executive Summary - Chart on Market by Geography
Executive Summary - Chart on Market Segmentation by Application
Executive Summary - Chart on Market Segmentation by Product Type
Executive Summary - Chart on Market Segmentation by Material
Executive Summary - Chart on Incremental Growth
Executive Summary - Data Table on Incremental Growth
Executive Summary - Chart on Company Market Positioning

2. Technavio Analysis

2.1 Analysis of price sensitivity, lifecycle, customer purchase basket, adoption rates, and purchase criteria

2.2 Criticality of inputs and Factors of differentiation

Chart on Overview on criticality of inputs and factors of differentiation

2.3 Factors of disruption

Chart on Overview on factors of disruption

2.4 Impact of drivers and challenges

Chart on Impact of drivers and challenges in 2025 and 2030

3. Market Landscape

3.1 Market ecosystem

Chart on Parent Market
Data Table on - Parent Market

3.2 Market characteristics

Chart on Market characteristics analysis

3.3 Value chain analysis

Chart on Value chain analysis

4. Market Sizing

4.1 Market definition

Data Table on Offerings of companies included in the market definition

4.2 Market segment analysis

Market segments

4.3 Market size 2025

4.4 Market outlook: Forecast for 2025-2030

Chart on Global - Market size and forecast 2025-2030 ($ million)
Data Table on Global - Market size and forecast 2025-2030 ($ million)
Chart on Global Market: Year-over-year growth 2025-2030 (%)
Data Table on Global Market: Year-over-year growth 2025-2030 (%)

5. Historic Market Size

5.1 Global Shrink Sleeve And Stretch Sleeve Labels Market 2020 - 2024

Historic Market Size - Data Table on Global Shrink Sleeve And Stretch Sleeve Labels Market 2020 - 2024 ($ million)

5.2 Application segment analysis 2020 - 2024

Historic Market Size - Application Segment 2020 - 2024 ($ million)

5.3 Product Type segment analysis 2020 - 2024

Historic Market Size - Product Type Segment 2020 - 2024 ($ million)

5.4 Material segment analysis 2020 - 2024

Historic Market Size - Material Segment 2020 - 2024 ($ million)

5.5 Geography segment analysis 2020 - 2024

Historic Market Size - Geography Segment 2020 - 2024 ($ million)

5.6 Country segment analysis 2020 - 2024

Historic Market Size - Country Segment 2020 - 2024 ($ million)

6. Qualitative Analysis

6.1 Impact of AI on global shrink sleeve and stretch sleeve labels market

6.2 Impact of geopolitical conflicts on global shrink sleeve and stretch sleeve labels market

7. Five Forces Analysis

7.1 Five forces summary

Five forces analysis - Comparison between 2025 and 2030

7.2 Bargaining power of buyers

Bargaining power of buyers - Impact of key factors 2025 and 2030

7.3 Bargaining power of suppliers

Bargaining power of suppliers - Impact of key factors in 2025 and 2030

7.4 Threat of new entrants

Threat of new entrants - Impact of key factors in 2025 and 2030

7.5 Threat of substitutes

Threat of substitutes - Impact of key factors in 2025 and 2030

7.6 Threat of rivalry

Threat of rivalry - Impact of key factors in 2025 and 2030

7.7 Market condition

Chart on Market condition - Five forces 2025 and 2030

8. Market Segmentation by Application

8.1 Market segments

Chart on Application - Market share 2025-2030 (%)
Data Table on Application - Market share 2025-2030 (%)

8.2 Comparison by Application

Chart on Comparison by Application
Data Table on Comparison by Application

8.3 Food and beverage - Market size and forecast 2025-2030

Chart on Food and beverage - Market size and forecast 2025-2030 ($ million)
Data Table on Food and beverage - Market size and forecast 2025-2030 ($ million)
Chart on Food and beverage - Year-over-year growth 2025-2030 (%)
Data Table on Food and beverage - Year-over-year growth 2025-2030 (%)

8.4 Healthcare - Market size and forecast 2025-2030

Chart on Healthcare - Market size and forecast 2025-2030 ($ million)
Data Table on Healthcare - Market size and forecast 2025-2030 ($ million)
Chart on Healthcare - Year-over-year growth 2025-2030 (%)
Data Table on Healthcare - Year-over-year growth 2025-2030 (%)

8.5 Beauty and personnel care - Market size and forecast 2025-2030

Chart on Beauty and personnel care - Market size and forecast 2025-2030 ($ million)
Data Table on Beauty and personnel care - Market size and forecast 2025-2030 ($ million)
Chart on Beauty and personnel care - Year-over-year growth 2025-2030 (%)
Data Table on Beauty and personnel care - Year-over-year growth 2025-2030 (%)

8.6 Others - Market size and forecast 2025-2030

Chart on Others - Market size and forecast 2025-2030 ($ million)
Data Table on Others - Market size and forecast 2025-2030 ($ million)
Chart on Others - Year-over-year growth 2025-2030 (%)
Data Table on Others - Year-over-year growth 2025-2030 (%)

8.7 Market opportunity by Application

Market opportunity by Application ($ million)
Data Table on Market opportunity by Application ($ million)

9. Market Segmentation by Product Type

9.1 Market segments

Chart on Product Type - Market share 2025-2030 (%)
Data Table on Product Type - Market share 2025-2030 (%)

9.2 Comparison by Product Type

Chart on Comparison by Product Type
Data Table on Comparison by Product Type

9.3 Stretch sleeves label - Market size and forecast 2025-2030

Chart on Stretch sleeves label - Market size and forecast 2025-2030 ($ million)
Data Table on Stretch sleeves label - Market size and forecast 2025-2030 ($ million)
Chart on Stretch sleeves label - Year-over-year growth 2025-2030 (%)
Data Table on Stretch sleeves label - Year-over-year growth 2025-2030 (%)

9.4 Shrink sleeves label - Market size and forecast 2025-2030

Chart on Shrink sleeves label - Market size and forecast 2025-2030 ($ million)
Data Table on Shrink sleeves label - Market size and forecast 2025-2030 ($ million)
Chart on Shrink sleeves label - Year-over-year growth 2025-2030 (%)
Data Table on Shrink sleeves label - Year-over-year growth 2025-2030 (%)

9.5 Market opportunity by Product Type

Market opportunity by Product Type ($ million)
Data Table on Market opportunity by Product Type ($ million)

10. Market Segmentation by Material

10.1 Market segments

Chart on Material - Market share 2025-2030 (%)
Data Table on Material - Market share 2025-2030 (%)

10.2 Comparison by Material

Chart on Comparison by Material
Data Table on Comparison by Material

10.3 PVC - Market size and forecast 2025-2030

Chart on PVC - Market size and forecast 2025-2030 ($ million)
Data Table on PVC - Market size and forecast 2025-2030 ($ million)
Chart on PVC - Year-over-year growth 2025-2030 (%)
Data Table on PVC - Year-over-year growth 2025-2030 (%)

10.4 PETG - Market size and forecast 2025-2030

Chart on PETG - Market size and forecast 2025-2030 ($ million)
Data Table on PETG - Market size and forecast 2025-2030 ($ million)
Chart on PETG - Year-over-year growth 2025-2030 (%)
Data Table on PETG - Year-over-year growth 2025-2030 (%)

10.5 OPS - Market size and forecast 2025-2030

Chart on OPS - Market size and forecast 2025-2030 ($ million)
Data Table on OPS - Market size and forecast 2025-2030 ($ million)
Chart on OPS - Year-over-year growth 2025-2030 (%)
Data Table on OPS - Year-over-year growth 2025-2030 (%)

10.6 PE - Market size and forecast 2025-2030

Chart on PE - Market size and forecast 2025-2030 ($ million)
Data Table on PE - Market size and forecast 2025-2030 ($ million)
Chart on PE - Year-over-year growth 2025-2030 (%)
Data Table on PE - Year-over-year growth 2025-2030 (%)

10.7 Others - Market size and forecast 2025-2030

Chart on Others - Market size and forecast 2025-2030 ($ million)
Data Table on Others - Market size and forecast 2025-2030 ($ million)
Chart on Others - Year-over-year growth 2025-2030 (%)
Data Table on Others - Year-over-year growth 2025-2030 (%)

10.8 Market opportunity by Material

Market opportunity by Material ($ million)
Data Table on Market opportunity by Material ($ million)

11. Customer Landscape

11.1 Customer landscape overview

Analysis of price sensitivity, lifecycle, customer purchase basket, adoption rates, and purchase criteria

12. Geographic Landscape

12.1 Geographic segmentation

Chart on Market share by geography 2025-2030 (%)
Data Table on Market share by geography 2025-2030 (%)

12.2 Geographic comparison

Chart on Geographic comparison
Data Table on Geographic comparison

12.3 APAC - Market size and forecast 2025-2030

Chart on APAC - Market size and forecast 2025-2030 ($ million)
Data Table on APAC - Market size and forecast 2025-2030 ($ million)
Chart on APAC - Year-over-year growth 2025-2030 (%)
Data Table on APAC - Year-over-year growth 2025-2030 (%)
Chart on Regional Comparison - APAC
Data Table on Regional Comparison - APAC

12.3.1 China - Market size and forecast 2025-2030

Chart on China - Market size and forecast 2025-2030 ($ million)
Data Table on China - Market size and forecast 2025-2030 ($ million)
Chart on China - Year-over-year growth 2025-2030 (%)
Data Table on China - Year-over-year growth 2025-2030 (%)

12.3.2 India - Market size and forecast 2025-2030

Chart on India - Market size and forecast 2025-2030 ($ million)
Data Table on India - Market size and forecast 2025-2030 ($ million)
Chart on India - Year-over-year growth 2025-2030 (%)
Data Table on India - Year-over-year growth 2025-2030 (%)

12.3.3 Japan - Market size and forecast 2025-2030

Chart on Japan - Market size and forecast 2025-2030 ($ million)
Data Table on Japan - Market size and forecast 2025-2030 ($ million)
Chart on Japan - Year-over-year growth 2025-2030 (%)
Data Table on Japan - Year-over-year growth 2025-2030 (%)

12.3.4 South Korea - Market size and forecast 2025-2030

Chart on South Korea - Market size and forecast 2025-2030 ($ million)
Data Table on South Korea - Market size and forecast 2025-2030 ($ million)
Chart on South Korea - Year-over-year growth 2025-2030 (%)
Data Table on South Korea - Year-over-year growth 2025-2030 (%)

12.3.5 Indonesia - Market size and forecast 2025-2030

Chart on Indonesia - Market size and forecast 2025-2030 ($ million)
Data Table on Indonesia - Market size and forecast 2025-2030 ($ million)
Chart on Indonesia - Year-over-year growth 2025-2030 (%)
Data Table on Indonesia - Year-over-year growth 2025-2030 (%)

12.3.6 Australia - Market size and forecast 2025-2030

Chart on Australia - Market size and forecast 2025-2030 ($ million)
Data Table on Australia - Market size and forecast 2025-2030 ($ million)
Chart on Australia - Year-over-year growth 2025-2030 (%)
Data Table on Australia - Year-over-year growth 2025-2030 (%)

12.4 North America - Market size and forecast 2025-2030

Chart on North America - Market size and forecast 2025-2030 ($ million)
Data Table on North America - Market size and forecast 2025-2030 ($ million)
Chart on North America - Year-over-year growth 2025-2030 (%)
Data Table on North America - Year-over-year growth 2025-2030 (%)
Chart on Regional Comparison - North America
Data Table on Regional Comparison - North America

12.4.1 US - Market size and forecast 2025-2030

Chart on US - Market size and forecast 2025-2030 ($ million)
Data Table on US - Market size and forecast 2025-2030 ($ million)
Chart on US - Year-over-year growth 2025-2030 (%)
Data Table on US - Year-over-year growth 2025-2030 (%)

12.4.2 Canada - Market size and forecast 2025-2030

Chart on Canada - Market size and forecast 2025-2030 ($ million)
Data Table on Canada - Market size and forecast 2025-2030 ($ million)
Chart on Canada - Year-over-year growth 2025-2030 (%)
Data Table on Canada - Year-over-year growth 2025-2030 (%)

12.4.3 Mexico - Market size and forecast 2025-2030

Chart on Mexico - Market size and forecast 2025-2030 ($ million)
Data Table on Mexico - Market size and forecast 2025-2030 ($ million)
Chart on Mexico - Year-over-year growth 2025-2030 (%)
Data Table on Mexico - Year-over-year growth 2025-2030 (%)

12.5 Europe - Market size and forecast 2025-2030

Chart on Europe - Market size and forecast 2025-2030 ($ million)
Data Table on Europe - Market size and forecast 2025-2030 ($ million)
Chart on Europe - Year-over-year growth 2025-2030 (%)
Data Table on Europe - Year-over-year growth 2025-2030 (%)
Chart on Regional Comparison - Europe
Data Table on Regional Comparison - Europe

12.5.1 Germany - Market size and forecast 2025-2030

Chart on Germany - Market size and forecast 2025-2030 ($ million)
Data Table on Germany - Market size and forecast 2025-2030 ($ million)
Chart on Germany - Year-over-year growth 2025-2030 (%)
Data Table on Germany - Year-over-year growth 2025-2030 (%)

12.5.2 UK - Market size and forecast 2025-2030

Chart on UK - Market size and forecast 2025-2030 ($ million)
Data Table on UK - Market size and forecast 2025-2030 ($ million)
Chart on UK - Year-over-year growth 2025-2030 (%)
Data Table on UK - Year-over-year growth 2025-2030 (%)

12.5.3 France - Market size and forecast 2025-2030

Chart on France - Market size and forecast 2025-2030 ($ million)
Data Table on France - Market size and forecast 2025-2030 ($ million)
Chart on France - Year-over-year growth 2025-2030 (%)
Data Table on France - Year-over-year growth 2025-2030 (%)

12.5.4 Italy - Market size and forecast 2025-2030

Chart on Italy - Market size and forecast 2025-2030 ($ million)
Data Table on Italy - Market size and forecast 2025-2030 ($ million)
Chart on Italy - Year-over-year growth 2025-2030 (%)
Data Table on Italy - Year-over-year growth 2025-2030 (%)

12.5.5 Spain - Market size and forecast 2025-2030

Chart on Spain - Market size and forecast 2025-2030 ($ million)
Data Table on Spain - Market size and forecast 2025-2030 ($ million)
Chart on Spain - Year-over-year growth 2025-2030 (%)
Data Table on Spain - Year-over-year growth 2025-2030 (%)

12.5.6 The Netherlands - Market size and forecast 2025-2030

Chart on The Netherlands - Market size and forecast 2025-2030 ($ million)
Data Table on The Netherlands - Market size and forecast 2025-2030 ($ million)
Chart on The Netherlands - Year-over-year growth 2025-2030 (%)
Data Table on The Netherlands - Year-over-year growth 2025-2030 (%)

12.6 South America - Market size and forecast 2025-2030

Chart on South America - Market size and forecast 2025-2030 ($ million)
Data Table on South America - Market size and forecast 2025-2030 ($ million)
Chart on South America - Year-over-year growth 2025-2030 (%)
Data Table on South America - Year-over-year growth 2025-2030 (%)
Chart on Regional Comparison - South America
Data Table on Regional Comparison - South America

12.6.1 Brazil - Market size and forecast 2025-2030

Chart on Brazil - Market size and forecast 2025-2030 ($ million)
Data Table on Brazil - Market size and forecast 2025-2030 ($ million)
Chart on Brazil - Year-over-year growth 2025-2030 (%)
Data Table on Brazil - Year-over-year growth 2025-2030 (%)

12.6.2 Argentina - Market size and forecast 2025-2030

Chart on Argentina - Market size and forecast 2025-2030 ($ million)
Data Table on Argentina - Market size and forecast 2025-2030 ($ million)
Chart on Argentina - Year-over-year growth 2025-2030 (%)
Data Table on Argentina - Year-over-year growth 2025-2030 (%)

12.6.3 Chile - Market size and forecast 2025-2030

Chart on Chile - Market size and forecast 2025-2030 ($ million)
Data Table on Chile - Market size and forecast 2025-2030 ($ million)
Chart on Chile - Year-over-year growth 2025-2030 (%)
Data Table on Chile - Year-over-year growth 2025-2030 (%)

12.7 Middle East and Africa - Market size and forecast 2025-2030

Chart on Middle East and Africa - Market size and forecast 2025-2030 ($ million)
Data Table on Middle East and Africa - Market size and forecast 2025-2030 ($ million)
Chart on Middle East and Africa - Year-over-year growth 2025-2030 (%)
Data Table on Middle East and Africa - Year-over-year growth 2025-2030 (%)
Chart on Regional Comparison - Middle East and Africa
Data Table on Regional Comparison - Middle East and Africa

12.7.1 Saudi Arabia - Market size and forecast 2025-2030

Chart on Saudi Arabia - Market size and forecast 2025-2030 ($ million)
Data Table on Saudi Arabia - Market size and forecast 2025-2030 ($ million)
Chart on Saudi Arabia - Year-over-year growth 2025-2030 (%)
Data Table on Saudi Arabia - Year-over-year growth 2025-2030 (%)

12.7.2 UAE - Market size and forecast 2025-2030

Chart on UAE - Market size and forecast 2025-2030 ($ million)
Data Table on UAE - Market size and forecast 2025-2030 ($ million)
Chart on UAE - Year-over-year growth 2025-2030 (%)
Data Table on UAE - Year-over-year growth 2025-2030 (%)

12.7.3 South Africa - Market size and forecast 2025-2030

Chart on South Africa - Market size and forecast 2025-2030 ($ million)
Data Table on South Africa - Market size and forecast 2025-2030 ($ million)
Chart on South Africa - Year-over-year growth 2025-2030 (%)
Data Table on South Africa - Year-over-year growth 2025-2030 (%)

12.7.4 Turkey - Market size and forecast 2025-2030

Chart on Turkey - Market size and forecast 2025-2030 ($ million)
Data Table on Turkey - Market size and forecast 2025-2030 ($ million)
Chart on Turkey - Year-over-year growth 2025-2030 (%)
Data Table on Turkey - Year-over-year growth 2025-2030 (%)

12.7.5 Israel - Market size and forecast 2025-2030

Chart on Israel - Market size and forecast 2025-2030 ($ million)
Data Table on Israel - Market size and forecast 2025-2030 ($ million)
Chart on Israel - Year-over-year growth 2025-2030 (%)
Data Table on Israel - Year-over-year growth 2025-2030 (%)

12.8 Market opportunity by geography

Market opportunity by geography ($ million)
Data Tables on Market opportunity by geography ($ million)

13. Drivers, Challenges, and Opportunity

13.1 Market drivers

Surging beverage and personal care demand for 360 degree branding
Heightened regulatory focus on product integrity and tamper evidence
Operational efficiency gains and energy reduction via stretch sleeve adoption

13.2 Market challenges

Technical recyclability barriers and pet stream contamination risks
Volatile polymer resin pricing and high capital equipment overhead
Distortion management in complex container geometries and high-speed lines

13.3 Impact of drivers and challenges

Impact of drivers and challenges in 2025 and 2030

13.4 Market opportunities

Accelerated scaling of floatable and label to label recyclable films
Integration of digital printing and variable data interactive features
Development of ultra thin stretch films and bio based substrates

14. Competitive Landscape

14.1 Overview

14.2

Overview on criticality of inputs and factors of differentiation

14.3 Landscape disruption

Overview on factors of disruption

14.4 Industry risks

Impact of key risks on business

15. Competitive Analysis

15.1 Companies profiled

Companies covered

15.2 Company ranking index

15.3 Market positioning of companies

Matrix on companies position and classification

15.4 All4Labels Global Packaging

All4Labels Global Packaging - Overview
All4Labels Global Packaging - Product / Service
All4Labels Global Packaging - Key offerings
SWOT

15.5 Asteria Group

Asteria Group - Overview
Asteria Group - Product / Service
Asteria Group - Key offerings
SWOT

15.6 Belmark Inc.

Belmark Inc. - Overview
Belmark Inc. - Product / Service
Belmark Inc. - Key offerings
SWOT

15.7 CCL Label

CCL Label - Overview
CCL Label - Product / Service
CCL Label - Key offerings
SWOT

15.8 Consolidated Label Co.

Consolidated Label Co. - Overview
Consolidated Label Co. - Product / Service
Consolidated Label Co. - Key offerings
SWOT

15.9 Constantia Flexibles GmbH

Constantia Flexibles GmbH - Overview
Constantia Flexibles GmbH - Product / Service
Constantia Flexibles GmbH - Key offerings
SWOT

15.10 Dase Sing Packaging Technology

Dase Sing Packaging Technology - Overview
Dase Sing Packaging Technology - Product / Service
Dase Sing Packaging Technology - Key offerings
SWOT

15.11 Fuji Seal International Inc.

Fuji Seal International Inc. - Overview
Fuji Seal International Inc. - Product / Service
Fuji Seal International Inc. - Key offerings
SWOT

15.12 Groupe Autajon

Groupe Autajon - Overview
Groupe Autajon - Product / Service
Groupe Autajon - Key offerings
SWOT

15.13 Huhtamaki Oyj

Huhtamaki Oyj - Overview
Huhtamaki Oyj - Business segments
Huhtamaki Oyj - Key offerings
Huhtamaki Oyj - Segment focus
SWOT

15.14 Inland Label and Marketing Service

Inland Label and Marketing Service - Overview
Inland Label and Marketing Service - Product / Service
Inland Label and Marketing Service - Key offerings
SWOT

15.15 Multi Color Corp.

Multi Color Corp. - Overview
Multi Color Corp. - Product / Service
Multi Color Corp. - Key offerings
SWOT

15.16 Reflex Labels Ltd.

Reflex Labels Ltd. - Overview
Reflex Labels Ltd. - Product / Service
Reflex Labels Ltd. - Key offerings
SWOT

15.17 Resource Label Group LLC

Resource Label Group LLC - Overview
Resource Label Group LLC - Product / Service
Resource Label Group LLC - Key offerings
SWOT

15.18 Smyth Companies LLC

Smyth Companies LLC - Overview
Smyth Companies LLC - Product / Service
Smyth Companies LLC - Key offerings
SWOT

16. Appendix

16.1 Scope of the report

Market definition
Objectives
Notes and caveats

16.2 Inclusions and exclusions checklist

Inclusions checklist
Exclusions checklist

16.3 Currency conversion rates for US$

16.4 Research methodology

16.5 Data procurement

Information sources

16.6 Data validation

16.7 Validation techniques employed for market sizing

16.8 Data synthesis

16.9 360 degree market analysis

16.10 List of abbreviations

Research Methodology

Technavio presents a detailed picture of the market by way of study, synthesis, and summation of data from multiple sources. The analysts have presented the various facets of the market with a particular focus on identifying the key industry influencers. The data thus presented is comprehensive, reliable, and the result of extensive research, both primary and secondary.

INFORMATION SOURCES

Primary sources

  • Manufacturers and suppliers
  • Channel partners
  • Industry experts
  • Strategic decision makers

Secondary sources

  • Industry journals and periodicals
  • Government data
  • Financial reports of key industry players
  • Historical data
  • Press releases

DATA ANALYSIS

Data Synthesis

  • Collation of data
  • Estimation of key figures
  • Analysis of derived insights

Data Validation

  • Triangulation with data models
  • Reference against proprietary databases
  • Corroboration with industry experts

REPORT WRITING

Qualitative

  • Market drivers
  • Market challenges
  • Market trends
  • Five forces analysis

Quantitative

  • Market size and forecast
  • Market segmentation
  • Geographical insights
  • Competitive landscape

Interested in this report?

Get your sample now to see our research methodology and insights!

Download Now

Frequently Asked Questions

Shrink Sleeve And Stretch Sleeve Labels market growth will increase by USD 5530.0 million during 2026-2030.

The Shrink Sleeve And Stretch Sleeve Labels market is expected to grow at a CAGR of 5.9% during 2026-2030.

Shrink Sleeve And Stretch Sleeve Labels market is segmented by Application (Food and beverage, Healthcare, Beauty and personnel care, Others) Product type (Stretch sleeves label, Shrink sleeves label) Material (PVC, PETG, OPS, PE, Others)

All4Labels Global Packaging, Asteria Group, Belmark Inc., Blue Label Packaging Co, Brook and Whittle Ltd, CCL Label, Century Label, Consolidated Label Co., Constantia Flexibles GmbH, Dase Sing Packaging Technology, Fortis Solutions Group, Fuji Seal International Inc., Groupe Autajon, Huhtamaki Oyj, Inland Label and Marketing Service, Masterpress S.A., Multi Color Corp., Reflex Labels Ltd., Resource Label Group LLC, Smyth Companies LLC are a few of the key vendors in the Shrink Sleeve And Stretch Sleeve Labels market.

APAC will register the highest growth rate of 43% among the other regions. Therefore, the Shrink Sleeve And Stretch Sleeve Labels market in APAC is expected to garner significant business opportunities for the vendors during the forecast period.

China, India, Japan, South Korea, Indonesia, Australia, US, Canada, Mexico, Germany, UK, France, Italy, Spain, The Netherlands, Brazil, Argentina, Chile, Saudi Arabia, UAE, South Africa, Turkey, Israel

  • Surging beverage and personal care demand for 360 degree branding is the driving factor this market.

The Shrink Sleeve And Stretch Sleeve Labels market vendors should focus on grabbing business opportunities from the Application segment as it accounted for the largest market share in the base year.
RIA - Research AI Assistant
Ask RIA
