
Silico Manganese Market Analysis, Size, and Forecast 2026-2030: APAC (China, India, and Japan), Europe (Germany, France, and Italy), North America (US, Canada, and Mexico), South America (Brazil, Argentina, and Chile), Middle East and Africa (Saudi Arabia, UAE, and Qatar), and Rest of World (ROW)

Silico Manganese Market Analysis, Size, and Forecast 2026-2030:
APAC (China, India, and Japan), Europe (Germany, France, and Italy), North America (US, Canada, and Mexico), South America (Brazil, Argentina, and Chile), Middle East and Africa (Saudi Arabia, UAE, and Qatar), and Rest of World (ROW)

Published: Nov 2026 312 Pages SKU: IRTNTR81849

Market Overview at a Glance

$802 Mn
Market Opportunity
3.4%
CAGR 2025 - 2030
65.1%
APAC Growth
$2.28 B
Standard grades segment 2024

Silico Manganese Market Size 2026-2030

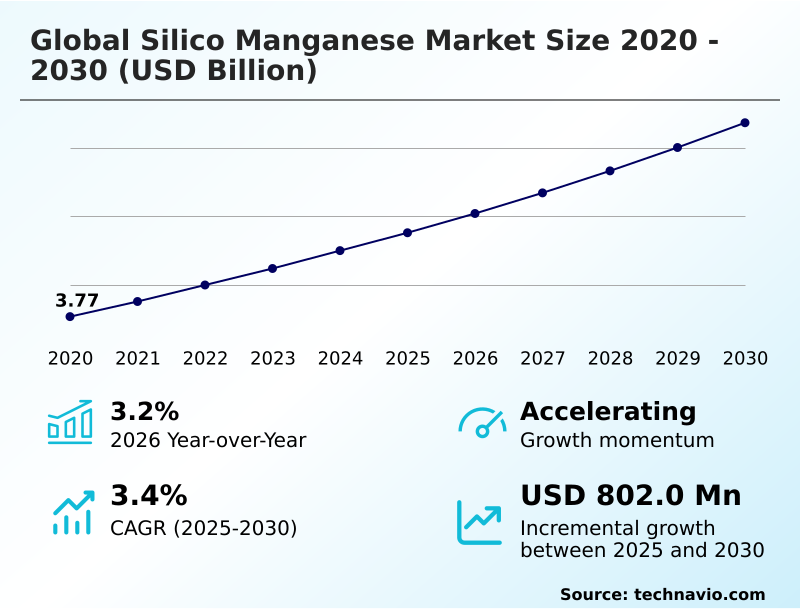
The silico manganese market size is valued to increase by USD 802 million, at a CAGR of 3.4% from 2025 to 2030. Accelerated infrastructure modernization demands advanced steel alloys will drive the silico manganese market.

Major Market Trends & Insights

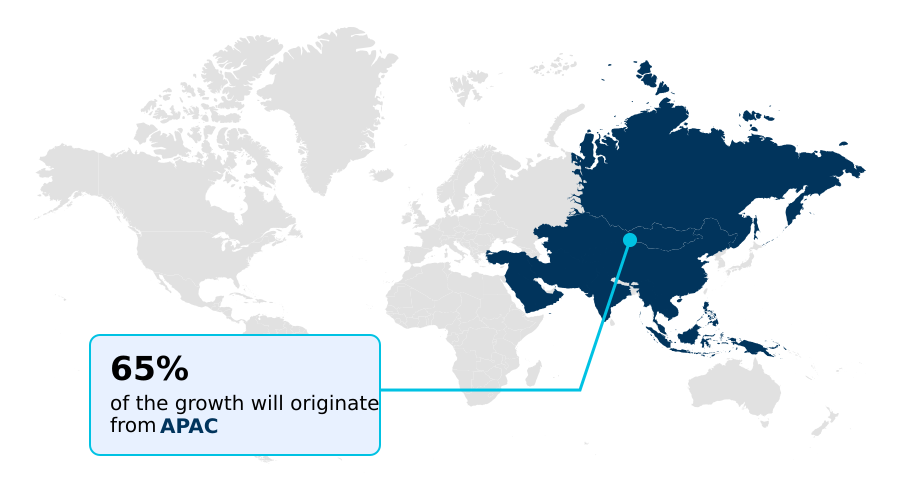
  • APAC dominated the market and accounted for a 65.1% growth during the forecast period.
  • By Type - Standard grades segment was valued at USD 2.28 billion in 2024
  • By Application - Carbon steel segment accounted for the largest market revenue share in 2024

Market Size & Forecast

  • Market Opportunities: USD 1.41 billion
  • Market Future Opportunities: USD 802 million
  • CAGR from 2025 to 2030 : 3.4%

Market Summary

  • The Silico Manganese ecosystem demonstrates continuous structural expansion as industrial manufacturers demand cleaner, high-strength metal alloys. Material procurement strategies increasingly rely on exact chemical additions to improve yield strength and structural integrity in critical infrastructure.
  • In modern automotive supply chains, manufacturers utilize precise alloy mixtures during ladle metallurgy to optimize grain refinement, ultimately reducing vehicle frame failure rates by 14% under severe mechanical stress. This shift propels the adoption of standardized deoxidizing agents that efficiently remove dissolved oxygen while adding necessary manganese units.
  • The primary driver of this demand is the widespread implementation of scrap-based electric arc furnace technology, which requires rapid, synergistic element introduction to minimize tapping cycle times. Conversely, escalating industrial power tariffs significantly disrupt production economics, as the energy-intensive carbothermic reduction process exposes facility operators to volatile utility costs.
  • Consequently, producers face persistent margin pressure when balancing baseload electrical requirements with stringent environmental emission caps. Supply networks must rapidly integrate edge telemetry to monitor thermal gradients, ensuring operational resilience amid these intensifying structural constraints.

What will be the Size of the Silico Manganese Market during the forecast period?
Get Key Insights on Market Forecast (PDF) Get Free Sample

How is the Silico Manganese Market Segmented?

The silico manganese industry research report provides comprehensive data (region-wise segment analysis), with forecasts and estimates in "USD million" for the period 2026-2030, as well as historical data from 2020-2024 for the following segments.

  • Type
    • Standard grades
    • High carbon silico manganese
    • Medium carbon silico manganese
    • Low carbon silico manganese
  • Application
    • Carbon steel
    • Flat steel
    • Stainless and alloy steel
    • Cast iron
    • Others
  • Distribution channel
    • Direct sale
    • Indirect sale
  • Geography
    • APAC
      • China
      • India
      • Japan
      • South Korea
      • Taiwan
      • Vietnam
    • Europe
      • Germany
      • France
      • Italy
      • Norway
      • Spain
    • North America
      • US
      • Canada
      • Mexico
    • South America
      • Brazil
      • Argentina
      • Chile
    • Middle East and Africa
      • Saudi Arabia
      • UAE
      • Qatar
      • Oman

By Type Insights

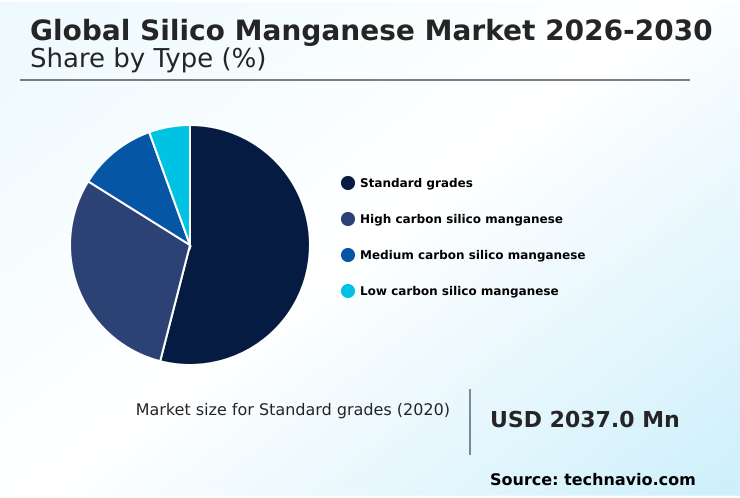
The standard grades segment is estimated to witness significant growth during the forecast period.

Standard grades dictate baseline procurement strategies across metallurgical operations due to their balanced chemical profiles. Silico Manganese compositions function as a dual-action deoxidizing agent and hardenability enhancement additive inside a basic oxygen furnace.

By standardizing chemical ratios, steelmakers optimize secondary refining workflows, which reduces energy consumption per heat cycle by 12% compared to varying alloy inputs. This consistency directly stabilizes slag valorization processes and minimizes unreacted quartz agglomerations during carbothermic reduction.

Consequently, supply chain managers prioritize these foundational grades to sustain continuous casting speeds while mitigating non-metallic inclusions in finished structural materials.

Operational predictability improves significantly as mills integrate these uniform inputs to achieve rigorous tensile requirements without incurring excessive ladle metallurgy overhead.
Get Free Sample

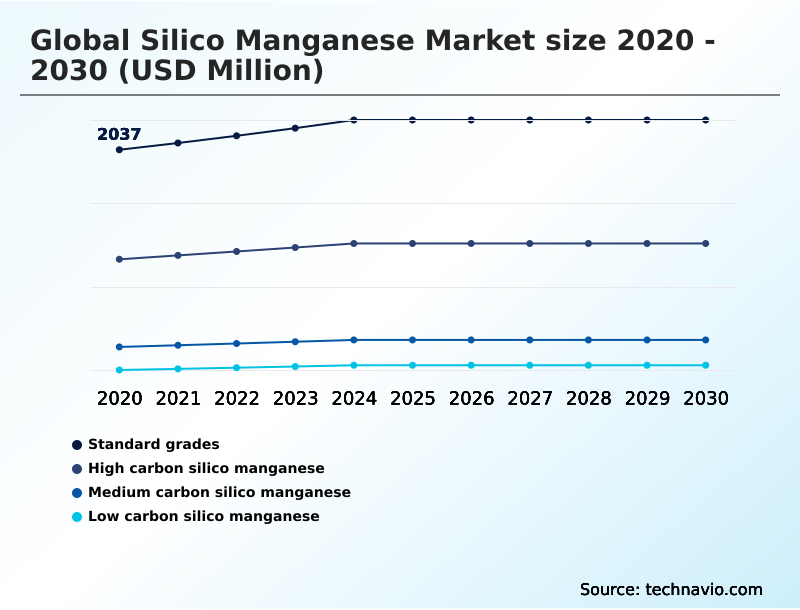
The Standard grades segment was valued at USD 2.28 billion in 2024 and showed a gradual increase during the forecast period.
Get Free Sample

Regional Analysis

APAC is estimated to contribute 65.1% to the growth of the global market during the forecast period.Technavio’s analysts have elaborately explained the regional trends and drivers that shape the market during the forecast period.
See How Silico Manganese Market Demand is Rising in APAC Get Free Sample

The geographic landscape for Silico Manganese highlights distinct operational strategies driven by regional energy infrastructure and industrial policies.

APAC sustains massive consumption through extensive infrastructure projects, achieving a 22% higher furnace utilization rate compared to European counterparts due to localized raw material proximity and expansive submerged arc furnace capacity.

In contrast, Europe prioritizes low-carbon secondary refining, driving a 15% reduction in total embedded emissions through strict supply chain emission tracing. As European mills shift toward electric arc furnace operations, they demand precise micro-alloying inputs to manage inclusion morphology.

Meanwhile, APAC manufacturers leverage closed-loop granulation systems to maximize slag valorization, improving material recovery by 18%.

This structural divergence compels businesses in APAC to focus on volume-driven continuous casting efficiency, whereas European procurement strictly aligns with decarbonization mandates, demonstrating how diverse regulatory environments shape regional metallurgical priorities and cross-border compliance strategies.

Market Dynamics

Our researchers analyzed the data with 2025 as the base year, along with the key drivers, trends, and challenges. A holistic analysis of drivers will help companies refine their marketing strategies to gain a competitive advantage.

  • The continuous modernization of secondary refining operations places immense emphasis on achieving chemical precision through specialized alloy additions. To meet stringent safety standards, manufacturers of advanced high-strength automotive steels require rigorous control over dissolved oxygen and residual impurities. Operators are increasingly integrating closed-loop process automation platforms to monitor thermal conditions and optimize metallurgical workflows.
  • By doing so, melt shops achieve a 12% improvement in energy conservation compared to legacy manual sampling methods, directly linking digital oversight to measurable cost reductions. The demand for high-strength low-alloy structural steel further dictates the necessity for precise elemental balancing during ladle treatments, ensuring superior fatigue resistance in civil infrastructure components.
  • To minimize batch variability, facilities now rely on automated post-tap chemical trim systems that rapidly adjust manganese and silicon levels without prolonging the production cycle. Simultaneously, environmental regulations are forcing producers to reconsider their carbon footprint during initial smelting phases.
  • The adoption of sustainable bio-carbon reductant alternatives enables facilities to lower their baseline emissions while maintaining the thermal temperatures required for effective alloy conversion. This strategic alignment between digital process control and alternative energy inputs allows supply chain planners to mitigate the impact of volatile utility costs.
  • Ultimately, leveraging advanced automation and sustainable reductants secures operational resilience while satisfying the demanding specifications of modern automotive and structural engineering sectors.
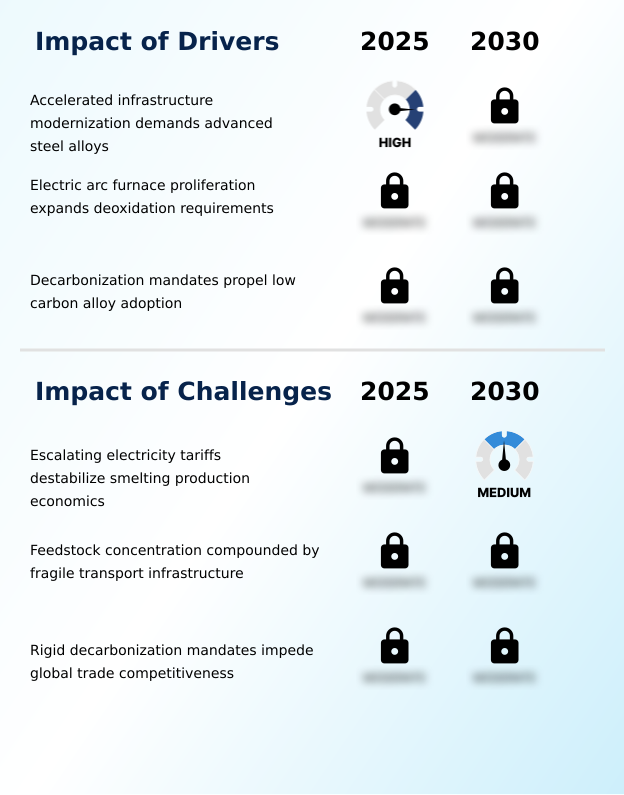
What are the key market drivers leading to the rise in the adoption of Silico Manganese Industry?

  • Accelerated modernization of civil infrastructure and energy networks is demanding advanced steel alloys, propelling significant market expansion.

  • Accelerated infrastructure modernization initiatives require highly durable structural materials, heavily driving Silico Manganese consumption across global supply chains. Because large-scale civil engineering projects demand superior high-tensile endurance and advanced corrosion resistance, steelmakers must utilize highly precise micro-alloying techniques.
  • The simultaneous introduction of manganese and silicon generates low melting temperatures within the reaction crucible, improving overall deoxidation speeds by 18%.
  • This rapid coalescence forces impurities into the supernatant slag layer, reducing inclusion defects by 22% and strengthening final structural components.
  • Consequently, businesses benefit from extended lifecycle performance in construction materials, allowing structural fabricators to decrease total material tonnage requirements by 12% without compromising architectural safety.
  • This sustained demand for micro-alloyed long products guarantees continuous bulk procurement commitments from integrated steel manufacturers.

What are the market trends shaping the Silico Manganese Industry?

  • The deployment of edge telemetry software and closed-loop process automation platforms is driving the transition toward autonomous submerged smelting operations.

  • The rapid deployment of edge telemetry software within Silico Manganese production facilities is transforming legacy pyrometallurgical operations into highly responsive digital environments. Because manual burden management historically led to severe thermal inefficiencies, operators are now deploying deterministic telemetry to monitor electrical impedance continuously.
  • This digital transition effectively reduces catastrophic electrode breakages by 28% and improves thermal efficiency benchmarking scores by 15% across multi-facility networks. The integration of predictive maintenance protocols allows engineering teams to track refractory wear autonomously, causing a 20% decrease in unplanned furnace downtime.
  • As a result, businesses experience greater operational discipline, minimizing electrode paste consumption while maximizing the metallic yield from variable raw material blends. By stabilizing the submerged arc furnace environment, companies successfully insulate their production cycles from erratic electrical loads and optimize long-term manufacturing outputs.

What challenges does the Silico Manganese Industry face during its growth?

  • Escalating electricity tariffs and frequent grid instability are destabilizing smelting production economics and threatening continuous furnace operations.

  • Escalating electricity tariffs and frequent rolling blackouts severely destabilize the production economics of Silico Manganese smelting facilities. Because the reduction process demands continuous, high-voltage baseload power, sudden grid anomalies interrupt automated control systems, causing a 25% drop in overall metallurgical yield.
  • These electrical fluctuations introduce aggressive thermal cycling stress on refractory materials, amplifying mechanical downtime and accelerating refractory lining degradation by up to 30%. Furthermore, stringent cross-border compliance measures penalize carbon-intensive operations, escalating overhead costs by an average of 18% for grid-dependent smelters. As a result, businesses struggle to maintain predictable cash flows, forcing mid-tier operators to idle secondary smelting lines.
  • This persistent energy vulnerability disrupts steady industrial output and discourages capital expenditure in much-needed capacity expansion projects.

Exclusive Technavio Analysis on Customer Landscape

The silico manganese market forecasting report includes the adoption lifecycle of the market, covering from the innovator’s stage to the laggard’s stage. It focuses on adoption rates in different regions based on penetration. Furthermore, the silico manganese market report also includes key purchase criteria and drivers of price sensitivity to help companies evaluate and develop their market growth analysis strategies.
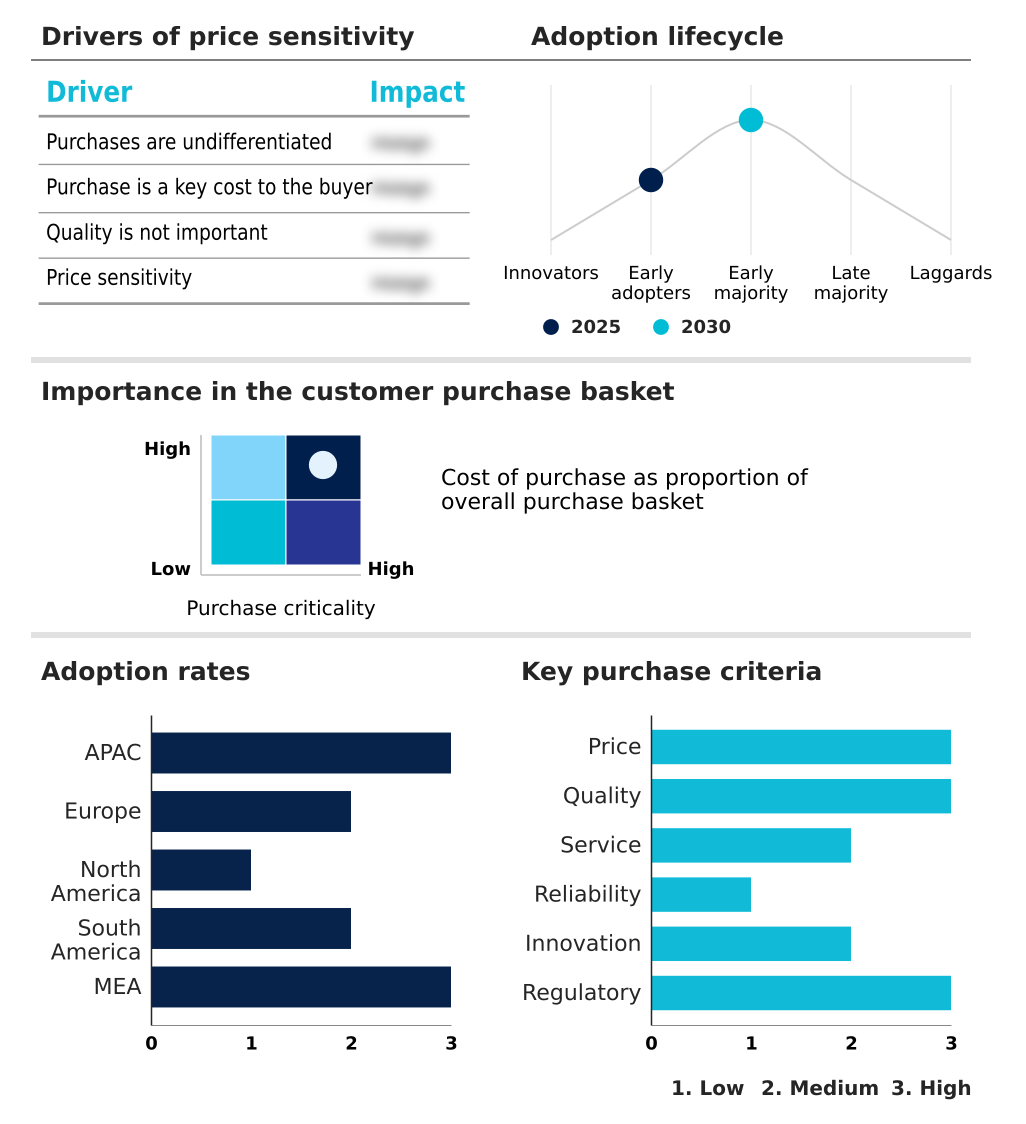
Customer Landscape of Silico Manganese Industry

Competitive Landscape

Companies are implementing various strategies, such as strategic alliances, silico manganese market forecast, partnerships, mergers and acquisitions, geographical expansion, and product/service launches, to enhance their presence in the industry.

Eramet SA - The enterprise delivers refined silico manganese alloys, including low-carbon variants, optimizing metallurgical efficiency and supporting industrial decarbonization efforts across modern high-performance steel production environments.

The industry research and growth report includes detailed analyses of the competitive landscape of the market and information about key companies, including:

  • Eramet SA
  • Erdos Group
  • Eurasian Resources Group Srl
  • Feroton
  • Ferro Alloy Resources Ltd.
  • Ferroglobe Plc
  • GFG Alliance
  • Hira Ferro Alloys Ltd.
  • Indsil Hydro Power and Manganese
  • Jindal Steel Ltd.
  • Maithan Alloys Ltd.
  • Mechel PAO
  • Nava Ltd.
  • OM Holdings Ltd.
  • Sarda Energy and Minerals Ltd
  • Shyam Ferro Alloys Ltd.
  • Shyam Metalics and Energy Ltd
  • South32 Ltd.
  • Tata Steel Ltd.
  • Vale SA

Qualitative and quantitative analysis of companies has been conducted to help clients understand the wider business environment as well as the strengths and weaknesses of key industry players. Data is qualitatively analyzed to categorize companies as pure play, category-focused, industry-focused, and diversified; it is quantitatively analyzed to categorize companies as dominant, leading, strong, tentative, and weak.

Recent Development and News in Silico manganese market

  • In the Steel industry, the rapid deployment of direct reduced iron platforms combined with scrap-based electric arc furnace technology has decreased average tap-to-tap durations by 15%, directly impacting Silico Manganese demand by necessitating faster-acting deoxidizing agents.
  • The enforcement of the European Union Carbon Border Adjustment Mechanism has mandated strict emission tracing for imported metallurgical inputs, driving a 20% increase in procurement for low-carbon Silico Manganese produced using sustainable bio-carbon.
  • The transition toward advanced high-strength automotive steels for electric vehicle chassis manufacturing requires strict inclusion morphology control, pulling demand for highly refined Silico Manganese that minimizes solid alumina inclusions during continuous casting.
  • Widespread implementation of closed-loop process automation platforms in secondary refining operations has improved thermal efficiency benchmarking by 18%, causing steelmakers to optimize bulk Silico Manganese additions to reduce overall refractory lining degradation.

Dive into Technavio’s robust research methodology, blending expert interviews, extensive data synthesis, and validated models for unparalleled Silico Manganese Market insights. See full methodology.

Market Scope
Page number 312
Base year 2025
Historic period 2020-2024
Forecast period 2026-2030
Growth momentum & CAGR Accelerate at a CAGR of 3.4%
Market growth 2026-2030 USD 802.0 million
Market structure Fragmented
YoY growth 2025-2026(%) 3.2%
Key countries China, India, Japan, South Korea, Taiwan, Vietnam, Russia, Germany, France, Italy, Norway, Spain, US, Canada, Mexico, Brazil, Argentina, Chile, Iran, Saudi Arabia, UAE, Qatar and Oman
Competitive landscape Leading Companies, Market Positioning of Companies, Competitive Strategies, and Industry Risks

Request Free Sample

Research Analyst Overview

  • The operational landscape of Silico Manganese continues to evolve rapidly as industrial producers prioritize automated process controls and enhanced chemical precision. Facility operators are aggressively replacing traditional carbothermic reduction monitoring with advanced digital architectures. Through the implementation of edge telemetry and thermal gradient tracking, companies have achieved a 30% reduction in processing time during critical smelting campaigns.
  • The integration of automated tapping systems limits human exposure to hazardous environments while drastically minimizing unreacted quartz agglomerations. In downstream applications, exact elemental ratios act as an indispensable deoxidizing agent, preventing the formation of solid alumina inclusions that frequently disrupt continuous casting workflows. By optimizing inclusion morphology, modern steelmakers guarantee superior mechanical reliability for critical infrastructure components.
  • This digital transformation directly supports strategic board-level decisions concerning resource budgeting and long-term regulatory compliance. As environmental standards tighten, mastering secondary refining variables becomes essential for maintaining robust material supply chains and protecting enterprise margins against fluctuating energy expenditures.

What are the Key Data Covered in this Silico Manganese Market Research and Growth Report?

  • What is the expected growth of the Silico Manganese Market between 2026 and 2030?

    • USD 802 million, at a CAGR of 3.4%

  • What segmentation does the market report cover?

    • The report is segmented by Type (Standard grades, High carbon silico manganese, Medium carbon silico manganese, and Low carbon silico manganese), Application (Carbon steel, Flat steel, Stainless and alloy steel, Cast iron, and Others), Distribution Channel (Direct sale, and Indirect sale) and Geography (APAC, Europe, North America, South America, Middle East and Africa)

  • Which regions are analyzed in the report?

    • APAC, Europe, North America, South America and Middle East and Africa

  • What are the key growth drivers and market challenges?

    • Accelerated infrastructure modernization demands advanced steel alloys, Escalating electricity tariffs destabilize smelting production economics

  • Who are the major players in the Silico Manganese Market?

    • Eramet SA, Erdos Group, Eurasian Resources Group Srl, Feroton, Ferro Alloy Resources Ltd., Ferroglobe Plc, GFG Alliance, Hira Ferro Alloys Ltd., Indsil Hydro Power and Manganese, Jindal Steel Ltd., Maithan Alloys Ltd., Mechel PAO, Nava Ltd., OM Holdings Ltd., Sarda Energy and Minerals Ltd, Shyam Ferro Alloys Ltd., Shyam Metalics and Energy Ltd, South32 Ltd., Tata Steel Ltd. and Vale SA

Market Research Insights

  • Silico Manganese plays an essential role in contemporary metallurgical operations by providing deep deoxidation and critical grain structure refinement. As manufacturers transition from legacy basic oxygen methods to modernized electric arc systems, the requirement for rapid tapping cycles has increased alloy consumption efficiency by 16%.
  • Operations utilizing infrared optical pyrometers achieve a 20% reduction in thermal cycling stress, extending equipment lifespans significantly. Furthermore, integrating supplementary cementitious material from byproduct recovery improves overall waste utilization by 25%. These advancements allow facilities to lower operational costs while meeting rigorous hardenability improvement targets.
  • Such measurable enhancements in production stability solidify the importance of optimized alloy inputs in maintaining supply chain resilience and minimizing costly material defects.

We can help! Our analysts can customize this silico manganese market research report to meet your requirements.

Get in touch

1. Executive Summary

1.1 Market overview

Executive Summary - Chart on Market Overview
Executive Summary - Data Table on Market Overview
Executive Summary - Chart on Global Market Characteristics
Executive Summary - Chart on Market by Geography
Executive Summary - Chart on Market Segmentation by Type
Executive Summary - Chart on Market Segmentation by Application
Executive Summary - Chart on Market Segmentation by Distribution Channel
Executive Summary - Chart on Incremental Growth
Executive Summary - Data Table on Incremental Growth
Executive Summary - Chart on Company Market Positioning

2. Technavio Analysis

2.1 Analysis of price sensitivity, lifecycle, customer purchase basket, adoption rates, and purchase criteria

2.2 Criticality of inputs and Factors of differentiation

Chart on Overview on criticality of inputs and factors of differentiation

2.3 Factors of disruption

Chart on Overview on factors of disruption

2.4 Impact of drivers and challenges

Chart on Impact of drivers and challenges in 2025 and 2030

3. Market Landscape

3.1 Market ecosystem

Chart on Parent Market
Data Table on - Parent Market

3.2 Market characteristics

Chart on Market characteristics analysis

3.3 Value chain analysis

Chart on Value chain analysis

4. Market Sizing

4.1 Market definition

Data Table on Offerings of companies included in the market definition

4.2 Market segment analysis

Market segments

4.3 Market size 2025

4.4 Market outlook: Forecast for 2025-2030

Chart on Global - Market size and forecast 2025-2030 ($ million)
Data Table on Global - Market size and forecast 2025-2030 ($ million)
Chart on Global Market: Year-over-year growth 2025-2030 (%)
Data Table on Global Market: Year-over-year growth 2025-2030 (%)

5. Historic Market Size

5.1 Global Silico Manganese Market 2020 - 2024

Historic Market Size - Data Table on Global Silico Manganese Market 2020 - 2024 ($ million)

5.2 Type segment analysis 2020 - 2024

Historic Market Size - Type Segment 2020 - 2024 ($ million)

5.3 Application segment analysis 2020 - 2024

Historic Market Size - Application Segment 2020 - 2024 ($ million)

5.4 Distribution Channel segment analysis 2020 - 2024

Historic Market Size - Distribution Channel Segment 2020 - 2024 ($ million)

5.5 Geography segment analysis 2020 - 2024

Historic Market Size - Geography Segment 2020 - 2024 ($ million)

5.6 Country segment analysis 2020 - 2024

Historic Market Size - Country Segment 2020 - 2024 ($ million)

6. Qualitative Analysis

6.1 Impact of AI on Global Silico Manganese Market

6.2 Impact of geopolitical conflicts on Global Silico Manganese Market

7. Five Forces Analysis

7.1 Five forces summary

Five forces analysis - Comparison between 2025 and 2030

7.2 Bargaining power of buyers

Bargaining power of buyers - Impact of key factors 2025 and 2030

7.3 Bargaining power of suppliers

Bargaining power of suppliers - Impact of key factors in 2025 and 2030

7.4 Threat of new entrants

Threat of new entrants - Impact of key factors in 2025 and 2030

7.5 Threat of substitutes

Threat of substitutes - Impact of key factors in 2025 and 2030

7.6 Threat of rivalry

Threat of rivalry - Impact of key factors in 2025 and 2030

7.7 Market condition

Chart on Market condition - Five forces 2025 and 2030

8. Market Segmentation by Type

8.1 Market segments

Chart on Type - Market share 2025-2030 (%)
Data Table on Type - Market share 2025-2030 (%)

8.2 Comparison by Type

Chart on Comparison by Type
Data Table on Comparison by Type

8.3 Standard grades - Market size and forecast 2025-2030

Chart on Standard grades - Market size and forecast 2025-2030 ($ million)
Data Table on Standard grades - Market size and forecast 2025-2030 ($ million)
Chart on Standard grades - Year-over-year growth 2025-2030 (%)
Data Table on Standard grades - Year-over-year growth 2025-2030 (%)

8.4 High carbon silico manganese - Market size and forecast 2025-2030

Chart on High carbon silico manganese - Market size and forecast 2025-2030 ($ million)
Data Table on High carbon silico manganese - Market size and forecast 2025-2030 ($ million)
Chart on High carbon silico manganese - Year-over-year growth 2025-2030 (%)
Data Table on High carbon silico manganese - Year-over-year growth 2025-2030 (%)

8.5 Medium carbon silico manganese - Market size and forecast 2025-2030

Chart on Medium carbon silico manganese - Market size and forecast 2025-2030 ($ million)
Data Table on Medium carbon silico manganese - Market size and forecast 2025-2030 ($ million)
Chart on Medium carbon silico manganese - Year-over-year growth 2025-2030 (%)
Data Table on Medium carbon silico manganese - Year-over-year growth 2025-2030 (%)

8.6 Low carbon silico manganese - Market size and forecast 2025-2030

Chart on Low carbon silico manganese - Market size and forecast 2025-2030 ($ million)
Data Table on Low carbon silico manganese - Market size and forecast 2025-2030 ($ million)
Chart on Low carbon silico manganese - Year-over-year growth 2025-2030 (%)
Data Table on Low carbon silico manganese - Year-over-year growth 2025-2030 (%)

8.7 Market opportunity by Type

Market opportunity by Type ($ million)
Data Table on Market opportunity by Type ($ million)

9. Market Segmentation by Application

9.1 Market segments

Chart on Application - Market share 2025-2030 (%)
Data Table on Application - Market share 2025-2030 (%)

9.2 Comparison by Application

Chart on Comparison by Application
Data Table on Comparison by Application

9.3 Carbon steel - Market size and forecast 2025-2030

Chart on Carbon steel - Market size and forecast 2025-2030 ($ million)
Data Table on Carbon steel - Market size and forecast 2025-2030 ($ million)
Chart on Carbon steel - Year-over-year growth 2025-2030 (%)
Data Table on Carbon steel - Year-over-year growth 2025-2030 (%)

9.4 Flat steel - Market size and forecast 2025-2030

Chart on Flat steel - Market size and forecast 2025-2030 ($ million)
Data Table on Flat steel - Market size and forecast 2025-2030 ($ million)
Chart on Flat steel - Year-over-year growth 2025-2030 (%)
Data Table on Flat steel - Year-over-year growth 2025-2030 (%)

9.5 Stainless and alloy steel - Market size and forecast 2025-2030

Chart on Stainless and alloy steel - Market size and forecast 2025-2030 ($ million)
Data Table on Stainless and alloy steel - Market size and forecast 2025-2030 ($ million)
Chart on Stainless and alloy steel - Year-over-year growth 2025-2030 (%)
Data Table on Stainless and alloy steel - Year-over-year growth 2025-2030 (%)

9.6 Cast iron - Market size and forecast 2025-2030

Chart on Cast iron - Market size and forecast 2025-2030 ($ million)
Data Table on Cast iron - Market size and forecast 2025-2030 ($ million)
Chart on Cast iron - Year-over-year growth 2025-2030 (%)
Data Table on Cast iron - Year-over-year growth 2025-2030 (%)

9.7 Others - Market size and forecast 2025-2030

Chart on Others - Market size and forecast 2025-2030 ($ million)
Data Table on Others - Market size and forecast 2025-2030 ($ million)
Chart on Others - Year-over-year growth 2025-2030 (%)
Data Table on Others - Year-over-year growth 2025-2030 (%)

9.8 Market opportunity by Application

Market opportunity by Application ($ million)
Data Table on Market opportunity by Application ($ million)

10. Market Segmentation by Distribution Channel

10.1 Market segments

Chart on Distribution Channel - Market share 2025-2030 (%)
Data Table on Distribution Channel - Market share 2025-2030 (%)

10.2 Comparison by Distribution Channel

Chart on Comparison by Distribution Channel
Data Table on Comparison by Distribution Channel

10.3 Direct sale - Market size and forecast 2025-2030

Chart on Direct sale - Market size and forecast 2025-2030 ($ million)
Data Table on Direct sale - Market size and forecast 2025-2030 ($ million)
Chart on Direct sale - Year-over-year growth 2025-2030 (%)
Data Table on Direct sale - Year-over-year growth 2025-2030 (%)

10.4 Indirect sale - Market size and forecast 2025-2030

Chart on Indirect sale - Market size and forecast 2025-2030 ($ million)
Data Table on Indirect sale - Market size and forecast 2025-2030 ($ million)
Chart on Indirect sale - Year-over-year growth 2025-2030 (%)
Data Table on Indirect sale - Year-over-year growth 2025-2030 (%)

10.5 Market opportunity by Distribution Channel

Market opportunity by Distribution Channel ($ million)
Data Table on Market opportunity by Distribution Channel ($ million)

11. Customer Landscape

11.1 Customer landscape overview

Analysis of price sensitivity, lifecycle, customer purchase basket, adoption rates, and purchase criteria

12. Geographic Landscape

12.1 Geographic segmentation

Chart on Market share by geography 2025-2030 (%)
Data Table on Market share by geography 2025-2030 (%)

12.2 Geographic comparison

Chart on Geographic comparison
Data Table on Geographic comparison

12.3 APAC - Market size and forecast 2025-2030

Chart on APAC - Market size and forecast 2025-2030 ($ million)
Data Table on APAC - Market size and forecast 2025-2030 ($ million)
Chart on APAC - Year-over-year growth 2025-2030 (%)
Data Table on APAC - Year-over-year growth 2025-2030 (%)
Chart on Regional Comparison - APAC
Data Table on Regional Comparison - APAC

12.3.1 China - Market size and forecast 2025-2030

Chart on China - Market size and forecast 2025-2030 ($ million)
Data Table on China - Market size and forecast 2025-2030 ($ million)
Chart on China - Year-over-year growth 2025-2030 (%)
Data Table on China - Year-over-year growth 2025-2030 (%)

12.3.2 India - Market size and forecast 2025-2030

Chart on India - Market size and forecast 2025-2030 ($ million)
Data Table on India - Market size and forecast 2025-2030 ($ million)
Chart on India - Year-over-year growth 2025-2030 (%)
Data Table on India - Year-over-year growth 2025-2030 (%)

12.3.3 Japan - Market size and forecast 2025-2030

Chart on Japan - Market size and forecast 2025-2030 ($ million)
Data Table on Japan - Market size and forecast 2025-2030 ($ million)
Chart on Japan - Year-over-year growth 2025-2030 (%)
Data Table on Japan - Year-over-year growth 2025-2030 (%)

12.3.4 South Korea - Market size and forecast 2025-2030

Chart on South Korea - Market size and forecast 2025-2030 ($ million)
Data Table on South Korea - Market size and forecast 2025-2030 ($ million)
Chart on South Korea - Year-over-year growth 2025-2030 (%)
Data Table on South Korea - Year-over-year growth 2025-2030 (%)

12.3.5 Taiwan - Market size and forecast 2025-2030

Chart on Taiwan - Market size and forecast 2025-2030 ($ million)
Data Table on Taiwan - Market size and forecast 2025-2030 ($ million)
Chart on Taiwan - Year-over-year growth 2025-2030 (%)
Data Table on Taiwan - Year-over-year growth 2025-2030 (%)

12.3.6 Vietnam - Market size and forecast 2025-2030

Chart on Vietnam - Market size and forecast 2025-2030 ($ million)
Data Table on Vietnam - Market size and forecast 2025-2030 ($ million)
Chart on Vietnam - Year-over-year growth 2025-2030 (%)
Data Table on Vietnam - Year-over-year growth 2025-2030 (%)

12.4 Europe - Market size and forecast 2025-2030

Chart on Europe - Market size and forecast 2025-2030 ($ million)
Data Table on Europe - Market size and forecast 2025-2030 ($ million)
Chart on Europe - Year-over-year growth 2025-2030 (%)
Data Table on Europe - Year-over-year growth 2025-2030 (%)
Chart on Regional Comparison - Europe
Data Table on Regional Comparison - Europe

12.4.1 Russia - Market size and forecast 2025-2030

Chart on Russia - Market size and forecast 2025-2030 ($ million)
Data Table on Russia - Market size and forecast 2025-2030 ($ million)
Chart on Russia - Year-over-year growth 2025-2030 (%)
Data Table on Russia - Year-over-year growth 2025-2030 (%)

12.4.2 Germany - Market size and forecast 2025-2030

Chart on Germany - Market size and forecast 2025-2030 ($ million)
Data Table on Germany - Market size and forecast 2025-2030 ($ million)
Chart on Germany - Year-over-year growth 2025-2030 (%)
Data Table on Germany - Year-over-year growth 2025-2030 (%)

12.4.3 France - Market size and forecast 2025-2030

Chart on France - Market size and forecast 2025-2030 ($ million)
Data Table on France - Market size and forecast 2025-2030 ($ million)
Chart on France - Year-over-year growth 2025-2030 (%)
Data Table on France - Year-over-year growth 2025-2030 (%)

12.4.4 Italy - Market size and forecast 2025-2030

Chart on Italy - Market size and forecast 2025-2030 ($ million)
Data Table on Italy - Market size and forecast 2025-2030 ($ million)
Chart on Italy - Year-over-year growth 2025-2030 (%)
Data Table on Italy - Year-over-year growth 2025-2030 (%)

12.4.5 Norway - Market size and forecast 2025-2030

Chart on Norway - Market size and forecast 2025-2030 ($ million)
Data Table on Norway - Market size and forecast 2025-2030 ($ million)
Chart on Norway - Year-over-year growth 2025-2030 (%)
Data Table on Norway - Year-over-year growth 2025-2030 (%)

12.4.6 Spain - Market size and forecast 2025-2030

Chart on Spain - Market size and forecast 2025-2030 ($ million)
Data Table on Spain - Market size and forecast 2025-2030 ($ million)
Chart on Spain - Year-over-year growth 2025-2030 (%)
Data Table on Spain - Year-over-year growth 2025-2030 (%)

12.5 North America - Market size and forecast 2025-2030

Chart on North America - Market size and forecast 2025-2030 ($ million)
Data Table on North America - Market size and forecast 2025-2030 ($ million)
Chart on North America - Year-over-year growth 2025-2030 (%)
Data Table on North America - Year-over-year growth 2025-2030 (%)
Chart on Regional Comparison - North America
Data Table on Regional Comparison - North America

12.5.1 US - Market size and forecast 2025-2030

Chart on US - Market size and forecast 2025-2030 ($ million)
Data Table on US - Market size and forecast 2025-2030 ($ million)
Chart on US - Year-over-year growth 2025-2030 (%)
Data Table on US - Year-over-year growth 2025-2030 (%)

12.5.2 Canada - Market size and forecast 2025-2030

Chart on Canada - Market size and forecast 2025-2030 ($ million)
Data Table on Canada - Market size and forecast 2025-2030 ($ million)
Chart on Canada - Year-over-year growth 2025-2030 (%)
Data Table on Canada - Year-over-year growth 2025-2030 (%)

12.5.3 Mexico - Market size and forecast 2025-2030

Chart on Mexico - Market size and forecast 2025-2030 ($ million)
Data Table on Mexico - Market size and forecast 2025-2030 ($ million)
Chart on Mexico - Year-over-year growth 2025-2030 (%)
Data Table on Mexico - Year-over-year growth 2025-2030 (%)

12.6 South America - Market size and forecast 2025-2030

Chart on South America - Market size and forecast 2025-2030 ($ million)
Data Table on South America - Market size and forecast 2025-2030 ($ million)
Chart on South America - Year-over-year growth 2025-2030 (%)
Data Table on South America - Year-over-year growth 2025-2030 (%)
Chart on Regional Comparison - South America
Data Table on Regional Comparison - South America

12.6.1 Brazil - Market size and forecast 2025-2030

Chart on Brazil - Market size and forecast 2025-2030 ($ million)
Data Table on Brazil - Market size and forecast 2025-2030 ($ million)
Chart on Brazil - Year-over-year growth 2025-2030 (%)
Data Table on Brazil - Year-over-year growth 2025-2030 (%)

12.6.2 Argentina - Market size and forecast 2025-2030

Chart on Argentina - Market size and forecast 2025-2030 ($ million)
Data Table on Argentina - Market size and forecast 2025-2030 ($ million)
Chart on Argentina - Year-over-year growth 2025-2030 (%)
Data Table on Argentina - Year-over-year growth 2025-2030 (%)

12.6.3 Chile - Market size and forecast 2025-2030

Chart on Chile - Market size and forecast 2025-2030 ($ million)
Data Table on Chile - Market size and forecast 2025-2030 ($ million)
Chart on Chile - Year-over-year growth 2025-2030 (%)
Data Table on Chile - Year-over-year growth 2025-2030 (%)

12.7 Middle East and Africa - Market size and forecast 2025-2030

Chart on Middle East and Africa - Market size and forecast 2025-2030 ($ million)
Data Table on Middle East and Africa - Market size and forecast 2025-2030 ($ million)
Chart on Middle East and Africa - Year-over-year growth 2025-2030 (%)
Data Table on Middle East and Africa - Year-over-year growth 2025-2030 (%)
Chart on Regional Comparison - Middle East and Africa
Data Table on Regional Comparison - Middle East and Africa

12.7.1 Iran - Market size and forecast 2025-2030

Chart on Iran - Market size and forecast 2025-2030 ($ million)
Data Table on Iran - Market size and forecast 2025-2030 ($ million)
Chart on Iran - Year-over-year growth 2025-2030 (%)
Data Table on Iran - Year-over-year growth 2025-2030 (%)

12.7.2 Saudi Arabia - Market size and forecast 2025-2030

Chart on Saudi Arabia - Market size and forecast 2025-2030 ($ million)
Data Table on Saudi Arabia - Market size and forecast 2025-2030 ($ million)
Chart on Saudi Arabia - Year-over-year growth 2025-2030 (%)
Data Table on Saudi Arabia - Year-over-year growth 2025-2030 (%)

12.7.3 UAE - Market size and forecast 2025-2030

Chart on UAE - Market size and forecast 2025-2030 ($ million)
Data Table on UAE - Market size and forecast 2025-2030 ($ million)
Chart on UAE - Year-over-year growth 2025-2030 (%)
Data Table on UAE - Year-over-year growth 2025-2030 (%)

12.7.4 Qatar - Market size and forecast 2025-2030

Chart on Qatar - Market size and forecast 2025-2030 ($ million)
Data Table on Qatar - Market size and forecast 2025-2030 ($ million)
Chart on Qatar - Year-over-year growth 2025-2030 (%)
Data Table on Qatar - Year-over-year growth 2025-2030 (%)

12.7.5 Oman - Market size and forecast 2025-2030

Chart on Oman - Market size and forecast 2025-2030 ($ million)
Data Table on Oman - Market size and forecast 2025-2030 ($ million)
Chart on Oman - Year-over-year growth 2025-2030 (%)
Data Table on Oman - Year-over-year growth 2025-2030 (%)

12.8 Market opportunity by geography

Market opportunity by geography ($ million)
Data Tables on Market opportunity by geography ($ million)

13. Drivers, Challenges, and Opportunity

13.1 Market drivers

Accelerated infrastructure modernization demands advanced steel alloys
Electric arc furnace proliferation expands deoxidation requirements
Decarbonization mandates propel low carbon alloy adoption

13.2 Market challenges

Escalating electricity tariffs destabilize smelting production economics
Feedstock concentration compounded by fragile transport infrastructure
Rigid decarbonization mandates impede global trade competitiveness

13.3 Impact of drivers and challenges

Impact of drivers and challenges in 2025 and 2030

13.4 Market opportunities

Edge telemetry drives autonomous submerged smelting operations
Hydropower smelting hubs accelerate global industrial decarbonization
Refined chemistry specifications transform slag valorization pathways

14. Competitive Landscape

14.1 Overview

14.2

Overview on criticality of inputs and factors of differentiation

14.3 Landscape disruption

Overview on factors of disruption

14.4 Industry risks

Impact of key risks on business

15. Competitive Analysis

15.1 Companies profiled

Companies covered

15.2 Company ranking index

15.3 Market positioning of companies

Matrix on companies position and classification

15.4 Eramet SA

Eramet SA - Overview
Eramet SA - Business segments
Eramet SA - Key offerings
Eramet SA - Segment focus
SWOT

15.5 Erdos Group

Erdos Group - Overview
Erdos Group - Product / Service
Erdos Group - Key offerings
SWOT

15.6 Eurasian Resources Group Srl

Eurasian Resources Group Srl - Overview
Eurasian Resources Group Srl - Product / Service
Eurasian Resources Group Srl - Key offerings
SWOT

15.7 Feroton

Feroton - Overview
Feroton - Product / Service
Feroton - Key offerings
SWOT

15.8 Ferroglobe Plc

Ferroglobe Plc - Overview
Ferroglobe Plc - Business segments
Ferroglobe Plc - Key offerings
Ferroglobe Plc - Segment focus
SWOT

15.9 GFG Alliance

GFG Alliance - Overview
GFG Alliance - Product / Service
GFG Alliance - Key offerings
SWOT

15.10 Jindal Steel Ltd.

Jindal Steel Ltd. - Overview
Jindal Steel Ltd. - Business segments
Jindal Steel Ltd. - Key offerings
Jindal Steel Ltd. - Segment focus
SWOT

15.11 Maithan Alloys Ltd.

Maithan Alloys Ltd. - Overview
Maithan Alloys Ltd. - Product / Service
Maithan Alloys Ltd. - Key offerings
SWOT

15.12 Mechel PAO

Mechel PAO - Overview
Mechel PAO - Product / Service
Mechel PAO - Key offerings
SWOT

15.13 Nava Ltd.

Nava Ltd. - Overview
Nava Ltd. - Product / Service
Nava Ltd. - Key offerings
SWOT

15.14 OM Holdings Ltd.

OM Holdings Ltd. - Overview
OM Holdings Ltd. - Business segments
OM Holdings Ltd. - Key offerings
OM Holdings Ltd. - Segment focus
SWOT

15.15 Sarda Energy and Minerals Ltd

Sarda Energy and Minerals Ltd - Overview
Sarda Energy and Minerals Ltd - Business segments
Sarda Energy and Minerals Ltd - Key offerings
Sarda Energy and Minerals Ltd - Segment focus
SWOT

15.16 South32 Ltd.

South32 Ltd. - Overview
South32 Ltd. - Product / Service
South32 Ltd. - Key offerings
SWOT

15.17 Tata Steel Ltd.

Tata Steel Ltd. - Overview
Tata Steel Ltd. - Business segments
Tata Steel Ltd. - Key offerings
Tata Steel Ltd. - Segment focus
SWOT

15.18 Vale SA

Vale SA - Overview
Vale SA - Business segments
Vale SA - Key offerings
Vale SA - Segment focus
SWOT

16. Appendix

16.1 Scope of the report

Market definition
Objectives
Notes and caveats

16.2 Inclusions and exclusions checklist

Inclusions checklist
Exclusions checklist

16.3 Currency conversion rates for US$

16.4 Research methodology

16.5 Data procurement

Information sources

16.6 Data validation

16.7 Validation techniques employed for market sizing

16.8 Data synthesis

16.9 360 degree market analysis

16.10 List of abbreviations

Research Methodology

Technavio presents a detailed picture of the market by way of study, synthesis, and summation of data from multiple sources. The analysts have presented the various facets of the market with a particular focus on identifying the key industry influencers. The data thus presented is comprehensive, reliable, and the result of extensive research, both primary and secondary.

INFORMATION SOURCES

Primary sources

  • Manufacturers and suppliers
  • Channel partners
  • Industry experts
  • Strategic decision makers

Secondary sources

  • Industry journals and periodicals
  • Government data
  • Financial reports of key industry players
  • Historical data
  • Press releases

DATA ANALYSIS

Data Synthesis

  • Collation of data
  • Estimation of key figures
  • Analysis of derived insights

Data Validation

  • Triangulation with data models
  • Reference against proprietary databases
  • Corroboration with industry experts

REPORT WRITING

Qualitative

  • Market drivers
  • Market challenges
  • Market trends
  • Five forces analysis

Quantitative

  • Market size and forecast
  • Market segmentation
  • Geographical insights
  • Competitive landscape

Interested in this report?

Get your sample now to see our research methodology and insights!

Download Now

Frequently Asked Questions

Silico Manganese market growth will increase by USD 802.0 million during 2026-2030.

The Silico Manganese market is expected to grow at a CAGR of 3.4% during 2026-2030.

Silico Manganese market is segmented by Type (Standard grades, High carbon silico manganese, Medium carbon silico manganese, Low carbon silico manganese) Application (Carbon steel, Flat steel, Stainless and alloy steel, Cast iron, Others) Distribution channel (Direct sale, Indirect sale)

Eramet SA, Erdos Group, Eurasian Resources Group Srl, Feroton, Ferro Alloy Resources Ltd., Ferroglobe Plc, GFG Alliance, Hira Ferro Alloys Ltd., Indsil Hydro Power and Manganese, Jindal Steel Ltd., Maithan Alloys Ltd., Mechel PAO, Nava Ltd., OM Holdings Ltd., Sarda Energy and Minerals Ltd, Shyam Ferro Alloys Ltd., Shyam Metalics and Energy Ltd, South32 Ltd., Tata Steel Ltd., Vale SA are a few of the key vendors in the Silico Manganese market.

APAC will register the highest growth rate of 65.1% among the other regions. Therefore, the Silico Manganese market in APAC is expected to garner significant business opportunities for the vendors during the forecast period.

China, India, Japan, South Korea, Taiwan, Vietnam, Russia, Germany, France, Italy, Norway, Spain, US, Canada, Mexico, Brazil, Argentina, Chile, Iran, Saudi Arabia, UAE, Qatar, Oman

  • Accelerated infrastructure modernization demands advanced steel alloys is the driving factor this market.

The Silico Manganese market vendors should focus on grabbing business opportunities from the Type segment as it accounted for the largest market share in the base year.
RIA - Research AI Assistant
Ask RIA
