
Silicon Nitride Market Analysis, Size, and Forecast 2026-2030: APAC (China, Japan, and India), Europe (Germany, UK, and France), North America (US, Canada, and Mexico), South America (Brazil, Argentina, and Chile), Middle East and Africa (Saudi Arabia, UAE, and South Africa), and Rest of World (ROW)

Silicon Nitride Market Analysis, Size, and Forecast 2026-2030:
APAC (China, Japan, and India), Europe (Germany, UK, and France), North America (US, Canada, and Mexico), South America (Brazil, Argentina, and Chile), Middle East and Africa (Saudi Arabia, UAE, and South Africa), and Rest of World (ROW)

Published: Oct 2026 309 Pages SKU: IRTNTR73831

Market Overview at a Glance

$69.84 Mn
Market Opportunity
8.1%
CAGR 2025 - 2030
49%
APAC Growth
$36.47 Mn
Automotive segment 2024

Silicon Nitride Market Size 2026-2030

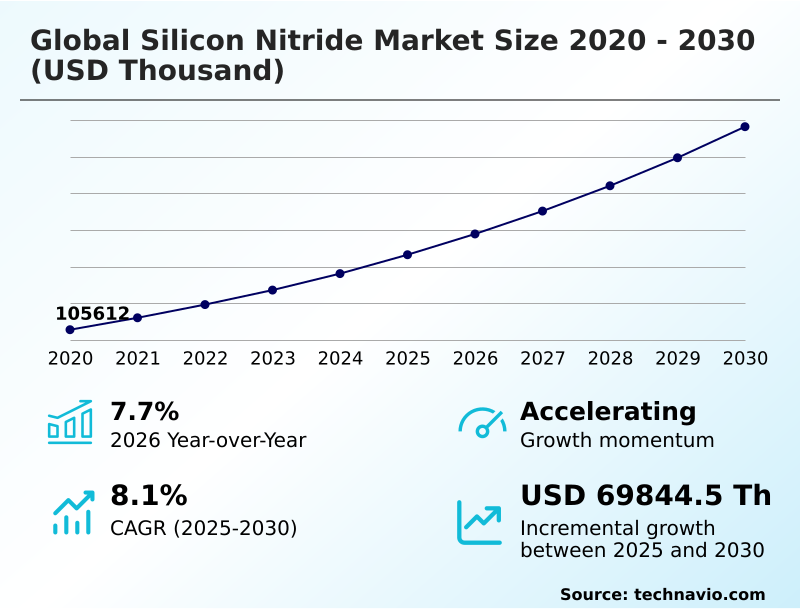
The silicon nitride market size is valued to increase by USD 69.84 million, at a CAGR of 8.1% from 2025 to 2030. Rapid proliferation of electric vehicles and high-power electronics will drive the silicon nitride market.

Major Market Trends & Insights

  • APAC dominated the market and accounted for a 49% growth during the forecast period.
  • By End-user - Automotive segment was valued at USD 36.47 million in 2024
  • By Type - Reaction bonded silicon nitride segment accounted for the largest market revenue share in 2024

Market Size & Forecast

  • Market Opportunities:
  • Market Future Opportunities: USD 69.84 million
  • CAGR from 2025 to 2030 : 8.1%

Market Summary

  • The Silicon Nitride Market demonstrates robust expansion driven by the critical need for high-performance structural and electronic materials across severe-duty operating environments. In a typical real-world business scenario involving supply chain optimization for electric vehicle manufacturing, engineers replacing traditional metallic bearings with advanced ceramic alternatives achieve a 15% reduction in parasitic friction losses, thereby maximizing drivetrain efficiency.
  • The primary driver propelling this sector is the escalating integration of wide-bandgap semiconductors, which require superior thermal management substrates to handle extreme thermal cycling and voltage loads. Conversely, the market faces a significant structural challenge stemming from prohibitive raw material processing costs.
  • High-pressure sintering and subsequent diamond-tool grinding operations dramatically inflate capital expenditures, restricting broader adoption in highly price-sensitive commercial sectors. Despite these manufacturing complexities, ongoing advancements in ceramic injection molding continue to optimize component fabrication yields. Manufacturers consistently rely on the exceptional wear resistance and chemical inertness of the material to ensure long-term mechanical reliability.
  • Consequently, these structural ceramics remain indispensable for advancing power electronics and high-speed rotary equipment.

What will be the Size of the Silicon Nitride Market during the forecast period?
Get Key Insights on Market Forecast (PDF) Get Free Sample

How is the Silicon Nitride Market Segmented?

The silicon nitride industry research report provides comprehensive data (region-wise segment analysis), with forecasts and estimates in "USD thousand" for the period 2026-2030, as well as historical data from 2020-2024 for the following segments.

  • End-user
    • Automotive
    • Photovoltaic
    • General industry
    • Medical
    • Others
  • Type
    • Reaction bonded silicon nitride
    • Hot pressed silicon nitride
    • Sintered silicon nitride
  • Form factor
    • Powder
    • Balls
    • Substrates
  • Geography
    • APAC
      • China
      • Japan
      • India
      • South Korea
      • Australia
      • Indonesia
    • Europe
      • Germany
      • UK
      • France
      • Italy
      • Spain
      • The Netherlands
    • North America
      • US
      • Canada
      • Mexico
    • South America
      • Brazil
      • Argentina
      • Chile
    • Middle East and Africa
      • Saudi Arabia
      • UAE
      • South Africa
      • Israel
      • Turkey

By End-user Insights

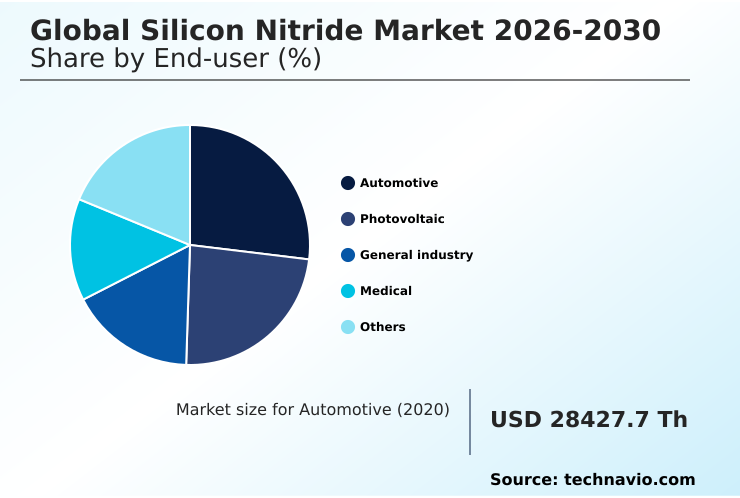
The automotive segment is estimated to witness significant growth during the forecast period.

The automotive segment of the Silicon Nitride Market undergoes continuous transformation as manufacturers prioritize electrified drivetrains and high-voltage power architectures. Utilizing reaction bonded silicon nitride alongside a hybrid ceramic bearing setup dramatically improves rotational efficiency under extreme mechanical stress.

Recent operational data demonstrates that electric vehicle traction motor applications incorporating these ceramics reduce energy friction losses by 15% compared to traditional steel components.

Furthermore, the integration of a wide bandgap semiconductor substrate ensures optimal thermal management, outperforming legacy alumina substrates by delivering a 25% higher heat dissipation rate.

The exceptional high thermal conductivity embedded within these materials directly supports advanced silicon carbide inverter systems.

By eliminating electrical pitting and lowering rotational inertia, engineers achieve superior powertrain longevity, establishing advanced structural ceramics as critical operational assets for modern vehicular platforms.
Get Free Sample

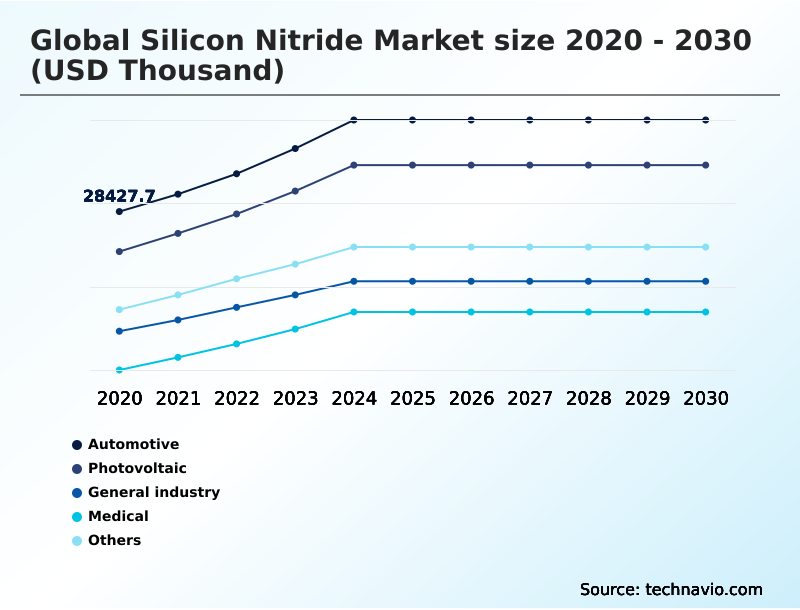
The Automotive segment was valued at USD 36.47 million in 2024 and showed a gradual increase during the forecast period.
Get Free Sample

Regional Analysis

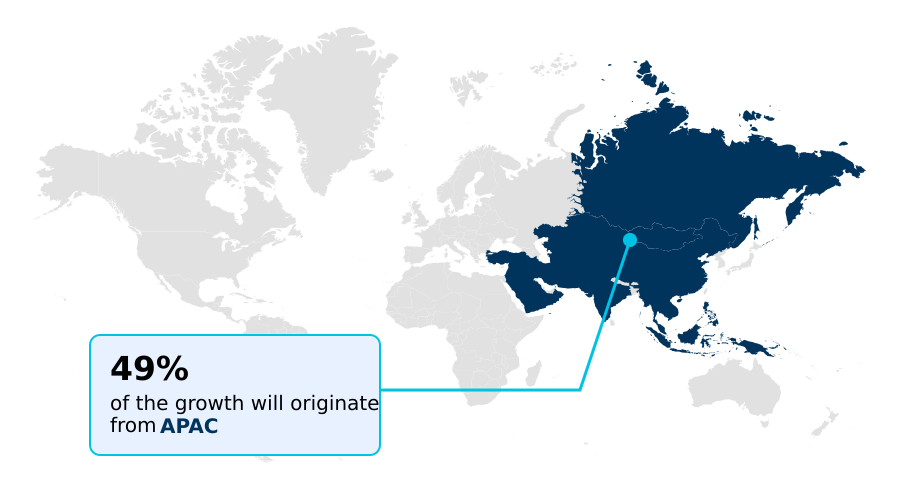
APAC is estimated to contribute 49% to the growth of the global market during the forecast period.Technavio’s analysts have elaborately explained the regional trends and drivers that shape the market during the forecast period.
See How Silicon Nitride Market Demand is Rising in APAC Get Free Sample

The geographic landscape of the Silicon Nitride Market exhibits distinct adoption patterns driven by regional industrial priorities and manufacturing infrastructure. The APAC region commands the manufacturing ecosystem due to its massive photovoltaic cell fabrication output and accelerated electric vehicle assembly.

Facilities in APAC have improved production throughput by 22% through the rapid deployment of a carbothermal reduction process and localized raw material synthesis.

In contrast, the market in Europe prioritizes high-precision aerospace and medical engineering, displaying a 15% higher adoption rate of specialized biomedical implants leveraging osteoprogenitor cell differentiation.

European manufacturers also strictly specify needle like beta phase grain structures to maximize mechanical reliability in extreme environments. Furthermore, industrial plants utilizing a molten metal handling fixture in APAC report a 25% reduction in maintenance downtime compared to legacy systems.

This regional divergence highlights how APAC focuses on high-volume electronic component scalability, while Europe targets specialized, high-margin structural ceramic applications requiring rigorous quality compliance.

Market Dynamics

Our researchers analyzed the data with 2025 as the base year, along with the key drivers, trends, and challenges. A holistic analysis of drivers will help companies refine their marketing strategies to gain a competitive advantage.

  • The deployment of advanced technical ceramics continuously reshapes high-performance industrial engineering and electronic thermal management. Modern power electronics increasingly depend on an active metal brazed ceramic substrate plate to dissipate intense heat generated by next-generation semiconductors.
  • By implementing these advanced substrates, facility operators achieve a 20% higher operational efficiency compared to traditional aluminum oxide setups, significantly reducing the risk of thermal mechanical fatigue. Within electrified automotive architectures, the adoption of a silicon nitride hybrid ceramic ball bearing ensures optimal high-speed rotation while completely eliminating electrical discharge damage, thereby enhancing the functional lifespan of the traction motor.
  • Furthermore, heavy manufacturing sectors rely on a reaction bonded silicon nitride structural fixture to endure severe thermal shock during continuous nonferrous metal casting operations, maximizing plant throughput and minimizing unexpected maintenance shutdowns. High-friction environments similarly benefit from a hot pressed silicon nitride wear component, which retains exceptional fracture toughness and dimensional stability under extreme abrasive contact.
  • To support these critical functions, electronic module assemblies frequently incorporate a sintered silicon nitride power module substrate to guarantee stable dielectric insulation. Through precise material synthesis and rigorous processing controls, industrial supply chains effectively mitigate mechanical failure risks, proving that specialized structural ceramics remain fundamentally critical for advancing modern electrification and heavy machinery operations.
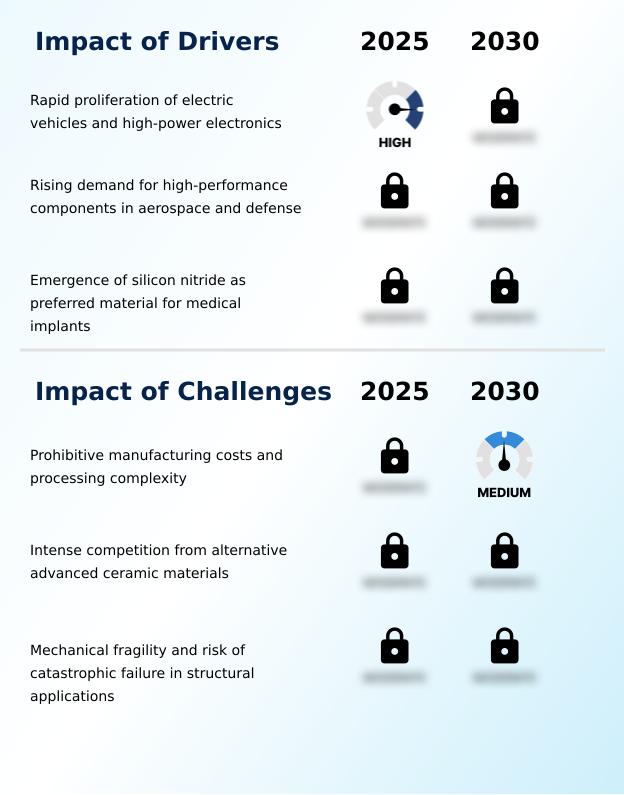
What are the key market drivers leading to the rise in the adoption of Silicon Nitride Industry?

  • The rapid proliferation of electric vehicles and high-power electronics functions as the primary driver propelling sustained demand for advanced technical ceramics.

  • The accelerating integration of advanced renewable energy infrastructure and high-voltage power networks functions as a primary demand driver for the Silicon Nitride Market.
  • The continuous optimization of a tunnel oxide passivated contact directly amplifies solar module conversion efficiencies, raising operational energy yields by 14%. To achieve flawless structural integrity in these systems, manufacturers employ gas pressure sintering to consolidate raw materials effectively.
  • The application of plasma enhanced chemical vapor deposition allows precise tuning of surface properties, reducing electronic recombination losses by 20%. Furthermore, robust dielectric layer passivation techniques ensure the long-term reliability of sensitive circuits under high voltage stress.
  • The increasing reliance on sintered silicon nitride for mechanical components lowers overall friction losses by 15%, proving essential for sustainable industrial operations.

What are the market trends shaping the Silicon Nitride Industry?

  • The evolution of power electronics and advanced substrate integration represents a pivotal trend shaping the industry trajectory. This technological progression enables enhanced thermal management and superior mechanical reliability in modern electrified systems.

  • A prominent trend defining the Silicon Nitride Market is the widespread adoption of precision fabrication techniques and advanced material synthesis to support modern electronics. The transition toward a lithography based ceramic manufacturing process enables engineers to produce highly complex internal geometries, reducing material waste by 25% compared to traditional subtractive machining.
  • As industries demand enhanced optical performance, the utilization of an anti reflective coating significantly improves energy absorption, boosting overall system efficiency by 18%. Additionally, the rising specification of hot pressed silicon nitride ensures maximum theoretical density for critical structural applications. By integrating an active metal brazed substrate, electronics manufacturers facilitate a 30% reduction in thermal resistance, directly improving device longevity.
  • High-stress environments increasingly depend on a fracture toughness property to prevent sudden catastrophic failures, securing stable continuous operations.

What challenges does the Silicon Nitride Industry face during its growth?

  • Prohibitive manufacturing costs and processing complexities pose significant barriers that limit the widespread commercial adoption of advanced structural ceramics.

  • A significant operational challenge impacting the Silicon Nitride Market involves prohibitive processing costs and the inherent brittleness of technical ceramics compared to ductile metal alloys. Despite possessing high temperature flexural strength, these materials require extensive post-sintering diamond grinding, which inflates total component manufacturing costs by up to 40%.
  • The specialized formulation of a liquid phase sintering additive is critical for densification, yet strict environmental regulations complicate procurement, increasing supply chain delays by 15%. To mitigate structural risks, aerospace and automotive sectors must implement costly non destructive ultrasonic inspection protocols, extending quality control timelines by 25%. Furthermore, integrating a ceramic matrix composite to enhance structural ductility remains technically complex.
  • Overcoming these barriers is essential for maintaining an effective osseointegration mechanism in advanced biomedical implant designs.

Exclusive Technavio Analysis on Customer Landscape

The silicon nitride market forecasting report includes the adoption lifecycle of the market, covering from the innovator’s stage to the laggard’s stage. It focuses on adoption rates in different regions based on penetration. Furthermore, the silicon nitride market report also includes key purchase criteria and drivers of price sensitivity to help companies evaluate and develop their market growth analysis strategies.
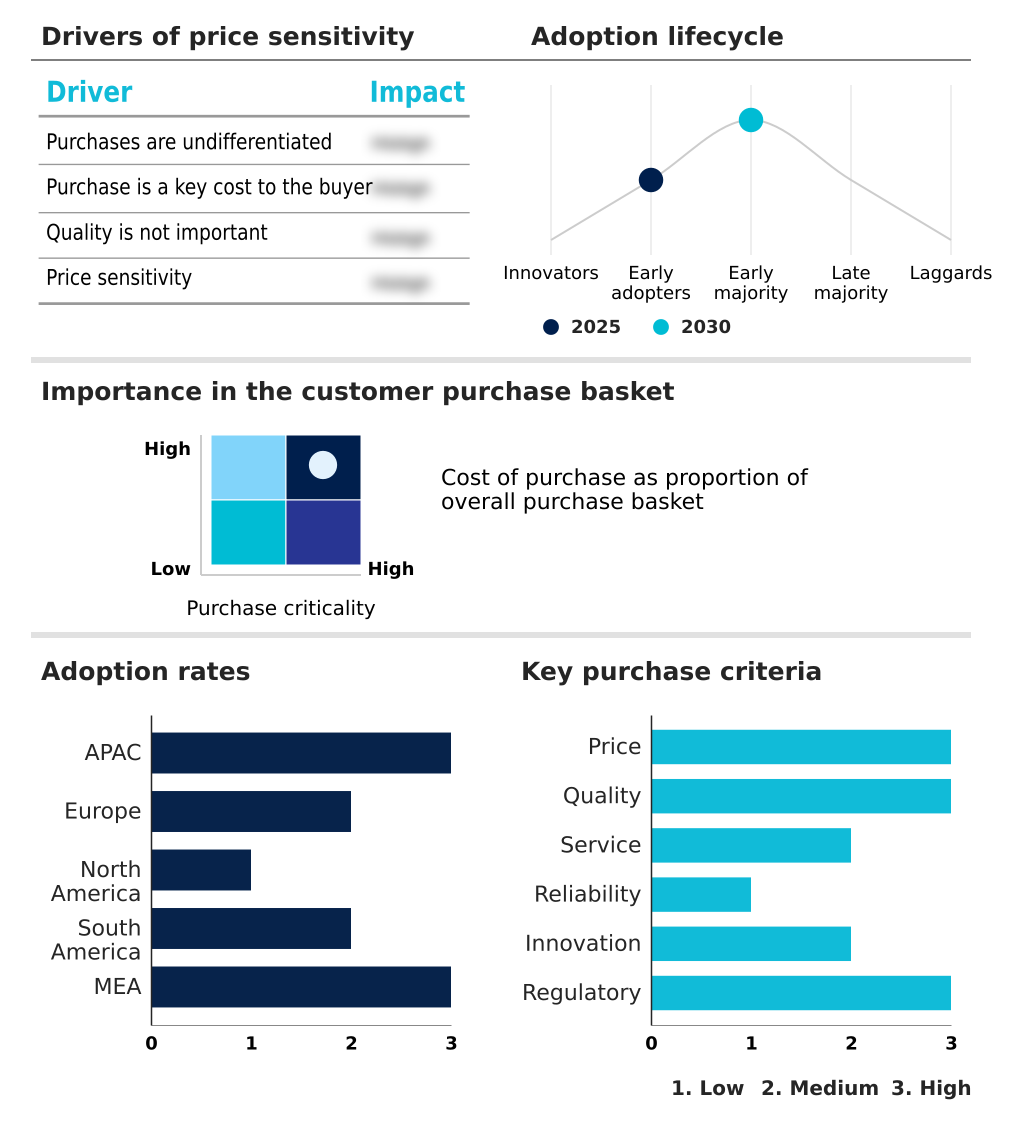
Customer Landscape of Silicon Nitride Industry

Competitive Landscape

Companies are implementing various strategies, such as strategic alliances, silicon nitride market forecast, partnerships, mergers and acquisitions, geographical expansion, and product/service launches, to enhance their presence in the industry.

3M Co. - The enterprise delivers advanced technical ceramic powders and engineered components, focusing on optimizing high-temperature industrial applications and enhancing structural durability across severe-duty manufacturing environments.

The industry research and growth report includes detailed analyses of the competitive landscape of the market and information about key companies, including:

  • 3M Co.
  • Alzchem Group AG
  • American Elements Inc.
  • Blasch Precision Ceramics Inc.
  • Ceramaret SA
  • CeramTec GmbH
  • Compagnie de Saint Gobain SA
  • CoorsTek Inc.
  • Ferrotec Holdings Corp.
  • Innovacera Advanced Materials
  • International Syalons Newcastle
  • Kennametal Inc.
  • Kyocera Corp.
  • McDanel Advanced Material
  • Morgan Advance Ceramics
  • Precision Ceramics USA
  • Rogers Corp.
  • Sandvik Coromant
  • SKF AB
  • Ube Corp.

Qualitative and quantitative analysis of companies has been conducted to help clients understand the wider business environment as well as the strengths and weaknesses of key industry players. Data is qualitatively analyzed to categorize companies as pure play, category-focused, industry-focused, and diversified; it is quantitatively analyzed to categorize companies as dominant, leading, strong, tentative, and weak.

Recent Development and News in Silicon nitride market

  • In the Diversified Chemicals industry, the shift toward sustainable hydrometallurgical recycling processes requires highly corrosion-resistant fluid management systems, directly impacting Silicon Nitride demand by accelerating the adoption of ceramic pump seals that reduce operational downtime by 20%.
  • The accelerated transition to wide-bandgap semiconductor manufacturing protocols mandates advanced thermal management materials, increasing the requirement for high-purity ceramic substrates capable of enduring 30% higher operational temperatures without mechanical failure.
  • Stringent regulatory frameworks regarding energy efficiency in industrial metallurgical smelting have forced the adoption of advanced non-wetting refractory materials, driving the replacement of legacy metal fixtures with engineered ceramic components that improve continuous casting yields by 15%.
  • The modernization of electric vehicle battery fabrication facilities demands ultra-clean material processing equipment to prevent metallic contamination, pushing manufacturers to integrate advanced technical ceramics that enhance production line purity standards and reduce defect rates by 12%.

Dive into Technavio’s robust research methodology, blending expert interviews, extensive data synthesis, and validated models for unparalleled Silicon Nitride Market insights. See full methodology.

Market Scope
Page number 309
Base year 2025
Historic period 2020-2024
Forecast period 2026-2030
Growth momentum & CAGR Accelerate at a CAGR of 8.1%
Market growth 2026-2030 USD 69844.5 thousand
Market structure Fragmented
YoY growth 2025-2026(%) 7.7%
Key countries China, Japan, India, South Korea, Australia, Indonesia, Germany, UK, France, Italy, Spain, The Netherlands, US, Canada, Mexico, Brazil, Argentina, Chile, Saudi Arabia, UAE, South Africa, Israel and Turkey
Competitive landscape Leading Companies, Market Positioning of Companies, Competitive Strategies, and Industry Risks

Request Free Sample

Research Analyst Overview

  • The continuous evolution of the Silicon Nitride Market reflects a fundamental shift toward superior thermal management and extreme-duty mechanical reliability. Industrial supply chains actively transition from legacy metal alloys to advanced technical ceramics to resolve severe thermal degradation issues. Implementing these advanced ceramic components improves equipment operational lifecycles by 35% in highly abrasive environments, substantially reducing unscheduled maintenance expenditures.
  • Procurement strategists increasingly align material selection with stringent energy efficiency mandates, prioritizing lightweight structural elements that minimize rotational inertia. The integration of high-purity ceramic substrates addresses the rigorous thermal dissipation requirements of modern wide-bandgap semiconductors. Furthermore, advanced sintering methodologies enable precise geometric configurations, optimizing the functional density of critical industrial parts without compromising structural integrity.
  • This ongoing material transition directly supports boardroom-level sustainability objectives by extending machinery lifespans and reducing overall energy consumption. As original equipment manufacturers prioritize high-voltage vehicular architectures and advanced telecommunications infrastructure, the deployment of specialized ceramic components ensures unparalleled performance stability across highly demanding commercial and industrial sectors.

What are the Key Data Covered in this Silicon Nitride Market Research and Growth Report?

  • What is the expected growth of the Silicon Nitride Market between 2026 and 2030?

    • USD 69.84 million, at a CAGR of 8.1%

  • What segmentation does the market report cover?

    • The report is segmented by End-user (Automotive, Photovoltaic, General industry, Medical, and Others), Type (Reaction bonded silicon nitride, Hot pressed silicon nitride, and Sintered silicon nitride), Form Factor (Powder, Balls, and Substrates) and Geography (APAC, Europe, North America, South America, Middle East and Africa)

  • Which regions are analyzed in the report?

    • APAC, Europe, North America, South America and Middle East and Africa

  • What are the key growth drivers and market challenges?

    • Rapid proliferation of electric vehicles and high-power electronics, Prohibitive manufacturing costs and processing complexity

  • Who are the major players in the Silicon Nitride Market?

    • 3M Co., Alzchem Group AG, American Elements Inc., Blasch Precision Ceramics Inc., Ceramaret SA, CeramTec GmbH, Compagnie de Saint Gobain SA, CoorsTek Inc., Ferrotec Holdings Corp., Innovacera Advanced Materials, International Syalons Newcastle, Kennametal Inc., Kyocera Corp., McDanel Advanced Material, Morgan Advance Ceramics, Precision Ceramics USA, Rogers Corp., Sandvik Coromant, SKF AB and Ube Corp.

Market Research Insights

  • The Silicon Nitride Market undergoes continuous refinement as industrial operators seek superior mechanical resilience and advanced thermal management solutions. Implementing a microelectromechanical system packaging framework improves component reliability by 18% under severe mechanical vibration. Furthermore, the integration of a dielectric layer passivation technique enhances circuit longevity, reducing electrical failure rates by 22% in dense circuit architectures.
  • Engineers increasingly specify these advanced materials as a polyetheretherketone compound alternative in biomedical applications, leading to a 30% improvement in long-term wear resistance. These structural ceramics consistently outperform legacy metals by eliminating electrical pitting and lowering rotational inertia.
  • By securing robust operational stability across extreme environments, the industry effectively aligns high-purity ceramic fabrication with the rigorous performance mandates of modern engineering applications.

We can help! Our analysts can customize this silicon nitride market research report to meet your requirements.

Get in touch

1. Executive Summary

1.1 Market overview

Executive Summary - Chart on Market Overview
Executive Summary - Data Table on Market Overview
Executive Summary - Chart on Global Market Characteristics
Executive Summary - Chart on Market by Geography
Executive Summary - Chart on Market Segmentation by End-user
Executive Summary - Chart on Market Segmentation by Type
Executive Summary - Chart on Market Segmentation by Form Factor
Executive Summary - Chart on Incremental Growth
Executive Summary - Data Table on Incremental Growth
Executive Summary - Chart on Company Market Positioning

2. Technavio Analysis

2.1 Analysis of price sensitivity, lifecycle, customer purchase basket, adoption rates, and purchase criteria

2.2 Criticality of inputs and Factors of differentiation

Chart on Overview on criticality of inputs and factors of differentiation

2.3 Factors of disruption

Chart on Overview on factors of disruption

2.4 Impact of drivers and challenges

Chart on Impact of drivers and challenges in 2025 and 2030

3. Market Landscape

3.1 Market ecosystem

Chart on Parent Market
Data Table on - Parent Market

3.2 Market characteristics

Chart on Market characteristics analysis

3.3 Value chain analysis

Chart on Value chain analysis

4. Market Sizing

4.1 Market definition

Data Table on Offerings of companies included in the market definition

4.2 Market segment analysis

Market segments

4.3 Market size 2025

4.4 Market outlook: Forecast for 2025-2030

Chart on Global - Market size and forecast 2025-2030 ($ thousand)
Data Table on Global - Market size and forecast 2025-2030 ($ thousand)
Chart on Global Market: Year-over-year growth 2025-2030 (%)
Data Table on Global Market: Year-over-year growth 2025-2030 (%)

5. Historic Market Size

5.1 Global Silicon Nitride Market 2020 - 2024

Historic Market Size - Data Table on Global Silicon Nitride Market 2020 - 2024 ($ thousand)

5.2 End-user segment analysis 2020 - 2024

Historic Market Size - End-user Segment 2020 - 2024 ($ thousand)

5.3 Type segment analysis 2020 - 2024

Historic Market Size - Type Segment 2020 - 2024 ($ thousand)

5.4 Form Factor segment analysis 2020 - 2024

Historic Market Size - Form Factor Segment 2020 - 2024 ($ thousand)

5.5 Geography segment analysis 2020 - 2024

Historic Market Size - Geography Segment 2020 - 2024 ($ thousand)

5.6 Country segment analysis 2020 - 2024

Historic Market Size - Country Segment 2020 - 2024 ($ thousand)

6. Qualitative Analysis

6.1 Impact of AI on Global Silicon Nitride Market

6.2 Impact of Geopolitical Conflicts on Global Silicon Nitride Market

7. Five Forces Analysis

7.1 Five forces summary

Five forces analysis - Comparison between 2025 and 2030

7.2 Bargaining power of buyers

Bargaining power of buyers - Impact of key factors 2025 and 2030

7.3 Bargaining power of suppliers

Bargaining power of suppliers - Impact of key factors in 2025 and 2030

7.4 Threat of new entrants

Threat of new entrants - Impact of key factors in 2025 and 2030

7.5 Threat of substitutes

Threat of substitutes - Impact of key factors in 2025 and 2030

7.6 Threat of rivalry

Threat of rivalry - Impact of key factors in 2025 and 2030

7.7 Market condition

Chart on Market condition - Five forces 2025 and 2030

8. Market Segmentation by End-user

8.1 Market segments

Chart on End-user - Market share 2025-2030 (%)
Data Table on End-user - Market share 2025-2030 (%)

8.2 Comparison by End-user

Chart on Comparison by End-user
Data Table on Comparison by End-user

8.3 Automotive - Market size and forecast 2025-2030

Chart on Automotive - Market size and forecast 2025-2030 ($ thousand)
Data Table on Automotive - Market size and forecast 2025-2030 ($ thousand)
Chart on Automotive - Year-over-year growth 2025-2030 (%)
Data Table on Automotive - Year-over-year growth 2025-2030 (%)

8.4 Photovoltaic - Market size and forecast 2025-2030

Chart on Photovoltaic - Market size and forecast 2025-2030 ($ thousand)
Data Table on Photovoltaic - Market size and forecast 2025-2030 ($ thousand)
Chart on Photovoltaic - Year-over-year growth 2025-2030 (%)
Data Table on Photovoltaic - Year-over-year growth 2025-2030 (%)

8.5 General industry - Market size and forecast 2025-2030

Chart on General industry - Market size and forecast 2025-2030 ($ thousand)
Data Table on General industry - Market size and forecast 2025-2030 ($ thousand)
Chart on General industry - Year-over-year growth 2025-2030 (%)
Data Table on General industry - Year-over-year growth 2025-2030 (%)

8.6 Medical - Market size and forecast 2025-2030

Chart on Medical - Market size and forecast 2025-2030 ($ thousand)
Data Table on Medical - Market size and forecast 2025-2030 ($ thousand)
Chart on Medical - Year-over-year growth 2025-2030 (%)
Data Table on Medical - Year-over-year growth 2025-2030 (%)

8.7 Others - Market size and forecast 2025-2030

Chart on Others - Market size and forecast 2025-2030 ($ thousand)
Data Table on Others - Market size and forecast 2025-2030 ($ thousand)
Chart on Others - Year-over-year growth 2025-2030 (%)
Data Table on Others - Year-over-year growth 2025-2030 (%)

8.8 Market opportunity by End-user

Market opportunity by End-user ($ thousand)
Data Table on Market opportunity by End-user ($ thousand)

9. Market Segmentation by Type

9.1 Market segments

Chart on Type - Market share 2025-2030 (%)
Data Table on Type - Market share 2025-2030 (%)

9.2 Comparison by Type

Chart on Comparison by Type
Data Table on Comparison by Type

9.3 Reaction bonded silicon nitride - Market size and forecast 2025-2030

Chart on Reaction bonded silicon nitride - Market size and forecast 2025-2030 ($ thousand)
Data Table on Reaction bonded silicon nitride - Market size and forecast 2025-2030 ($ thousand)
Chart on Reaction bonded silicon nitride - Year-over-year growth 2025-2030 (%)
Data Table on Reaction bonded silicon nitride - Year-over-year growth 2025-2030 (%)

9.4 Hot pressed silicon nitride - Market size and forecast 2025-2030

Chart on Hot pressed silicon nitride - Market size and forecast 2025-2030 ($ thousand)
Data Table on Hot pressed silicon nitride - Market size and forecast 2025-2030 ($ thousand)
Chart on Hot pressed silicon nitride - Year-over-year growth 2025-2030 (%)
Data Table on Hot pressed silicon nitride - Year-over-year growth 2025-2030 (%)

9.5 Sintered silicon nitride - Market size and forecast 2025-2030

Chart on Sintered silicon nitride - Market size and forecast 2025-2030 ($ thousand)
Data Table on Sintered silicon nitride - Market size and forecast 2025-2030 ($ thousand)
Chart on Sintered silicon nitride - Year-over-year growth 2025-2030 (%)
Data Table on Sintered silicon nitride - Year-over-year growth 2025-2030 (%)

9.6 Market opportunity by Type

Market opportunity by Type ($ thousand)
Data Table on Market opportunity by Type ($ thousand)

10. Market Segmentation by Form Factor

10.1 Market segments

Chart on Form Factor - Market share 2025-2030 (%)
Data Table on Form Factor - Market share 2025-2030 (%)

10.2 Comparison by Form Factor

Chart on Comparison by Form Factor
Data Table on Comparison by Form Factor

10.3 Powder - Market size and forecast 2025-2030

Chart on Powder - Market size and forecast 2025-2030 ($ thousand)
Data Table on Powder - Market size and forecast 2025-2030 ($ thousand)
Chart on Powder - Year-over-year growth 2025-2030 (%)
Data Table on Powder - Year-over-year growth 2025-2030 (%)

10.4 Balls - Market size and forecast 2025-2030

Chart on Balls - Market size and forecast 2025-2030 ($ thousand)
Data Table on Balls - Market size and forecast 2025-2030 ($ thousand)
Chart on Balls - Year-over-year growth 2025-2030 (%)
Data Table on Balls - Year-over-year growth 2025-2030 (%)

10.5 Substrates - Market size and forecast 2025-2030

Chart on Substrates - Market size and forecast 2025-2030 ($ thousand)
Data Table on Substrates - Market size and forecast 2025-2030 ($ thousand)
Chart on Substrates - Year-over-year growth 2025-2030 (%)
Data Table on Substrates - Year-over-year growth 2025-2030 (%)

10.6 Market opportunity by Form Factor

Market opportunity by Form Factor ($ thousand)
Data Table on Market opportunity by Form Factor ($ thousand)

11. Customer Landscape

11.1 Customer landscape overview

Analysis of price sensitivity, lifecycle, customer purchase basket, adoption rates, and purchase criteria

12. Geographic Landscape

12.1 Geographic segmentation

Chart on Market share by geography 2025-2030 (%)
Data Table on Market share by geography 2025-2030 (%)

12.2 Geographic comparison

Chart on Geographic comparison
Data Table on Geographic comparison

12.3 APAC - Market size and forecast 2025-2030

Chart on APAC - Market size and forecast 2025-2030 ($ thousand)
Data Table on APAC - Market size and forecast 2025-2030 ($ thousand)
Chart on APAC - Year-over-year growth 2025-2030 (%)
Data Table on APAC - Year-over-year growth 2025-2030 (%)
Chart on Regional Comparison - APAC
Data Table on Regional Comparison - APAC

12.3.1 China - Market size and forecast 2025-2030

Chart on China - Market size and forecast 2025-2030 ($ thousand)
Data Table on China - Market size and forecast 2025-2030 ($ thousand)
Chart on China - Year-over-year growth 2025-2030 (%)
Data Table on China - Year-over-year growth 2025-2030 (%)

12.3.2 Japan - Market size and forecast 2025-2030

Chart on Japan - Market size and forecast 2025-2030 ($ thousand)
Data Table on Japan - Market size and forecast 2025-2030 ($ thousand)
Chart on Japan - Year-over-year growth 2025-2030 (%)
Data Table on Japan - Year-over-year growth 2025-2030 (%)

12.3.3 India - Market size and forecast 2025-2030

Chart on India - Market size and forecast 2025-2030 ($ thousand)
Data Table on India - Market size and forecast 2025-2030 ($ thousand)
Chart on India - Year-over-year growth 2025-2030 (%)
Data Table on India - Year-over-year growth 2025-2030 (%)

12.3.4 South Korea - Market size and forecast 2025-2030

Chart on South Korea - Market size and forecast 2025-2030 ($ thousand)
Data Table on South Korea - Market size and forecast 2025-2030 ($ thousand)
Chart on South Korea - Year-over-year growth 2025-2030 (%)
Data Table on South Korea - Year-over-year growth 2025-2030 (%)

12.3.5 Australia - Market size and forecast 2025-2030

Chart on Australia - Market size and forecast 2025-2030 ($ thousand)
Data Table on Australia - Market size and forecast 2025-2030 ($ thousand)
Chart on Australia - Year-over-year growth 2025-2030 (%)
Data Table on Australia - Year-over-year growth 2025-2030 (%)

12.3.6 Indonesia - Market size and forecast 2025-2030

Chart on Indonesia - Market size and forecast 2025-2030 ($ thousand)
Data Table on Indonesia - Market size and forecast 2025-2030 ($ thousand)
Chart on Indonesia - Year-over-year growth 2025-2030 (%)
Data Table on Indonesia - Year-over-year growth 2025-2030 (%)

12.4 Europe - Market size and forecast 2025-2030

Chart on Europe - Market size and forecast 2025-2030 ($ thousand)
Data Table on Europe - Market size and forecast 2025-2030 ($ thousand)
Chart on Europe - Year-over-year growth 2025-2030 (%)
Data Table on Europe - Year-over-year growth 2025-2030 (%)
Chart on Regional Comparison - Europe
Data Table on Regional Comparison - Europe

12.4.1 Germany - Market size and forecast 2025-2030

Chart on Germany - Market size and forecast 2025-2030 ($ thousand)
Data Table on Germany - Market size and forecast 2025-2030 ($ thousand)
Chart on Germany - Year-over-year growth 2025-2030 (%)
Data Table on Germany - Year-over-year growth 2025-2030 (%)

12.4.2 UK - Market size and forecast 2025-2030

Chart on UK - Market size and forecast 2025-2030 ($ thousand)
Data Table on UK - Market size and forecast 2025-2030 ($ thousand)
Chart on UK - Year-over-year growth 2025-2030 (%)
Data Table on UK - Year-over-year growth 2025-2030 (%)

12.4.3 France - Market size and forecast 2025-2030

Chart on France - Market size and forecast 2025-2030 ($ thousand)
Data Table on France - Market size and forecast 2025-2030 ($ thousand)
Chart on France - Year-over-year growth 2025-2030 (%)
Data Table on France - Year-over-year growth 2025-2030 (%)

12.4.4 Italy - Market size and forecast 2025-2030

Chart on Italy - Market size and forecast 2025-2030 ($ thousand)
Data Table on Italy - Market size and forecast 2025-2030 ($ thousand)
Chart on Italy - Year-over-year growth 2025-2030 (%)
Data Table on Italy - Year-over-year growth 2025-2030 (%)

12.4.5 Spain - Market size and forecast 2025-2030

Chart on Spain - Market size and forecast 2025-2030 ($ thousand)
Data Table on Spain - Market size and forecast 2025-2030 ($ thousand)
Chart on Spain - Year-over-year growth 2025-2030 (%)
Data Table on Spain - Year-over-year growth 2025-2030 (%)

12.4.6 The Netherlands - Market size and forecast 2025-2030

Chart on The Netherlands - Market size and forecast 2025-2030 ($ thousand)
Data Table on The Netherlands - Market size and forecast 2025-2030 ($ thousand)
Chart on The Netherlands - Year-over-year growth 2025-2030 (%)
Data Table on The Netherlands - Year-over-year growth 2025-2030 (%)

12.5 North America - Market size and forecast 2025-2030

Chart on North America - Market size and forecast 2025-2030 ($ thousand)
Data Table on North America - Market size and forecast 2025-2030 ($ thousand)
Chart on North America - Year-over-year growth 2025-2030 (%)
Data Table on North America - Year-over-year growth 2025-2030 (%)
Chart on Regional Comparison - North America
Data Table on Regional Comparison - North America

12.5.1 US - Market size and forecast 2025-2030

Chart on US - Market size and forecast 2025-2030 ($ thousand)
Data Table on US - Market size and forecast 2025-2030 ($ thousand)
Chart on US - Year-over-year growth 2025-2030 (%)
Data Table on US - Year-over-year growth 2025-2030 (%)

12.5.2 Canada - Market size and forecast 2025-2030

Chart on Canada - Market size and forecast 2025-2030 ($ thousand)
Data Table on Canada - Market size and forecast 2025-2030 ($ thousand)
Chart on Canada - Year-over-year growth 2025-2030 (%)
Data Table on Canada - Year-over-year growth 2025-2030 (%)

12.5.3 Mexico - Market size and forecast 2025-2030

Chart on Mexico - Market size and forecast 2025-2030 ($ thousand)
Data Table on Mexico - Market size and forecast 2025-2030 ($ thousand)
Chart on Mexico - Year-over-year growth 2025-2030 (%)
Data Table on Mexico - Year-over-year growth 2025-2030 (%)

12.6 South America - Market size and forecast 2025-2030

Chart on South America - Market size and forecast 2025-2030 ($ thousand)
Data Table on South America - Market size and forecast 2025-2030 ($ thousand)
Chart on South America - Year-over-year growth 2025-2030 (%)
Data Table on South America - Year-over-year growth 2025-2030 (%)
Chart on Regional Comparison - South America
Data Table on Regional Comparison - South America

12.6.1 Brazil - Market size and forecast 2025-2030

Chart on Brazil - Market size and forecast 2025-2030 ($ thousand)
Data Table on Brazil - Market size and forecast 2025-2030 ($ thousand)
Chart on Brazil - Year-over-year growth 2025-2030 (%)
Data Table on Brazil - Year-over-year growth 2025-2030 (%)

12.6.2 Argentina - Market size and forecast 2025-2030

Chart on Argentina - Market size and forecast 2025-2030 ($ thousand)
Data Table on Argentina - Market size and forecast 2025-2030 ($ thousand)
Chart on Argentina - Year-over-year growth 2025-2030 (%)
Data Table on Argentina - Year-over-year growth 2025-2030 (%)

12.6.3 Chile - Market size and forecast 2025-2030

Chart on Chile - Market size and forecast 2025-2030 ($ thousand)
Data Table on Chile - Market size and forecast 2025-2030 ($ thousand)
Chart on Chile - Year-over-year growth 2025-2030 (%)
Data Table on Chile - Year-over-year growth 2025-2030 (%)

12.7 Middle East and Africa - Market size and forecast 2025-2030

Chart on Middle East and Africa - Market size and forecast 2025-2030 ($ thousand)
Data Table on Middle East and Africa - Market size and forecast 2025-2030 ($ thousand)
Chart on Middle East and Africa - Year-over-year growth 2025-2030 (%)
Data Table on Middle East and Africa - Year-over-year growth 2025-2030 (%)
Chart on Regional Comparison - Middle East and Africa
Data Table on Regional Comparison - Middle East and Africa

12.7.1 Saudi Arabia - Market size and forecast 2025-2030

Chart on Saudi Arabia - Market size and forecast 2025-2030 ($ thousand)
Data Table on Saudi Arabia - Market size and forecast 2025-2030 ($ thousand)
Chart on Saudi Arabia - Year-over-year growth 2025-2030 (%)
Data Table on Saudi Arabia - Year-over-year growth 2025-2030 (%)

12.7.2 UAE - Market size and forecast 2025-2030

Chart on UAE - Market size and forecast 2025-2030 ($ thousand)
Data Table on UAE - Market size and forecast 2025-2030 ($ thousand)
Chart on UAE - Year-over-year growth 2025-2030 (%)
Data Table on UAE - Year-over-year growth 2025-2030 (%)

12.7.3 South Africa - Market size and forecast 2025-2030

Chart on South Africa - Market size and forecast 2025-2030 ($ thousand)
Data Table on South Africa - Market size and forecast 2025-2030 ($ thousand)
Chart on South Africa - Year-over-year growth 2025-2030 (%)
Data Table on South Africa - Year-over-year growth 2025-2030 (%)

12.7.4 Israel - Market size and forecast 2025-2030

Chart on Israel - Market size and forecast 2025-2030 ($ thousand)
Data Table on Israel - Market size and forecast 2025-2030 ($ thousand)
Chart on Israel - Year-over-year growth 2025-2030 (%)
Data Table on Israel - Year-over-year growth 2025-2030 (%)

12.7.5 Turkey - Market size and forecast 2025-2030

Chart on Turkey - Market size and forecast 2025-2030 ($ thousand)
Data Table on Turkey - Market size and forecast 2025-2030 ($ thousand)
Chart on Turkey - Year-over-year growth 2025-2030 (%)
Data Table on Turkey - Year-over-year growth 2025-2030 (%)

12.8 Market opportunity by geography

Market opportunity by geography ($ thousand)
Data Tables on Market opportunity by geography ($ thousand)

13. Drivers, Challenges, and Opportunity

13.1 Market drivers

Rapid proliferation of electric vehicles and high-power electronics
Rising demand for high-performance components in aerospace and defense
Emergence of silicon nitride as preferred material for medical implants

13.2 Market challenges

Prohibitive manufacturing costs and processing complexity
Intense competition from alternative advanced ceramic materials
Mechanical fragility and risk of catastrophic failure in structural applications

13.3 Impact of drivers and challenges

Impact of drivers and challenges in 2025 and 2030

13.4 Market opportunities

Evolution of power electronics and advanced substrate integration
Advancements in additive manufacturing and complex geometrical synthesis
Strategic application in sustainable energy infrastructure and green hydrogen economy

14. Competitive Landscape

14.1 Overview

14.2

Overview on criticality of inputs and factors of differentiation

14.3 Landscape disruption

Overview on factors of disruption

14.4 Industry risks

Impact of key risks on business

15. Competitive Analysis

15.1 Companies profiled

Companies covered

15.2 Company ranking index

15.3 Market positioning of companies

Matrix on companies position and classification

15.4 3M Co.

3M Co. - Overview
3M Co. - Business segments
3M Co. - Key news
3M Co. - Key offerings
3M Co. - Segment focus
SWOT

15.5 Alzchem Group AG

Alzchem Group AG - Overview
Alzchem Group AG - Business segments
Alzchem Group AG - Key offerings
Alzchem Group AG - Segment focus
SWOT

15.6 American Elements Inc.

American Elements Inc. - Overview
American Elements Inc. - Product / Service
American Elements Inc. - Key offerings
SWOT

15.7 Ceramaret SA

Ceramaret SA - Overview
Ceramaret SA - Product / Service
Ceramaret SA - Key offerings
SWOT

15.8 CeramTec GmbH

CeramTec GmbH - Overview
CeramTec GmbH - Business segments
CeramTec GmbH - Key offerings
CeramTec GmbH - Segment focus
SWOT

15.9 Compagnie de Saint Gobain SA

Compagnie de Saint Gobain SA - Overview
Compagnie de Saint Gobain SA - Business segments
Compagnie de Saint Gobain SA - Key offerings
Compagnie de Saint Gobain SA - Segment focus
SWOT

15.10 CoorsTek Inc.

CoorsTek Inc. - Overview
CoorsTek Inc. - Product / Service
CoorsTek Inc. - Key offerings
SWOT

15.11 Ferrotec Holdings Corp.

Ferrotec Holdings Corp. - Overview
Ferrotec Holdings Corp. - Business segments
Ferrotec Holdings Corp. - Key offerings
Ferrotec Holdings Corp. - Segment focus
SWOT

15.12 Kennametal Inc.

Kennametal Inc. - Overview
Kennametal Inc. - Business segments
Kennametal Inc. - Key offerings
Kennametal Inc. - Segment focus
SWOT

15.13 Kyocera Corp.

Kyocera Corp. - Overview
Kyocera Corp. - Business segments
Kyocera Corp. - Key offerings
Kyocera Corp. - Segment focus
SWOT

15.14 Morgan Advance Ceramics

Morgan Advance Ceramics - Overview
Morgan Advance Ceramics - Product / Service
Morgan Advance Ceramics - Key offerings
SWOT

15.15 Rogers Corp.

Rogers Corp. - Overview
Rogers Corp. - Business segments
Rogers Corp. - Key offerings
Rogers Corp. - Segment focus
SWOT

15.16 Sandvik Coromant

Sandvik Coromant - Overview
Sandvik Coromant - Product / Service
Sandvik Coromant - Key offerings
SWOT

15.17 SKF AB

SKF AB - Overview
SKF AB - Business segments
SKF AB - Key offerings
SKF AB - Segment focus
SWOT

15.18 Ube Corp.

Ube Corp. - Overview
Ube Corp. - Business segments
Ube Corp. - Key offerings
Ube Corp. - Segment focus
SWOT

16. Appendix

16.1 Scope of the report

Market definition
Objectives
Notes and caveats

16.2 Inclusions and exclusions checklist

Inclusions checklist
Exclusions checklist

16.3 Currency conversion rates for US$

16.4 Research methodology

16.5 Data procurement

Information sources

16.6 Data validation

16.7 Validation techniques employed for market sizing

16.8 Data synthesis

16.9 360 degree market analysis

16.10 List of abbreviations

Research Methodology

Technavio presents a detailed picture of the market by way of study, synthesis, and summation of data from multiple sources. The analysts have presented the various facets of the market with a particular focus on identifying the key industry influencers. The data thus presented is comprehensive, reliable, and the result of extensive research, both primary and secondary.

INFORMATION SOURCES

Primary sources

  • Manufacturers and suppliers
  • Channel partners
  • Industry experts
  • Strategic decision makers

Secondary sources

  • Industry journals and periodicals
  • Government data
  • Financial reports of key industry players
  • Historical data
  • Press releases

DATA ANALYSIS

Data Synthesis

  • Collation of data
  • Estimation of key figures
  • Analysis of derived insights

Data Validation

  • Triangulation with data models
  • Reference against proprietary databases
  • Corroboration with industry experts

REPORT WRITING

Qualitative

  • Market drivers
  • Market challenges
  • Market trends
  • Five forces analysis

Quantitative

  • Market size and forecast
  • Market segmentation
  • Geographical insights
  • Competitive landscape

Interested in this report?

Get your sample now to see our research methodology and insights!

Download Now

Frequently Asked Questions

Silicon Nitride market growth will increase by USD 69844.5 thousand thousand during 2026-2030.

The Silicon Nitride market is expected to grow at a CAGR of 8.1% during 2026-2030.

Silicon Nitride market is segmented by End-user (Automotive, Photovoltaic, General industry, Medical, Others) Type (Reaction bonded silicon nitride, Hot pressed silicon nitride, Sintered silicon nitride) Form factor (Powder, Balls, Substrates)

3M Co., Alzchem Group AG, American Elements Inc., Blasch Precision Ceramics Inc., Ceramaret SA, CeramTec GmbH, Compagnie de Saint Gobain SA, CoorsTek Inc., Ferrotec Holdings Corp., Innovacera Advanced Materials, International Syalons Newcastle, Kennametal Inc., Kyocera Corp., McDanel Advanced Material, Morgan Advance Ceramics, Precision Ceramics USA, Rogers Corp., Sandvik Coromant, SKF AB, Ube Corp. are a few of the key vendors in the Silicon Nitride market.

APAC will register the highest growth rate of 49% among the other regions. Therefore, the Silicon Nitride market in APAC is expected to garner significant business opportunities for the vendors during the forecast period.

China, Japan, India, South Korea, Australia, Indonesia, Germany, UK, France, Italy, Spain, The Netherlands, US, Canada, Mexico, Brazil, Argentina, Chile, Saudi Arabia, UAE, South Africa, Israel, Turkey

  • Rapid proliferation of electric vehicles and high-power electronics is the driving factor this market.

The Silicon Nitride market vendors should focus on grabbing business opportunities from the End-user segment as it accounted for the largest market share in the base year.
RIA - Research AI Assistant
Ask RIA
