Smart Kitchen Appliance Market Analysis, Size, and Forecast 2026-2030: North America (US, Canada, and Mexico), Europe (Germany, UK, and France), APAC (China, Japan, and India), South America (Brazil, Argentina, and Chile), Middle East and Africa (Saudi Arabia, UAE, and South Africa), and Rest of World (ROW)

Smart Kitchen Appliance Market Analysis, Size, and Forecast 2026-2030:
North America (US, Canada, and Mexico), Europe (Germany, UK, and France), APAC (China, Japan, and India), South America (Brazil, Argentina, and Chile), Middle East and Africa (Saudi Arabia, UAE, and South Africa), and Rest of World (ROW)

Published: Oct 2026 309 Pages SKU: IRTNTR43951

Market Overview at a Glance

$26.78 B
Market Opportunity
16.9%
CAGR 2025 - 2030
29.9%
North America Growth
$9.91 B
Smart large cooking appliance segment 2024

Smart Kitchen Appliance Market Size 2026-2030

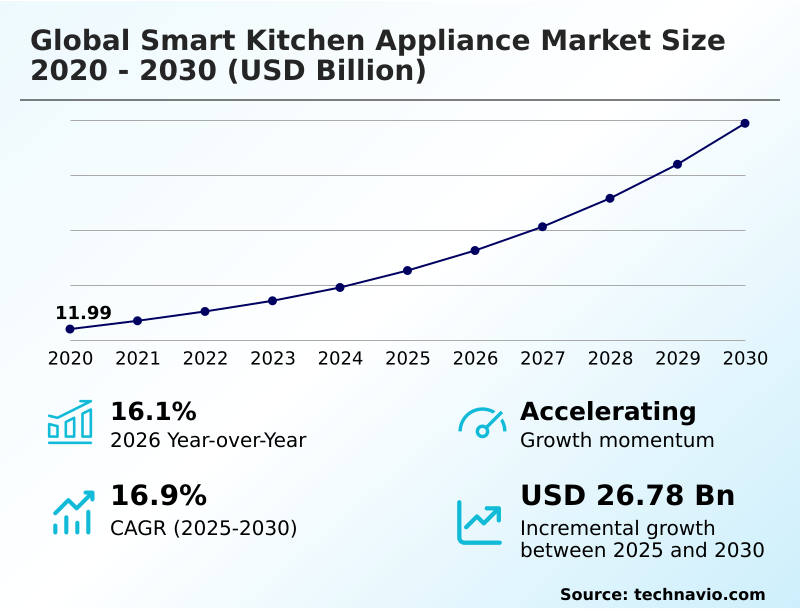
The smart kitchen appliance market size is valued to increase by USD 26.78 billion, at a CAGR of 16.9% from 2025 to 2030. Growing penetration of dual income households and time constrained lifestyles will drive the smart kitchen appliance market.

Major Market Trends & Insights

  • North America dominated the market and accounted for a 29.9% growth during the forecast period.
  • By Product - Smart large cooking appliance segment was valued at USD 9.91 billion in 2024
  • By Distribution Channel - Offline segment accounted for the largest market revenue share in 2024

Market Size & Forecast

  • Market Opportunities: USD 37.41 billion
  • Market Future Opportunities: USD 26.78 billion
  • CAGR from 2025 to 2030 : 16.9%

Market Summary

  • The Smart Kitchen Appliance sector is experiencing rapid structural transformation as consumers increasingly prioritize digital connectivity and automated domestic management. Adoption is accelerating as households integrate Wi-Fi enabled refrigeration, cooking, and cleaning systems to optimize daily culinary routines.
  • In a practical supply chain scenario, manufacturers are leveraging predictive data analytics from connected devices to anticipate component wear, improving replacement part inventory planning and reducing service response times by 25%. This continuous flow of usage data allows companies to optimize production schedules based on actual consumer behavior rather than estimated demand.
  • The primary catalyst propelling the Smart Kitchen Appliance expansion is the growing prevalence of dual-income households, which directly increases demand for time-saving, automated meal preparation technologies. Conversely, persistent interoperability limitations create a significant operational challenge, as fragmented software ecosystems prevent seamless communication between different branded devices, restricting the overall user experience.
  • Resolving these connectivity bottlenecks remains essential for achieving total home automation. The ongoing shift toward intuitive, sensor-driven functionality ensures that connected culinary equipment will remain a central component of modern residential infrastructure.

What will be the Size of the Smart Kitchen Appliance Market during the forecast period?
Get Key Insights on Market Forecast (PDF) Get Free Sample

How is the Smart Kitchen Appliance Market Segmented?

The smart kitchen appliance industry research report provides comprehensive data (region-wise segment analysis), with forecasts and estimates in "USD million" for the period 2026-2030, as well as historical data from 2020-2024 for the following segments.

  • Product
    • Smart large cooking appliance
    • Smart refrigerator
    • Smart small cooking appliance
    • Smart dishwasher
  • Distribution channel
    • Offline
    • Online
  • End-user
    • Residential
    • Commercial
  • Geography
    • North America
      • US
      • Canada
      • Mexico
    • Europe
      • Germany
      • UK
      • France
      • Italy
      • Spain
      • The Netherlands
    • APAC
      • China
      • Japan
      • India
      • South Korea
      • Australia
      • Indonesia
    • South America
      • Brazil
      • Argentina
      • Chile
    • Middle East and Africa
      • Saudi Arabia
      • UAE
      • South Africa
      • Turkey
      • Israel

By Product Insights

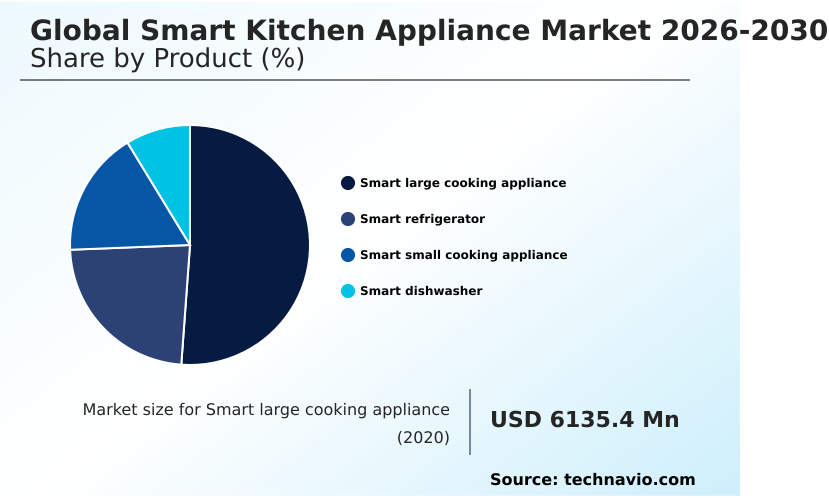
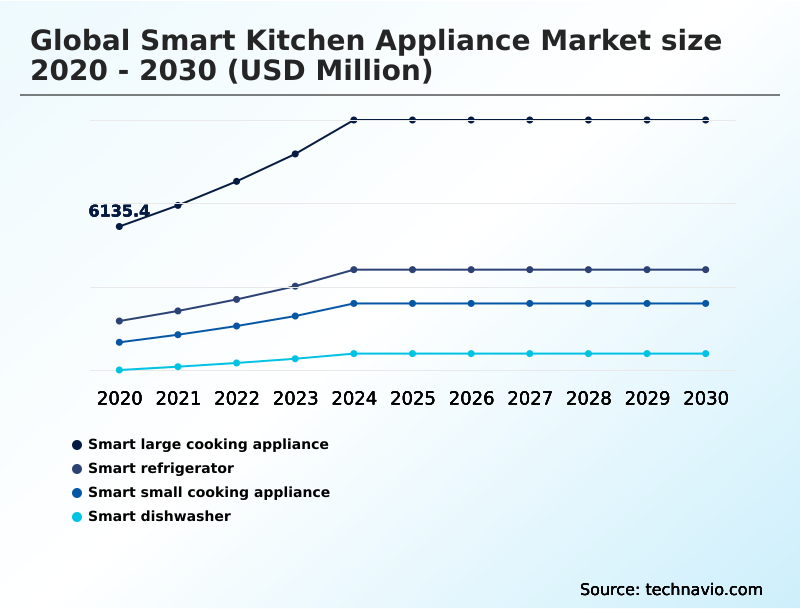
The smart large cooking appliance segment is estimated to witness significant growth during the forecast period.

The smart large cooking appliance segment fundamentally drives the Smart Kitchen Appliance by transforming traditional meal preparation into a highly automated process.

These advanced built-in cooking systems utilize sophisticated recipe integration algorithms and smart cooking assistance to optimize culinary outcomes without constant human supervision.

This segment differentiates itself from integrated refrigeration units by focusing entirely on heat precision and intelligent workflow management rather than preservation.

Equipment within this category increasingly relies on robust connected digital infrastructure to enable remote monitoring of kitchen operations, improving daily household time management by 30%.

Furthermore, seamless appliance communication allows these cooking platforms to synchronize with other devices, leveraging advanced energy management capabilities to reduce peak power consumption by 15%.

This continuous evolution toward intelligent automation addresses the growing demand for convenience, compelling manufacturers to continuously upgrade thermal control software and connectivity protocols.
Get Free Sample

The Smart large cooking appliance segment was valued at USD 9.91 billion in 2024 and showed a gradual increase during the forecast period.
Get Free Sample

Regional Analysis

North America is estimated to contribute 29.9% to the growth of the global market during the forecast period.Technavio’s analysts have elaborately explained the regional trends and drivers that shape the market during the forecast period.
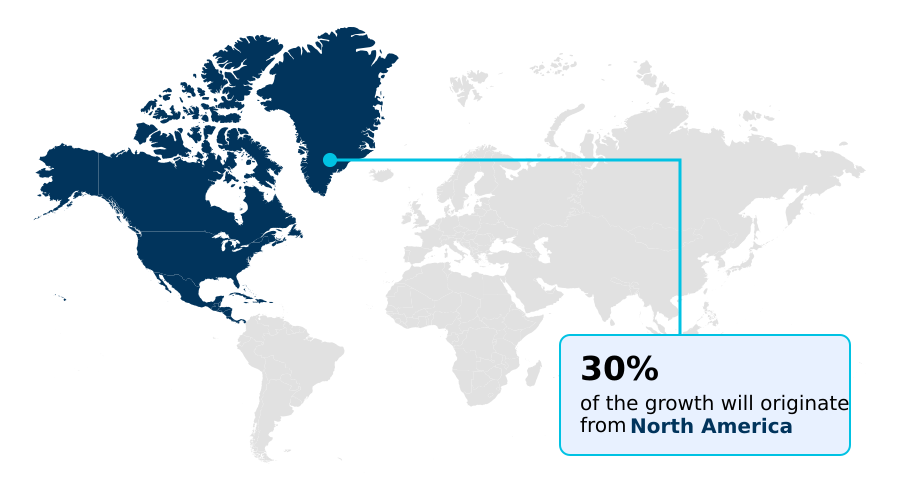
See How Smart Kitchen Appliance Market Demand is Rising in North America Get Free Sample

The Smart Kitchen Appliance displays distinct regional divergence, with North America leading adoption due to high digital infrastructure investment and consumer purchasing power.

North America maintains a 25% higher penetration rate of digital control systems compared to Europe, driven by a strong cultural preference for time-saving kitchen innovations and seamless smart home appliance interoperability.

Conversely, Europe prioritizes energy-efficient solutions, heavily adopting compact multifunctional platforms and an advanced induction cooking portfolio to meet strict environmental regulations.

This regulatory environment accelerates the deployment of cloud-based management capabilities and remote appliance monitoring, reducing household energy waste by 20%.

Across both regions, the rising demand for personalized meal preparation and automated food preservation is reshaping how manufacturers design smart culinary tools.

Companies are adapting by enhancing digital user interfaces to support complex cooking algorithms, ensuring product strategies align with specific regional efficiency targets and consumer automation preferences.

Market Dynamics

Our researchers analyzed the data with 2025 as the base year, along with the key drivers, trends, and challenges. A holistic analysis of drivers will help companies refine their marketing strategies to gain a competitive advantage.

  • The ongoing digital transformation within residential environments is fundamentally reshaping how consumers interact with their cooking spaces, driving unprecedented demand for the Smart Kitchen Appliance. Manufacturers are strategically pivoting toward the development of automated precise culinary preparation tools that minimize manual intervention while maximizing food quality and consistency.
  • This technological shift is heavily supported by robust AI integration in connected kitchens, which enables devices to learn user preferences, adjust cooking parameters autonomously, and optimize energy consumption based on real-time utility grid data.
  • From a supply chain perspective, equipment providers are utilizing predictive maintenance for smart appliances to transmit diagnostic data directly to service centers, effectively reducing post-warranty service turnaround times by nearly 30% compared to traditional reactive repair models. Such operational efficiencies lower warranty servicing costs and enhance brand loyalty among tech-savvy demographics.
  • Furthermore, establishing seamless smart home appliance interoperability remains a critical priority for industry stakeholders, as consumers expect disparate devices to communicate flawlessly within a unified digital ecosystem. The ability to execute remote monitoring of kitchen operations through centralized mobile applications allows users to manage complex meal preparations while attending to other professional or personal responsibilities.
  • As software protocols become increasingly standardized, the structural barriers to adoption continue to diminish, accelerating the integration of intelligent equipment into both new residential constructions and premium remodeling projects.
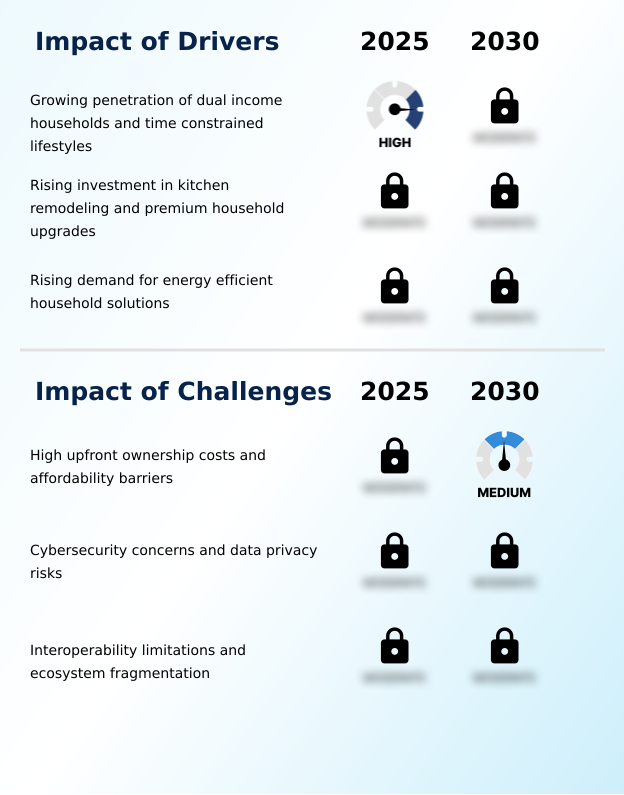
What are the key market drivers leading to the rise in the adoption of Smart Kitchen Appliance Industry?

  • The increasing prevalence of dual-income households and increasingly time-constrained lifestyles acts as a primary catalyst accelerating the adoption of connected culinary automation.

  • Rising consumer investment in premium kitchen remodeling is fundamentally accelerating the expansion of the Smart Kitchen Appliance.
  • Homeowners are actively upgrading traditional cooking spaces into hubs for digital household management, demanding equipment that offers flexible storage zones and precision temperature management.
  • This behavioral shift is propelled by the need to optimize daily routines, leading to the widespread installation of Wi-Fi enabled appliances and connected countertop solutions.
  • These devices utilize advanced sensor-based functionality and intelligent washing programs to automate repetitive tasks, which enhances water usage efficiency by 18%. Furthermore, the adoption of connected digital platforms and centralized management interfaces allows users to control multiple devices simultaneously.
  • The integration of predictive maintenance for smart appliances minimizes unexpected equipment failure, increasing overall appliance longevity by 25%. This continuous drive for convenience and resource optimization directly fuels sustained hardware upgrades and ecosystem expansion.

What are the market trends shaping the Smart Kitchen Appliance Industry?

  • A significant transition toward multifunctional kitchen platforms represents a defining trend within the industry. This evolution enables consumers to consolidate multiple culinary processes into cohesive digital environments.

  • The Smart Kitchen Appliance sector is experiencing a structural shift toward multifunctional digital ecosystems that consolidate food management and cooking processes. Consumers are increasingly adopting automated precise culinary preparation tools to streamline meal creation, driven by a desire for convenience.
  • This transition integrates AI-enabled cooking assistance and automated cooking modes directly into daily routines, replacing isolated devices with a cohesive smart refrigerator ecosystem and connected dishwashing systems. Consequently, users gain intelligent inventory visibility and resource consumption monitoring, improving household operational efficiency by 22%.
  • The integration of IoT-enabled kitchen equipment supports dual-income household automation, allowing users to leverage remote operation controls and seamless mobile application connectivity. This connectivity improves task synchronization, directly reducing manual meal preparation time by 30%. Businesses are rapidly adapting their product pipelines to deliver these comprehensive digital platforms, addressing the rising consumer demand for integrated, time-saving solutions.

What challenges does the Smart Kitchen Appliance Industry face during its growth?

  • Substantial upfront ownership costs and persistent affordability barriers remain significant obstacles constraining widespread consumer adoption across price-sensitive demographic segments.

  • Structural constraints regarding device compatibility severely impede the broader adoption of technologies within the Smart Kitchen Appliance. Many manufacturers prioritize proprietary ecosystem constraints, creating significant interoperability limitations when consumers attempt seamless smart home integration across different brands.
  • This fragmentation restricts the full potential of AI integration in connected kitchens, as automated cycle management and adaptive cooling technologies fail to communicate effectively outside their native networks. Consequently, users experience disrupted unified digital environments, reducing the intended convenience of voice control compatibility and predictive maintenance notifications.
  • Furthermore, the expansion of intelligent optimization capabilities introduces heightened cybersecurity vulnerabilities, requiring manufacturers to invest heavily in data protection infrastructure. These persistent integration barriers and security requirements increase operational development costs by 15%, forcing companies to allocate substantial resources toward software alignment rather than hardware innovation, which slows overall market penetration by 12%.

Exclusive Technavio Analysis on Customer Landscape

The smart kitchen appliance market forecasting report includes the adoption lifecycle of the market, covering from the innovator’s stage to the laggard’s stage. It focuses on adoption rates in different regions based on penetration. Furthermore, the smart kitchen appliance market report also includes key purchase criteria and drivers of price sensitivity to help companies evaluate and develop their market growth analysis strategies.
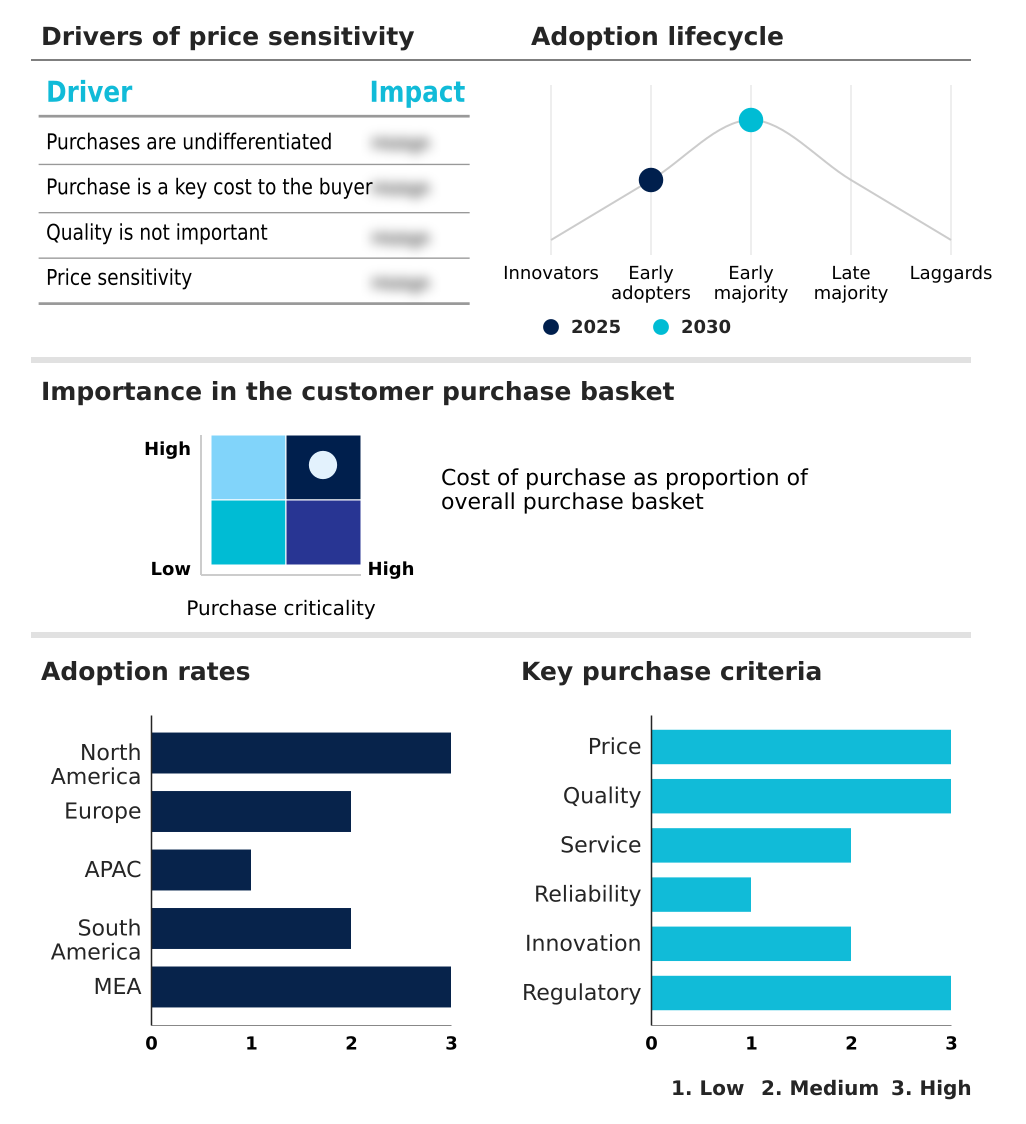
Customer Landscape of Smart Kitchen Appliance Industry

Competitive Landscape

Companies are implementing various strategies, such as strategic alliances, smart kitchen appliance market forecast, partnerships, mergers and acquisitions, geographical expansion, and product/service launches, to enhance their presence in the industry.

Arcelik A.S. - This provider delivers advanced intelligent culinary solutions, including connected refrigeration units, automated ovens, and smart dishwashing systems, enhancing household efficiency and integrating seamlessly into modern residential environments.

The industry research and growth report includes detailed analyses of the competitive landscape of the market and information about key companies, including:

  • Arcelik A.S.
  • Breville Group Ltd.
  • BSH Hausgerate GmbH
  • DeLonghi Group
  • Electrolux Group
  • Groupe SEB
  • Haier Smart Home Co. Ltd.
  • Koninklijke Philips NV
  • LG Electronics Inc.
  • MIDEA Group Co. Ltd.
  • Panasonic Holdings Corp.
  • Samsung Electronics Co. Ltd.
  • SharkNinja Operating LLC
  • Sub Zero Group Inc.
  • The Middleby Corp.
  • Tovala Inc.
  • Vestel Ticaret AS
  • Viomi Technology Co. Ltd.
  • Whirlpool Corp.
  • Xiaomi Corp.
  • Zojirushi America Corp.

Qualitative and quantitative analysis of companies has been conducted to help clients understand the wider business environment as well as the strengths and weaknesses of key industry players. Data is qualitatively analyzed to categorize companies as pure play, category-focused, industry-focused, and diversified; it is quantitatively analyzed to categorize companies as dominant, leading, strong, tentative, and weak.

Recent Development and News in Smart kitchen appliance market

  • In the Household Appliances industry, the integration of IoT sensors into premium product lines has enhanced predictive maintenance capabilities, directly impacting Smart Kitchen Appliance demand by reducing unexpected device failures by up to 20%.
  • The widespread implementation of stringent energy efficiency standards across North America and Europe has accelerated the phase-out of legacy electrical components, driving a 15% increase in consumer preference for sensor-based Smart Kitchen Appliance products that optimize power consumption.
  • Structural shifts toward modular and space-saving residential construction in APAC have catalyzed the development of compact multifunctional equipment, subsequently boosting the adoption rate of connected Smart Kitchen Appliance platforms by 25% among urban households.
  • Advancements in voice recognition software and centralized digital hubs have standardized interoperability protocols among major consumer electronics manufacturers, improving the seamless integration of Smart Kitchen Appliance networks and lowering installation friction for 30% of new users.

Dive into Technavio’s robust research methodology, blending expert interviews, extensive data synthesis, and validated models for unparalleled Smart Kitchen Appliance Market insights. See full methodology.

Market Scope
Page number 309
Base year 2025
Historic period 2020-2024
Forecast period 2026-2030
Growth momentum & CAGR Accelerate at a CAGR of 16.9%
Market growth 2026-2030 USD 26776.7 million
Market structure Fragmented
YoY growth 2025-2026(%) 16.1%
Key countries US, Canada, Mexico, Germany, UK, France, Italy, Spain, The Netherlands, China, Japan, India, South Korea, Australia, Indonesia, Brazil, Argentina, Chile, Saudi Arabia, UAE, South Africa, Turkey and Israel
Competitive landscape Leading Companies, Market Positioning of Companies, Competitive Strategies, and Industry Risks

Request Free Sample

Research Analyst Overview

  • The continuous evolution of the Smart Kitchen Appliance highlights a fundamental shift from standalone domestic equipment to highly integrated residential technology networks. Modern consumers increasingly demand a cohesive smart refrigerator ecosystem that extends beyond basic food preservation to encompass inventory tracking and automated replenishment functions.
  • The implementation of precision temperature management and sensor-based functionality across cooking platforms ensures consistent culinary outcomes while optimizing power consumption. In response to stringent environmental regulations, manufacturers are deploying advanced energy management capabilities, which have successfully reduced aggregate household power draw by 22% compared to conventional legacy appliances.
  • This focus on sustainability directly influences corporate product strategy and compliance budgeting, forcing companies to prioritize digital integration over simple mechanical upgrades. Furthermore, the adoption of intelligent washing programs and voice control compatibility enhances the hands-free user experience, catering to time-constrained demographics. The inclusion of predictive maintenance notifications enables proactive servicing, minimizing unexpected equipment downtime.
  • As residential digital infrastructure matures, these interconnected culinary devices transform the kitchen into a highly efficient, data-driven environment, fundamentally altering the trajectory of household appliance engineering.

What are the Key Data Covered in this Smart Kitchen Appliance Market Research and Growth Report?

  • What is the expected growth of the Smart Kitchen Appliance Market between 2026 and 2030?

    • USD 26.78 billion, at a CAGR of 16.9%

  • What segmentation does the market report cover?

    • The report is segmented by Product (Smart large cooking appliance, Smart refrigerator, Smart small cooking appliance, and Smart dishwasher), Distribution Channel (Offline, and Online), End-user (Residential, and Commercial) and Geography (North America, Europe, APAC, South America, Middle East and Africa)

  • Which regions are analyzed in the report?

    • North America, Europe, APAC, South America and Middle East and Africa

  • What are the key growth drivers and market challenges?

    • Growing penetration of dual income households and time constrained lifestyles, High upfront ownership costs and affordability barriers

  • Who are the major players in the Smart Kitchen Appliance Market?

    • Arcelik A.S., Breville Group Ltd., BSH Hausgerate GmbH, DeLonghi Group, Electrolux Group, Groupe SEB, Haier Smart Home Co. Ltd., Koninklijke Philips NV, LG Electronics Inc., MIDEA Group Co. Ltd., Panasonic Holdings Corp., Samsung Electronics Co. Ltd., SharkNinja Operating LLC, Sub Zero Group Inc., The Middleby Corp., Tovala Inc., Vestel Ticaret AS, Viomi Technology Co. Ltd., Whirlpool Corp., Xiaomi Corp. and Zojirushi America Corp.

Market Research Insights

  • The Smart Kitchen Appliance is rapidly modernizing traditional culinary spaces into highly efficient hubs for digital household management. The deployment of IoT-enabled kitchen equipment allows consumers to coordinate complex tasks through connected digital platforms, increasing daily operational efficiency by 25%.
  • By leveraging remote operation controls, users can adjust settings and monitor progress away from the home, which reduces energy waste by 18% during off-peak usage cycles. Furthermore, advanced mobile application connectivity ensures that devices receive real-time software updates, improving diagnostic accuracy by 30% and significantly lowering maintenance overhead.
  • This continuous synchronization between hardware and digital infrastructure enables businesses to optimize post-sale service delivery while offering consumers an unprecedented level of convenience and automation.

We can help! Our analysts can customize this smart kitchen appliance market research report to meet your requirements.

Get in touch

1. Executive Summary

1.1 Market overview

Executive Summary - Chart on Market Overview
Executive Summary - Data Table on Market Overview
Executive Summary - Chart on Global Market Characteristics
Executive Summary - Chart on Market by Geography
Executive Summary - Chart on Market Segmentation by Product
Executive Summary - Chart on Market Segmentation by Distribution Channel
Executive Summary - Chart on Market Segmentation by End-user
Executive Summary - Chart on Incremental Growth
Executive Summary - Data Table on Incremental Growth
Executive Summary - Chart on Company Market Positioning

2. Technavio Analysis

2.1 Analysis of price sensitivity, lifecycle, customer purchase basket, adoption rates, and purchase criteria

2.2 Criticality of inputs and Factors of differentiation

Chart on Overview on criticality of inputs and factors of differentiation

2.3 Factors of disruption

Chart on Overview on factors of disruption

2.4 Impact of drivers and challenges

Chart on Impact of drivers and challenges in 2025 and 2030

3. Market Landscape

3.1 Market ecosystem

Chart on Parent Market
Data Table on - Parent Market

3.2 Market characteristics

Chart on Market characteristics analysis

3.3 Value chain analysis

Chart on Value chain analysis

4. Market Sizing

4.1 Market definition

Data Table on Offerings of companies included in the market definition

4.2 Market segment analysis

Market segments

4.3 Market size 2025

4.4 Market outlook: Forecast for 2025-2030

Chart on Global - Market size and forecast 2025-2030 ($ million)
Data Table on Global - Market size and forecast 2025-2030 ($ million)
Chart on Global Market: Year-over-year growth 2025-2030 (%)
Data Table on Global Market: Year-over-year growth 2025-2030 (%)

5. Historic Market Size

5.1 Global Smart Kitchen Appliance Market 2020 - 2024

Historic Market Size - Data Table on Global Smart Kitchen Appliance Market 2020 - 2024 ($ million)

5.2 Product segment analysis 2020 - 2024

Historic Market Size - Product Segment 2020 - 2024 ($ million)

5.3 Distribution Channel segment analysis 2020 - 2024

Historic Market Size - Distribution Channel Segment 2020 - 2024 ($ million)

5.4 End-user segment analysis 2020 - 2024

Historic Market Size - End-user Segment 2020 - 2024 ($ million)

5.5 Geography segment analysis 2020 - 2024

Historic Market Size - Geography Segment 2020 - 2024 ($ million)

5.6 Country segment analysis 2020 - 2024

Historic Market Size - Country Segment 2020 - 2024 ($ million)

6. Qualitative Analysis

6.1 Impact of AI on global smart kitchen appliance market

6.2 Impact of geopolitical conflicts on global smart kitchen appliance market

7. Five Forces Analysis

7.1 Five forces summary

Five forces analysis - Comparison between 2025 and 2030

7.2 Bargaining power of buyers

Bargaining power of buyers - Impact of key factors 2025 and 2030

7.3 Bargaining power of suppliers

Bargaining power of suppliers - Impact of key factors in 2025 and 2030

7.4 Threat of new entrants

Threat of new entrants - Impact of key factors in 2025 and 2030

7.5 Threat of substitutes

Threat of substitutes - Impact of key factors in 2025 and 2030

7.6 Threat of rivalry

Threat of rivalry - Impact of key factors in 2025 and 2030

7.7 Market condition

Chart on Market condition - Five forces 2025 and 2030

8. Market Segmentation by Product

8.1 Market segments

Chart on Product - Market share 2025-2030 (%)
Data Table on Product - Market share 2025-2030 (%)

8.2 Comparison by Product

Chart on Comparison by Product
Data Table on Comparison by Product

8.3 Smart large cooking appliance - Market size and forecast 2025-2030

Chart on Smart large cooking appliance - Market size and forecast 2025-2030 ($ million)
Data Table on Smart large cooking appliance - Market size and forecast 2025-2030 ($ million)
Chart on Smart large cooking appliance - Year-over-year growth 2025-2030 (%)
Data Table on Smart large cooking appliance - Year-over-year growth 2025-2030 (%)

8.4 Smart refrigerator - Market size and forecast 2025-2030

Chart on Smart refrigerator - Market size and forecast 2025-2030 ($ million)
Data Table on Smart refrigerator - Market size and forecast 2025-2030 ($ million)
Chart on Smart refrigerator - Year-over-year growth 2025-2030 (%)
Data Table on Smart refrigerator - Year-over-year growth 2025-2030 (%)

8.5 Smart small cooking appliance - Market size and forecast 2025-2030

Chart on Smart small cooking appliance - Market size and forecast 2025-2030 ($ million)
Data Table on Smart small cooking appliance - Market size and forecast 2025-2030 ($ million)
Chart on Smart small cooking appliance - Year-over-year growth 2025-2030 (%)
Data Table on Smart small cooking appliance - Year-over-year growth 2025-2030 (%)

8.6 Smart dishwasher - Market size and forecast 2025-2030

Chart on Smart dishwasher - Market size and forecast 2025-2030 ($ million)
Data Table on Smart dishwasher - Market size and forecast 2025-2030 ($ million)
Chart on Smart dishwasher - Year-over-year growth 2025-2030 (%)
Data Table on Smart dishwasher - Year-over-year growth 2025-2030 (%)

8.7 Market opportunity by Product

Market opportunity by Product ($ million)
Data Table on Market opportunity by Product ($ million)

9. Market Segmentation by Distribution Channel

9.1 Market segments

Chart on Distribution Channel - Market share 2025-2030 (%)
Data Table on Distribution Channel - Market share 2025-2030 (%)

9.2 Comparison by Distribution Channel

Chart on Comparison by Distribution Channel
Data Table on Comparison by Distribution Channel

9.3 Offline - Market size and forecast 2025-2030

Chart on Offline - Market size and forecast 2025-2030 ($ million)
Data Table on Offline - Market size and forecast 2025-2030 ($ million)
Chart on Offline - Year-over-year growth 2025-2030 (%)
Data Table on Offline - Year-over-year growth 2025-2030 (%)

9.4 Online - Market size and forecast 2025-2030

Chart on Online - Market size and forecast 2025-2030 ($ million)
Data Table on Online - Market size and forecast 2025-2030 ($ million)
Chart on Online - Year-over-year growth 2025-2030 (%)
Data Table on Online - Year-over-year growth 2025-2030 (%)

9.5 Market opportunity by Distribution Channel

Market opportunity by Distribution Channel ($ million)
Data Table on Market opportunity by Distribution Channel ($ million)

10. Market Segmentation by End-user

10.1 Market segments

Chart on End-user - Market share 2025-2030 (%)
Data Table on End-user - Market share 2025-2030 (%)

10.2 Comparison by End-user

Chart on Comparison by End-user
Data Table on Comparison by End-user

10.3 Residential - Market size and forecast 2025-2030

Chart on Residential - Market size and forecast 2025-2030 ($ million)
Data Table on Residential - Market size and forecast 2025-2030 ($ million)
Chart on Residential - Year-over-year growth 2025-2030 (%)
Data Table on Residential - Year-over-year growth 2025-2030 (%)

10.4 Commercial - Market size and forecast 2025-2030

Chart on Commercial - Market size and forecast 2025-2030 ($ million)
Data Table on Commercial - Market size and forecast 2025-2030 ($ million)
Chart on Commercial - Year-over-year growth 2025-2030 (%)
Data Table on Commercial - Year-over-year growth 2025-2030 (%)

10.5 Market opportunity by End-user

Market opportunity by End-user ($ million)
Data Table on Market opportunity by End-user ($ million)

11. Customer Landscape

11.1 Customer landscape overview

Analysis of price sensitivity, lifecycle, customer purchase basket, adoption rates, and purchase criteria

12. Geographic Landscape

12.1 Geographic segmentation

Chart on Market share by geography 2025-2030 (%)
Data Table on Market share by geography 2025-2030 (%)

12.2 Geographic comparison

Chart on Geographic comparison
Data Table on Geographic comparison

12.3 North America - Market size and forecast 2025-2030

Chart on North America - Market size and forecast 2025-2030 ($ million)
Data Table on North America - Market size and forecast 2025-2030 ($ million)
Chart on North America - Year-over-year growth 2025-2030 (%)
Data Table on North America - Year-over-year growth 2025-2030 (%)
Chart on Regional Comparison - North America
Data Table on Regional Comparison - North America

12.3.1 US - Market size and forecast 2025-2030

Chart on US - Market size and forecast 2025-2030 ($ million)
Data Table on US - Market size and forecast 2025-2030 ($ million)
Chart on US - Year-over-year growth 2025-2030 (%)
Data Table on US - Year-over-year growth 2025-2030 (%)

12.3.2 Canada - Market size and forecast 2025-2030

Chart on Canada - Market size and forecast 2025-2030 ($ million)
Data Table on Canada - Market size and forecast 2025-2030 ($ million)
Chart on Canada - Year-over-year growth 2025-2030 (%)
Data Table on Canada - Year-over-year growth 2025-2030 (%)

12.3.3 Mexico - Market size and forecast 2025-2030

Chart on Mexico - Market size and forecast 2025-2030 ($ million)
Data Table on Mexico - Market size and forecast 2025-2030 ($ million)
Chart on Mexico - Year-over-year growth 2025-2030 (%)
Data Table on Mexico - Year-over-year growth 2025-2030 (%)

12.4 Europe - Market size and forecast 2025-2030

Chart on Europe - Market size and forecast 2025-2030 ($ million)
Data Table on Europe - Market size and forecast 2025-2030 ($ million)
Chart on Europe - Year-over-year growth 2025-2030 (%)
Data Table on Europe - Year-over-year growth 2025-2030 (%)
Chart on Regional Comparison - Europe
Data Table on Regional Comparison - Europe

12.4.1 Germany - Market size and forecast 2025-2030

Chart on Germany - Market size and forecast 2025-2030 ($ million)
Data Table on Germany - Market size and forecast 2025-2030 ($ million)
Chart on Germany - Year-over-year growth 2025-2030 (%)
Data Table on Germany - Year-over-year growth 2025-2030 (%)

12.4.2 UK - Market size and forecast 2025-2030

Chart on UK - Market size and forecast 2025-2030 ($ million)
Data Table on UK - Market size and forecast 2025-2030 ($ million)
Chart on UK - Year-over-year growth 2025-2030 (%)
Data Table on UK - Year-over-year growth 2025-2030 (%)

12.4.3 France - Market size and forecast 2025-2030

Chart on France - Market size and forecast 2025-2030 ($ million)
Data Table on France - Market size and forecast 2025-2030 ($ million)
Chart on France - Year-over-year growth 2025-2030 (%)
Data Table on France - Year-over-year growth 2025-2030 (%)

12.4.4 Italy - Market size and forecast 2025-2030

Chart on Italy - Market size and forecast 2025-2030 ($ million)
Data Table on Italy - Market size and forecast 2025-2030 ($ million)
Chart on Italy - Year-over-year growth 2025-2030 (%)
Data Table on Italy - Year-over-year growth 2025-2030 (%)

12.4.5 Spain - Market size and forecast 2025-2030

Chart on Spain - Market size and forecast 2025-2030 ($ million)
Data Table on Spain - Market size and forecast 2025-2030 ($ million)
Chart on Spain - Year-over-year growth 2025-2030 (%)
Data Table on Spain - Year-over-year growth 2025-2030 (%)

12.4.6 The Netherlands - Market size and forecast 2025-2030

Chart on The Netherlands - Market size and forecast 2025-2030 ($ million)
Data Table on The Netherlands - Market size and forecast 2025-2030 ($ million)
Chart on The Netherlands - Year-over-year growth 2025-2030 (%)
Data Table on The Netherlands - Year-over-year growth 2025-2030 (%)

12.5 APAC - Market size and forecast 2025-2030

Chart on APAC - Market size and forecast 2025-2030 ($ million)
Data Table on APAC - Market size and forecast 2025-2030 ($ million)
Chart on APAC - Year-over-year growth 2025-2030 (%)
Data Table on APAC - Year-over-year growth 2025-2030 (%)
Chart on Regional Comparison - APAC
Data Table on Regional Comparison - APAC

12.5.1 China - Market size and forecast 2025-2030

Chart on China - Market size and forecast 2025-2030 ($ million)
Data Table on China - Market size and forecast 2025-2030 ($ million)
Chart on China - Year-over-year growth 2025-2030 (%)
Data Table on China - Year-over-year growth 2025-2030 (%)

12.5.2 Japan - Market size and forecast 2025-2030

Chart on Japan - Market size and forecast 2025-2030 ($ million)
Data Table on Japan - Market size and forecast 2025-2030 ($ million)
Chart on Japan - Year-over-year growth 2025-2030 (%)
Data Table on Japan - Year-over-year growth 2025-2030 (%)

12.5.3 India - Market size and forecast 2025-2030

Chart on India - Market size and forecast 2025-2030 ($ million)
Data Table on India - Market size and forecast 2025-2030 ($ million)
Chart on India - Year-over-year growth 2025-2030 (%)
Data Table on India - Year-over-year growth 2025-2030 (%)

12.5.4 South Korea - Market size and forecast 2025-2030

Chart on South Korea - Market size and forecast 2025-2030 ($ million)
Data Table on South Korea - Market size and forecast 2025-2030 ($ million)
Chart on South Korea - Year-over-year growth 2025-2030 (%)
Data Table on South Korea - Year-over-year growth 2025-2030 (%)

12.5.5 Australia - Market size and forecast 2025-2030

Chart on Australia - Market size and forecast 2025-2030 ($ million)
Data Table on Australia - Market size and forecast 2025-2030 ($ million)
Chart on Australia - Year-over-year growth 2025-2030 (%)
Data Table on Australia - Year-over-year growth 2025-2030 (%)

12.5.6 Indonesia - Market size and forecast 2025-2030

Chart on Indonesia - Market size and forecast 2025-2030 ($ million)
Data Table on Indonesia - Market size and forecast 2025-2030 ($ million)
Chart on Indonesia - Year-over-year growth 2025-2030 (%)
Data Table on Indonesia - Year-over-year growth 2025-2030 (%)

12.6 South America - Market size and forecast 2025-2030

Chart on South America - Market size and forecast 2025-2030 ($ million)
Data Table on South America - Market size and forecast 2025-2030 ($ million)
Chart on South America - Year-over-year growth 2025-2030 (%)
Data Table on South America - Year-over-year growth 2025-2030 (%)
Chart on Regional Comparison - South America
Data Table on Regional Comparison - South America

12.6.1 Brazil - Market size and forecast 2025-2030

Chart on Brazil - Market size and forecast 2025-2030 ($ million)
Data Table on Brazil - Market size and forecast 2025-2030 ($ million)
Chart on Brazil - Year-over-year growth 2025-2030 (%)
Data Table on Brazil - Year-over-year growth 2025-2030 (%)

12.6.2 Argentina - Market size and forecast 2025-2030

Chart on Argentina - Market size and forecast 2025-2030 ($ million)
Data Table on Argentina - Market size and forecast 2025-2030 ($ million)
Chart on Argentina - Year-over-year growth 2025-2030 (%)
Data Table on Argentina - Year-over-year growth 2025-2030 (%)

12.6.3 Chile - Market size and forecast 2025-2030

Chart on Chile - Market size and forecast 2025-2030 ($ million)
Data Table on Chile - Market size and forecast 2025-2030 ($ million)
Chart on Chile - Year-over-year growth 2025-2030 (%)
Data Table on Chile - Year-over-year growth 2025-2030 (%)

12.7 Middle East and Africa - Market size and forecast 2025-2030

Chart on Middle East and Africa - Market size and forecast 2025-2030 ($ million)
Data Table on Middle East and Africa - Market size and forecast 2025-2030 ($ million)
Chart on Middle East and Africa - Year-over-year growth 2025-2030 (%)
Data Table on Middle East and Africa - Year-over-year growth 2025-2030 (%)
Chart on Regional Comparison - Middle East and Africa
Data Table on Regional Comparison - Middle East and Africa

12.7.1 Saudi Arabia - Market size and forecast 2025-2030

Chart on Saudi Arabia - Market size and forecast 2025-2030 ($ million)
Data Table on Saudi Arabia - Market size and forecast 2025-2030 ($ million)
Chart on Saudi Arabia - Year-over-year growth 2025-2030 (%)
Data Table on Saudi Arabia - Year-over-year growth 2025-2030 (%)

12.7.2 UAE - Market size and forecast 2025-2030

Chart on UAE - Market size and forecast 2025-2030 ($ million)
Data Table on UAE - Market size and forecast 2025-2030 ($ million)
Chart on UAE - Year-over-year growth 2025-2030 (%)
Data Table on UAE - Year-over-year growth 2025-2030 (%)

12.7.3 South Africa - Market size and forecast 2025-2030

Chart on South Africa - Market size and forecast 2025-2030 ($ million)
Data Table on South Africa - Market size and forecast 2025-2030 ($ million)
Chart on South Africa - Year-over-year growth 2025-2030 (%)
Data Table on South Africa - Year-over-year growth 2025-2030 (%)

12.7.4 Turkey - Market size and forecast 2025-2030

Chart on Turkey - Market size and forecast 2025-2030 ($ million)
Data Table on Turkey - Market size and forecast 2025-2030 ($ million)
Chart on Turkey - Year-over-year growth 2025-2030 (%)
Data Table on Turkey - Year-over-year growth 2025-2030 (%)

12.7.5 Israel - Market size and forecast 2025-2030

Chart on Israel - Market size and forecast 2025-2030 ($ million)
Data Table on Israel - Market size and forecast 2025-2030 ($ million)
Chart on Israel - Year-over-year growth 2025-2030 (%)
Data Table on Israel - Year-over-year growth 2025-2030 (%)

12.8 Market opportunity by geography

Market opportunity by geography ($ million)
Data Tables on Market opportunity by geography ($ million)

13. Drivers, Challenges, and Opportunity

13.1 Market drivers

Growing penetration of dual income households and time constrained lifestyles
Rising investment in kitchen remodeling and premium household upgrades
Rising demand for energy efficient household solutions

13.2 Market challenges

High upfront ownership costs and affordability barriers
Cybersecurity concerns and data privacy risks
Interoperability limitations and ecosystem fragmentation

13.3 Impact of drivers and challenges

Impact of drivers and challenges in 2025 and 2030

13.4 Market opportunities

Shift toward multifunctional kitchen platforms
Rising consumer demand for health conscious cooking and nutrition management
Expansion of software driven appliance ecosystems

14. Competitive Landscape

14.1 Overview

14.2

Overview on criticality of inputs and factors of differentiation

14.3 Landscape disruption

Overview on factors of disruption

14.4 Industry risks

Impact of key risks on business

15. Competitive Analysis

15.1 Companies profiled

Companies covered

15.2 Company ranking index

15.3 Market positioning of companies

Matrix on companies position and classification

15.4 Arcelik A.S.

Arcelik A.S. - Overview
Arcelik A.S. - Business segments
Arcelik A.S. - Key offerings
Arcelik A.S. - Segment focus
SWOT

15.5 DeLonghi Group

DeLonghi Group - Overview
DeLonghi Group - Business segments
DeLonghi Group - Key offerings
DeLonghi Group - Segment focus
SWOT

15.6 Electrolux Group

Electrolux Group - Overview
Electrolux Group - Business segments
Electrolux Group - Key offerings
Electrolux Group - Segment focus
SWOT

15.7 Groupe SEB

Groupe SEB - Overview
Groupe SEB - Business segments
Groupe SEB - Key offerings
Groupe SEB - Segment focus
SWOT

15.8 Haier Smart Home Co. Ltd.

Haier Smart Home Co. Ltd. - Overview
Haier Smart Home Co. Ltd. - Business segments
Haier Smart Home Co. Ltd. - Key offerings
Haier Smart Home Co. Ltd. - Segment focus
SWOT

15.9 Koninklijke Philips NV

Koninklijke Philips NV - Overview
Koninklijke Philips NV - Business segments
Koninklijke Philips NV - Key news
Koninklijke Philips NV - Key offerings
Koninklijke Philips NV - Segment focus
SWOT

15.10 LG Electronics Inc.

LG Electronics Inc. - Overview
LG Electronics Inc. - Business segments
LG Electronics Inc. - Key news
LG Electronics Inc. - Key offerings
LG Electronics Inc. - Segment focus
SWOT

15.11 MIDEA Group Co. Ltd.

MIDEA Group Co. Ltd. - Overview
MIDEA Group Co. Ltd. - Business segments
MIDEA Group Co. Ltd. - Key offerings
MIDEA Group Co. Ltd. - Segment focus
SWOT

15.12 Panasonic Holdings Corp.

Panasonic Holdings Corp. - Overview
Panasonic Holdings Corp. - Business segments
Panasonic Holdings Corp. - Key news
Panasonic Holdings Corp. - Key offerings
Panasonic Holdings Corp. - Segment focus
SWOT

15.13 Samsung Electronics Co. Ltd.

Samsung Electronics Co. Ltd. - Overview
Samsung Electronics Co. Ltd. - Business segments
Samsung Electronics Co. Ltd. - Key news
Samsung Electronics Co. Ltd. - Key offerings
Samsung Electronics Co. Ltd. - Segment focus
SWOT

15.14 SharkNinja Operating LLC

SharkNinja Operating LLC - Overview
SharkNinja Operating LLC - Business segments
SharkNinja Operating LLC - Key offerings
SharkNinja Operating LLC - Segment focus
SWOT

15.15 The Middleby Corp.

The Middleby Corp. - Overview
The Middleby Corp. - Business segments
The Middleby Corp. - Key offerings
The Middleby Corp. - Segment focus
SWOT

15.16 Viomi Technology Co. Ltd.

Viomi Technology Co. Ltd. - Overview
Viomi Technology Co. Ltd. - Product / Service
Viomi Technology Co. Ltd. - Key offerings
SWOT

15.17 Whirlpool Corp.

Whirlpool Corp. - Overview
Whirlpool Corp. - Business segments
Whirlpool Corp. - Key offerings
Whirlpool Corp. - Segment focus
SWOT

15.18 Xiaomi Corp.

Xiaomi Corp. - Overview
Xiaomi Corp. - Business segments
Xiaomi Corp. - Key offerings
Xiaomi Corp. - Segment focus
SWOT

16. Appendix

16.1 Scope of the report

Market definition
Objectives
Notes and caveats

16.2 Inclusions and exclusions checklist

Inclusions checklist
Exclusions checklist

16.3 Currency conversion rates for US$

16.4 Research methodology

16.5 Data procurement

Information sources

16.6 Data validation

16.7 Validation techniques employed for market sizing

16.8 Data synthesis

16.9 360 degree market analysis

16.10 List of abbreviations

Research Methodology

Technavio presents a detailed picture of the market by way of study, synthesis, and summation of data from multiple sources. The analysts have presented the various facets of the market with a particular focus on identifying the key industry influencers. The data thus presented is comprehensive, reliable, and the result of extensive research, both primary and secondary.

INFORMATION SOURCES

Primary sources

  • Manufacturers and suppliers
  • Channel partners
  • Industry experts
  • Strategic decision makers

Secondary sources

  • Industry journals and periodicals
  • Government data
  • Financial reports of key industry players
  • Historical data
  • Press releases

DATA ANALYSIS

Data Synthesis

  • Collation of data
  • Estimation of key figures
  • Analysis of derived insights

Data Validation

  • Triangulation with data models
  • Reference against proprietary databases
  • Corroboration with industry experts

REPORT WRITING

Qualitative

  • Market drivers
  • Market challenges
  • Market trends
  • Five forces analysis

Quantitative

  • Market size and forecast
  • Market segmentation
  • Geographical insights
  • Competitive landscape

Interested in this report?

Get your sample now to see our research methodology and insights!

Download Now

Frequently Asked Questions

Smart Kitchen Appliance market growth will increase by USD 26776.7 million during 2026-2030.

The Smart Kitchen Appliance market is expected to grow at a CAGR of 16.9% during 2026-2030.

Smart Kitchen Appliance market is segmented by Product (Smart large cooking appliance, Smart refrigerator, Smart small cooking appliance, Smart dishwasher) Distribution channel (Offline, Online) End-user (Residential, Commercial)

Arcelik A.S., Breville Group Ltd., BSH Hausgerate GmbH, DeLonghi Group, Electrolux Group, Groupe SEB, Haier Smart Home Co. Ltd., Koninklijke Philips NV, LG Electronics Inc., MIDEA Group Co. Ltd., Panasonic Holdings Corp., Samsung Electronics Co. Ltd., SharkNinja Operating LLC, Sub Zero Group Inc., The Middleby Corp., Tovala Inc., Vestel Ticaret AS, Viomi Technology Co. Ltd., Whirlpool Corp., Xiaomi Corp., Zojirushi America Corp. are a few of the key vendors in the Smart Kitchen Appliance market.

North America will register the highest growth rate of 29.9% among the other regions. Therefore, the Smart Kitchen Appliance market in North America is expected to garner significant business opportunities for the vendors during the forecast period.

US, Canada, Mexico, Germany, UK, France, Italy, Spain, The Netherlands, China, Japan, India, South Korea, Australia, Indonesia, Brazil, Argentina, Chile, Saudi Arabia, UAE, South Africa, Turkey, Israel

  • Growing penetration of dual income households and time constrained lifestyles is the driving factor this market.

The Smart Kitchen Appliance market vendors should focus on grabbing business opportunities from the Product segment as it accounted for the largest market share in the base year.
RIA - Research AI Assistant
Ask RIA
