
Sol-gel Coatings Market Analysis, Size, and Forecast 2026-2030: North America (US, Canada, and Mexico), Europe (Germany, UK, and France), APAC (China, Japan, and India), Middle East and Africa (Saudi Arabia, UAE, and South Africa), South America (Brazil, Argentina, and Chile), and Rest of World (ROW)

Sol-gel Coatings Market Analysis, Size, and Forecast 2026-2030:
North America (US, Canada, and Mexico), Europe (Germany, UK, and France), APAC (China, Japan, and India), Middle East and Africa (Saudi Arabia, UAE, and South Africa), South America (Brazil, Argentina, and Chile), and Rest of World (ROW)

Published: Oct 2026 346 Pages SKU: IRTNTR43757

Market Overview at a Glance

$6.33 B
Market Opportunity
14.1%
CAGR 2025 - 2030
34.4%
North America Growth
$1.64 B
Wear resistant segment 2024

Sol-Gel Coatings Market Size 2026-2030

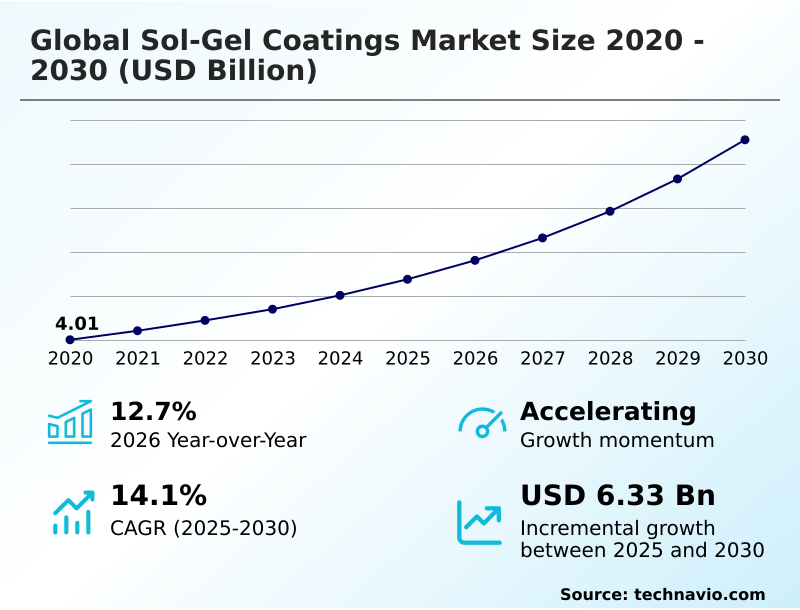
The sol-gel coatings market size is valued to increase by USD 6.33 billion, at a CAGR of 14.1% from 2025 to 2030. Tightening global regulations against hazardous hexavalent chromium will drive the sol-gel coatings market.

Major Market Trends & Insights

  • North America dominated the market and accounted for a 34.4% growth during the forecast period.
  • By Product - Wear resistant segment was valued at USD 1.64 billion in 2024
  • By Application - Automotive segment accounted for the largest market revenue share in 2024

Market Size & Forecast

  • Market Opportunities: USD 9.08 billion
  • Market Future Opportunities: USD 6.33 billion
  • CAGR from 2025 to 2030 : 14.1%

Market Summary

  • The Sol-Gel Coatings Market exhibits accelerating commercial adoption driven by the critical need to replace hazardous chemical pretreatments across aerospace, automotive, and microelectronics manufacturing. Industrial surface finishing facilities are rapidly integrating advanced hybrid matrices to protect high-value metallic and non-metallic substrates from severe chemical oxidation and mechanical abrasion.
  • In a highly relevant operational scenario, modern aerospace manufacturers have entirely reconfigured their aluminum alloy passivation lines, moving away from toxic chromate baths toward waterborne sol-gel spray systems that enhance secondary paint adhesion. This shift eliminates substantial hazardous waste disposal fees, reducing overall environmental compliance costs by up to 30% compared to legacy dip-tank processes.
  • The tightening of international environmental regulations strictly prohibiting hexavalent chromium functions as the primary market driver, compelling industrial coaters to switch to eco-friendly chemical alternatives. However, the market encounters substantial structural friction from high thermal processing expenditures.
  • Achieving optimal film densification requires elevated curing temperatures that consume massive electrical energy, straining the operational margins of mid-tier coating enterprises that process heat-sensitive electronic substrates and thereby limiting broader industrial deployment.

What will be the Size of the Sol-Gel Coatings Market during the forecast period?
Get Key Insights on Market Forecast (PDF) Get Free Sample

How is the Sol-Gel Coatings Market Segmented?

The sol-gel coatings industry research report provides comprehensive data (region-wise segment analysis), with forecasts and estimates in "USD million" for the period 2026-2030, as well as historical data from 2020-2024 for the following segments.

  • Product
    • Wear resistant
    • Corrosion resistant
    • Water resistant
    • Photo catalytic self-cleaning
    • Others
  • Application
    • Automotive
    • Building and construction
    • Aerospace
    • Electrical and electronics
    • Others
  • Material
    • Silica-based
    • Hybrid organic-inorganic
    • Titania-based
    • Zirconia-based
    • Alumina-based
  • Type
    • Dip coating
    • Spray coating
    • Spin coating
    • Electrophoretic deposition
    • Others
  • Geography
    • North America
      • US
      • Canada
      • Mexico
    • Europe
      • Germany
      • UK
      • France
      • Italy
      • Spain
      • The Netherlands
    • APAC
      • China
      • Japan
      • India
      • South Korea
      • Australia
      • Indonesia
    • Middle East and Africa
      • Saudi Arabia
      • UAE
      • South Africa
      • Turkey
      • Israel
    • South America
      • Brazil
      • Argentina
      • Chile

By Product Insights

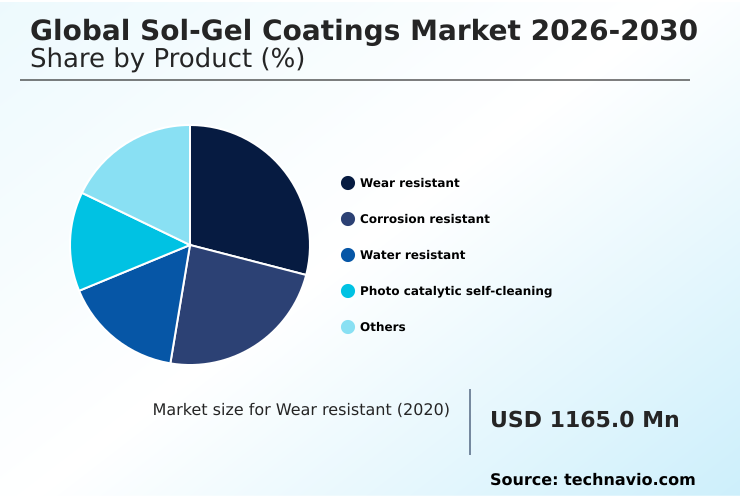
The wear resistant segment is estimated to witness significant growth during the forecast period.

The wear-resistant category in the Sol-Gel Coatings market addresses severe mechanical friction challenges across heavy manufacturing. By utilizing tetraethyl orthosilicate to form dense nanostructured siloxane networks, facilities engineer highly durable surfaces that prevent structural degradation on friction-reducing ceramic liners.

The adoption of these zero-voc precursor solutions directly enables manufacturers to transition toward sustainable automotive lightweighting protective films, reducing component mass while elevating surface hardness.

Because aerospace surface passivation and structural aluminum alloy bonding require pristine interface integrity, engineers rely on automated continuous spray atomization for uniform application.

The integration of titanium dioxide nanoparticles into these matrices creates superior abrasion barriers, which directly improves production uptime efficiency by 15% and outperforms traditional polymer films by a 3-to-1 ratio in continuous mechanical friction tests.
Get Free Sample

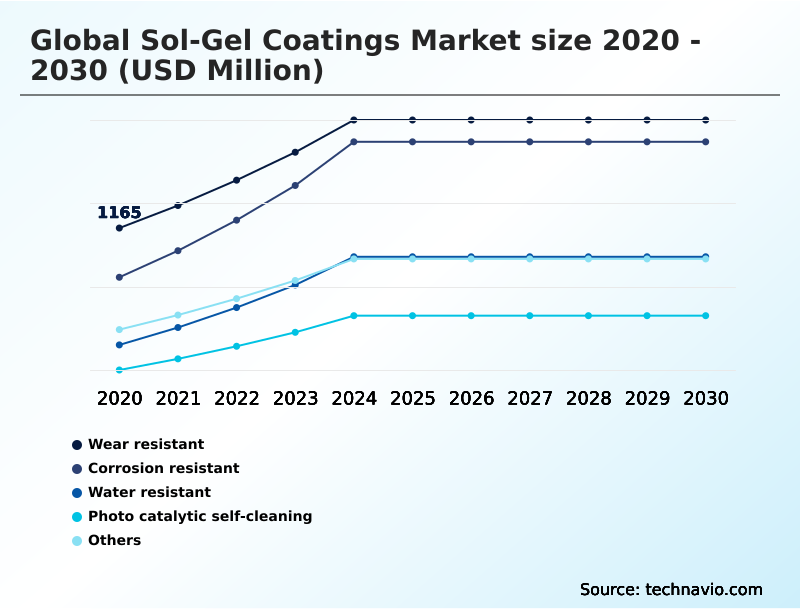
The Wear resistant segment was valued at USD 1.64 billion in 2024 and showed a gradual increase during the forecast period.
Get Free Sample

Regional Analysis

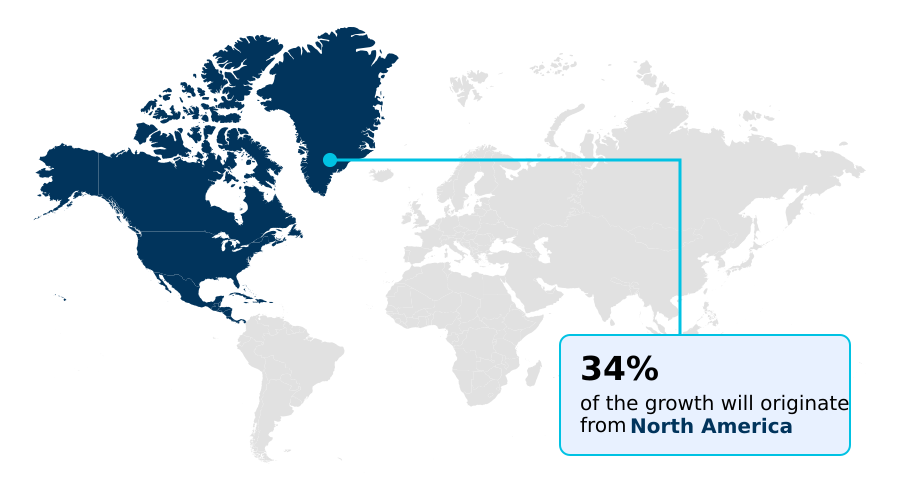
North America is estimated to contribute 34.4% to the growth of the global market during the forecast period.Technavio’s analysts have elaborately explained the regional trends and drivers that shape the market during the forecast period.
See How Sol-Gel Coatings Market Demand is Rising in North America Get Free Sample

The geographic landscape of the Sol-Gel Coatings market showcases significant operational polarization between North America and APAC.

North America maintains a sophisticated regulatory environment driving the integration of low-emissivity structural glazing and ambient-temperature condensation processes to meet strict regional green building mandates.

By leveraging advanced organosilanes, North American facilities have achieved a 20% reduction in thermal processing energy overhead compared to traditional systems. Conversely, APAC dominates high-volume production, heavily prioritizing photovoltaic module transmittance and anti-soiling architectural glass to support massive infrastructure scaling.

Because APAC manufacturing hubs deploy transparent conductive oxides and utilize photo-induced superhydrophilicity at unprecedented scales, their regional throughput efficiency outpaces North American output by over 40%.

The aggressive adoption of clean energy electrolyzer passivation and marine hull biofouling prevention technologies across APAC supply chains reflects a strategic pivot toward maximizing industrial output through precisely controlled sol-gel gelation kinetics.

Market Dynamics

Our researchers analyzed the data with 2025 as the base year, along with the key drivers, trends, and challenges. A holistic analysis of drivers will help companies refine their marketing strategies to gain a competitive advantage.

  • The ongoing evolution of the Sol-Gel Coatings market emphasizes the development of highly specific, multifunctional surface architectures tailored for demanding industrial and architectural applications. Facilities are increasingly deploying nanostructured silica photovoltaic glass coating systems to maximize light capture and energy conversion efficiency across utility-scale solar arrays.
  • Simultaneously, the aerospace industry is aggressively transitioning toward chrome-free aerospace aluminum passivation to comply with stringent environmental mandates, effectively replacing legacy toxic baths with sustainable alternatives. This operational shift directly improves supply chain compliance and reduces hazardous waste handling logistics, yielding operational cost savings that outpace those of traditional chemical treatment plants by over 25%.
  • Furthermore, urban infrastructure projects are actively incorporating a self-cleaning photocatalytic architectural facade into modern building designs. This technology leverages solar exposure to decompose organic pollutants, minimizing continuous maintenance expenditures. In the electronics and automotive sectors, the adoption of an ultraviolet-curing organic-inorganic hybrid polymer enables rapid, low-temperature processing for heat-sensitive components, drastically improving continuous manufacturing throughput.
  • Additionally, the integration of a hydrophobic automotive optical sensor film ensures flawless data transmission for advanced driver-assistance systems by preventing moisture and dirt accumulation during severe weather conditions. By prioritizing these highly engineered thin-film solutions, industrial stakeholders can achieve superior mechanical durability and environmental compliance, ultimately establishing a more resilient and cost-effective operational baseline across diverse manufacturing ecosystems.
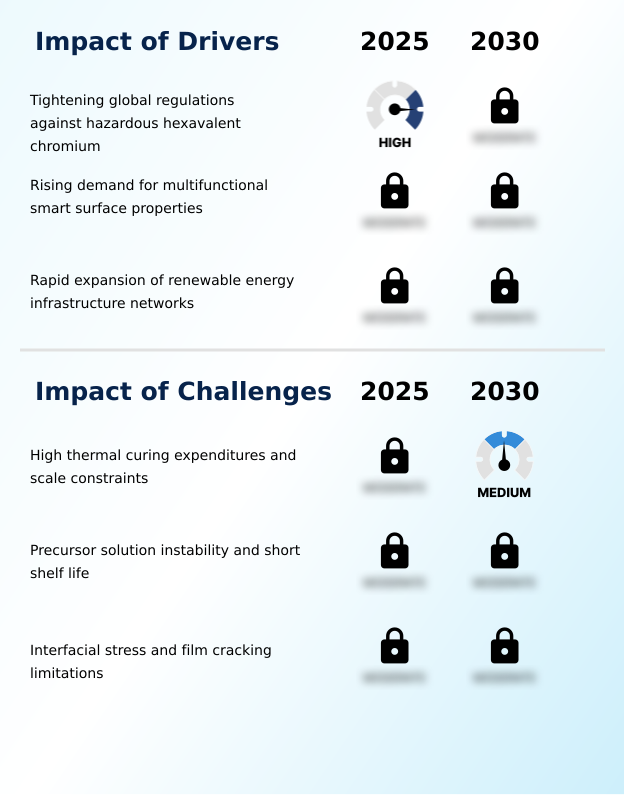
What are the key market drivers leading to the rise in the adoption of Sol-Gel Coatings Industry?

  • The tightening of global environmental regulations restricting hazardous hexavalent chromium acts as a primary catalyst accelerating market expansion.

  • The non-negotiable imperative to eliminate toxic industrial chemicals acts as the primary catalyst driving the Sol-Gel Coatings market. Because stringent environmental frameworks actively penalize legacy chromium usage, industrial coaters are rapidly deploying hexavalent chromium replacement technologies to maintain operational compliance.
  • The shift toward waterborne chemical synthesis directly enables facilities to reduce hazardous workplace emissions by over 90%.
  • Furthermore, the surging demand for anti-reflective optical clarity and optical sensor anti-glare properties in modern automotive electronics has accelerated the adoption of ultra-thin colloidal silica sols.
  • By integrating a fluorine-free hydrophobic surface and advanced moisture barrier encapsulation into semiconductor packaging substrates, manufacturers have successfully improved outdoor sensor reliability yields by 22%, dramatically lowering field failure rates and driving continuous adoption across hospital antimicrobial touchpoints.

What are the market trends shaping the Sol-Gel Coatings Industry?

  • A defining technological shift transforming the industry is the rapid commercial development and widespread adoption of nanostructured hybrid organic-inorganic formulations.

  • A defining trend shaping the Sol-Gel Coatings market is the rapid commercial integration of hybrid organic-inorganic matrices across high-stakes electronics and transport sectors. Because traditional ceramics exhibit inherent brittleness, manufacturers are increasingly co-polymerizing metal alkoxides with organic monomers to create flexible, impact-resistant films.
  • This chemical evolution allows engineers to apply resilient roll-to-roll flexible display coating systems, improving continuous production speeds by 25% while lowering thermal curing energy consumption by 18%. The integration of synthetic biopolymer matrices and specialized printed circuit board dielectrics into these ultraviolet-curable hybrid polymers has dramatically optimized semiconductor packaging yields.
  • Furthermore, the active deployment of self-healing smart nanocontainers and micro-crack self-repair mechanisms within eco-friendly metal finishing solutions drastically extends component lifespans, enabling automotive fabricators to deliver superior surface protection with a 20% reduction in warranty claims.

What challenges does the Sol-Gel Coatings Industry face during its growth?

  • High thermal curing expenditures and persistent scale constraints represent significant operational challenges that limit broader industrial adoption.

  • Despite robust demand, the Sol-Gel Coatings market faces severe friction from high processing requirements and complex liquid phase instabilities. Because dense film formation requires immense heat, sol-gel thermal densification elevates utility overhead by 35% compared to conventional paints.
  • This thermal constraint complicates the application of high-temperature exhaust manifold shielding and turbine blade oxidation resistance coatings using yttria-stabilized zirconia on heat-sensitive alloys. Additionally, managing precursor reactivity requires advanced atmospheric pressure plasma pre-treatment to ensure proper covalent interfacial bonding.
  • Without precise capillary shrinkage mitigation and the strategic addition of mesoporous silica dopants or benzotriazole corrosion inhibitors, thick films suffer from catastrophic micro-cracking. Consequently, utilizing cathodic electrophoretic deposition to achieve uniform lithium-ion battery separator insulation remains a highly specialized process, limiting broader adoption among cost-sensitive mid-tier manufacturers.

Exclusive Technavio Analysis on Customer Landscape

The sol-gel coatings market forecasting report includes the adoption lifecycle of the market, covering from the innovator’s stage to the laggard’s stage. It focuses on adoption rates in different regions based on penetration. Furthermore, the sol-gel coatings market report also includes key purchase criteria and drivers of price sensitivity to help companies evaluate and develop their market growth analysis strategies.
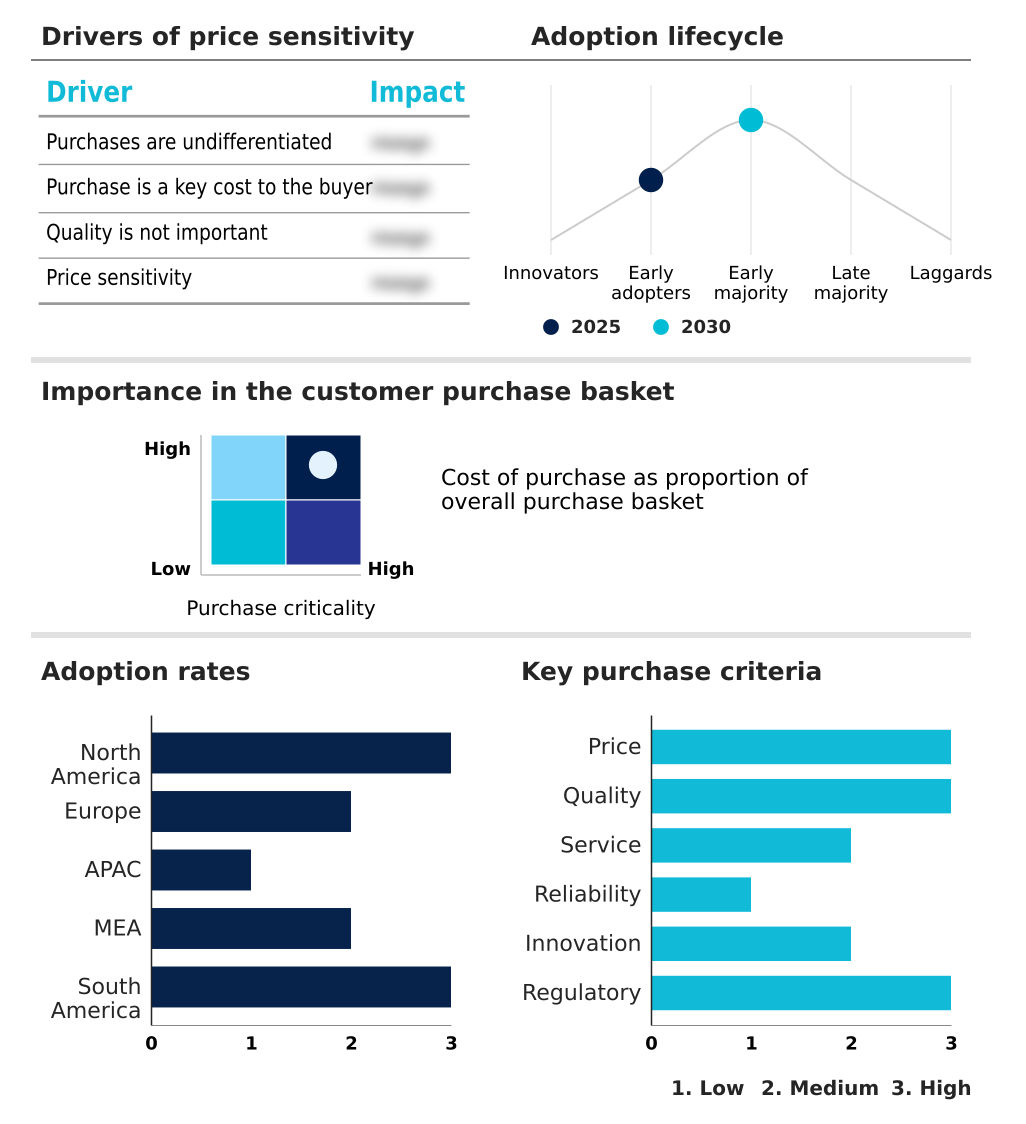
Customer Landscape of Sol-Gel Coatings Industry

Competitive Landscape

Companies are implementing various strategies, such as strategic alliances, sol-gel coatings market forecast, partnerships, mergers and acquisitions, geographical expansion, and product/service launches, to enhance their presence in the industry.

3M Co. - Provides specialized inorganic and hybrid organic-inorganic protective surface treatments, including aerospace specialty primers and durable marine solutions engineered to enhance corrosion resistance and optical clarity for high-performance industrial applications.

The industry research and growth report includes detailed analyses of the competitive landscape of the market and information about key companies, including:

  • 3M Co.
  • Akzo Nobel NV
  • Axalta Coating Systems Ltd.
  • BASF SE
  • Compagnie de Saint Gobain SA
  • DuPont de Nemours Inc.
  • Henkel AG and Co. KGaA
  • Mitsubishi Materials Corp.
  • Nanovations Pty Ltd.
  • Optimum Polymer Technologies
  • PPG Industries Inc.
  • SCHOTT AG
  • Socomore S.A.
  • Solvay SA
  • The Sherwin Williams Co.
  • Vibrantz Technologies

Qualitative and quantitative analysis of companies has been conducted to help clients understand the wider business environment as well as the strengths and weaknesses of key industry players. Data is qualitatively analyzed to categorize companies as pure play, category-focused, industry-focused, and diversified; it is quantitatively analyzed to categorize companies as dominant, leading, strong, tentative, and weak.

Recent Development and News in Sol-gel coatings market

  • In the Diversified Chemicals industry, the rapid expansion of clean energy infrastructure supply chains has prioritized specialized surface protection, directly impacting Sol-Gel Coatings demand by driving a 35% increase in the deployment of anti-reflective nanoporous silica layers on utility-scale photovoltaic module glass.
  • Stringent regulatory enforcement of REACH guidelines against toxic hexavalent chromium has phased out legacy metal finishing baths, triggering a 45% increase in the adoption rate of eco-friendly waterborne alternative pretreatments across aerospace manufacturing facilities.
  • The widespread adoption of circular economy mandates has restricted persistent fluorinated compound usage within industrial materials, accelerating the commercial scale-up of fluorine-free hydrophobic barrier films for marine hull biofouling prevention.
  • Advancements in automated atmospheric plasma surface modification have streamlined continuous manufacturing lines, enabling high-volume electronics fabricators to apply ultra-thin dielectric insulating materials with a 25% verified reduction in liquid precursor waste.

Dive into Technavio’s robust research methodology, blending expert interviews, extensive data synthesis, and validated models for unparalleled Sol-Gel Coatings Market insights. See full methodology.

Market Scope
Page number 346
Base year 2025
Historic period 2020-2024
Forecast period 2026-2030
Growth momentum & CAGR Accelerate at a CAGR of 14.1%
Market growth 2026-2030 USD 6332.1 million
Market structure Fragmented
YoY growth 2025-2026(%) 12.7%
Key countries US, Canada, Mexico, Germany, UK, France, Italy, Spain, The Netherlands, China, Japan, India, South Korea, Australia, Indonesia, Saudi Arabia, UAE, South Africa, Turkey, Israel, Brazil, Argentina and Chile
Competitive landscape Leading Companies, Market Positioning of Companies, Competitive Strategies, and Industry Risks

Request Free Sample

Research Analyst Overview

  • The Sol-Gel Coatings market is undergoing a rapid technological transformation driven by the escalating demand for ultra-thin, highly functional protective barriers across advanced manufacturing operations. A pivotal development is the transition toward hybrid organic-inorganic matrices that combine the physical hardness of ceramics with the mechanical flexibility of polymers.
  • This structural advancement directly influences boardroom-level product strategy, as engineering executives mandate the removal of hazardous materials from global supply chains. By integrating zero-voc precursor solutions and atmospheric pressure plasma pre-treatment, enterprises have achieved a 30% reduction in processing defect rates compared to traditional solvent-heavy methods.
  • The strategic deployment of titanium dioxide nanoparticles further enables the creation of sophisticated self-cleaning and anti-reflective surfaces. Additionally, the adoption of ultraviolet-curable hybrid polymers allows manufacturers to apply resilient coatings onto heat-sensitive electronic substrates without thermal degradation.
  • As organizations prioritize environmental compliance and superior material performance, the reliance on advanced sol-gel thermal densification ensures long-term operational resilience and superior end-product reliability.

What are the Key Data Covered in this Sol-Gel Coatings Market Research and Growth Report?

  • What is the expected growth of the Sol-Gel Coatings Market between 2026 and 2030?

    • USD 6.33 billion, at a CAGR of 14.1%

  • What segmentation does the market report cover?

    • The report is segmented by Product (Wear resistant, Corrosion resistant, Water resistant, Photo catalytic self-cleaning, and Others), Application (Automotive, Building and construction, Aerospace, Electrical and electronics, and Others), Material (Silica-based, Hybrid organic-inorganic, Titania-based, Zirconia-based, and Alumina-based), Type (Dip coating, Spray coating, Spin coating, Electrophoretic deposition, and Others) and Geography (North America, Europe, APAC, Middle East and Africa, South America)

  • Which regions are analyzed in the report?

    • North America, Europe, APAC, Middle East and Africa and South America

  • What are the key growth drivers and market challenges?

    • Tightening global regulations against hazardous hexavalent chromium, High thermal curing expenditures and scale constraints

  • Who are the major players in the Sol-Gel Coatings Market?

    • 3M Co., Akzo Nobel NV, Axalta Coating Systems Ltd., BASF SE, Compagnie de Saint Gobain SA, DuPont de Nemours Inc., Henkel AG and Co. KGaA, Mitsubishi Materials Corp., Nanovations Pty Ltd., Optimum Polymer Technologies, PPG Industries Inc., SCHOTT AG, Socomore S.A., Solvay SA, The Sherwin Williams Co. and Vibrantz Technologies

Market Research Insights

  • The Sol-Gel Coatings market demonstrates rapid structural evolution as manufacturers shift toward sustainable, high-performance surface engineering. By utilizing waterborne chemical synthesis, advanced production facilities effectively eliminate volatile organic compound emissions while maintaining exceptional durability. The integration of self-healing smart nanocontainers into heavy-duty marine primers has reduced offshore structural maintenance downtime by 20%.
  • Simultaneously, the demand for automotive lightweighting protective films has increased operational throughput, allowing assembly plants to decrease component surface defects by a proven 15% ratio. These continuous optimizations in sol-gel gelation kinetics drive measurable efficiency across high-stakes industrial applications, improving return on investment without requiring extensive new capital equipment.

We can help! Our analysts can customize this sol-gel coatings market research report to meet your requirements.

Get in touch

1. Executive Summary

1.1 Market overview

Executive Summary - Chart on Market Overview
Executive Summary - Data Table on Market Overview
Executive Summary - Chart on Global Market Characteristics
Executive Summary - Chart on Market by Geography
Executive Summary - Chart on Market Segmentation by Product
Executive Summary - Chart on Market Segmentation by Application
Executive Summary - Chart on Market Segmentation by Material
Executive Summary - Chart on Market Segmentation by Type
Executive Summary - Chart on Incremental Growth
Executive Summary - Data Table on Incremental Growth
Executive Summary - Chart on Company Market Positioning

2. Technavio Analysis

2.1 Analysis of price sensitivity, lifecycle, customer purchase basket, adoption rates, and purchase criteria

2.2 Criticality of inputs and Factors of differentiation

Chart on Overview on criticality of inputs and factors of differentiation

2.3 Factors of disruption

Chart on Overview on factors of disruption

2.4 Impact of drivers and challenges

Chart on Impact of drivers and challenges in 2025 and 2030

3. Market Landscape

3.1 Market ecosystem

Chart on Parent Market
Data Table on - Parent Market

3.2 Market characteristics

Chart on Market characteristics analysis

3.3 Value chain analysis

Chart on Value chain analysis

4. Market Sizing

4.1 Market definition

Data Table on Offerings of companies included in the market definition

4.2 Market segment analysis

Market segments

4.3 Market size 2025

4.4 Market outlook: Forecast for 2025-2030

Chart on Global - Market size and forecast 2025-2030 ($ million)
Data Table on Global - Market size and forecast 2025-2030 ($ million)
Chart on Global Market: Year-over-year growth 2025-2030 (%)
Data Table on Global Market: Year-over-year growth 2025-2030 (%)

5. Historic Market Size

5.1 Global Sol-Gel Coatings Market 2020 - 2024

Historic Market Size - Data Table on Global Sol-Gel Coatings Market 2020 - 2024 ($ million)

5.2 Product segment analysis 2020 - 2024

Historic Market Size - Product Segment 2020 - 2024 ($ million)

5.3 Application segment analysis 2020 - 2024

Historic Market Size - Application Segment 2020 - 2024 ($ million)

5.4 Material segment analysis 2020 - 2024

Historic Market Size - Material Segment 2020 - 2024 ($ million)

5.5 Type segment analysis 2020 - 2024

Historic Market Size - Type Segment 2020 - 2024 ($ million)

5.6 Geography segment analysis 2020 - 2024

Historic Market Size - Geography Segment 2020 - 2024 ($ million)

5.7 Country segment analysis 2020 - 2024

Historic Market Size - Country Segment 2020 - 2024 ($ million)

6. Qualitative Analysis

6.1 Impact of AI on global sol-gel coatings market

6.2 Impact of geopolitical conflicts on global sol-gel coatings market

7. Five Forces Analysis

7.1 Five forces summary

Five forces analysis - Comparison between 2025 and 2030

7.2 Bargaining power of buyers

Bargaining power of buyers - Impact of key factors 2025 and 2030

7.3 Bargaining power of suppliers

Bargaining power of suppliers - Impact of key factors in 2025 and 2030

7.4 Threat of new entrants

Threat of new entrants - Impact of key factors in 2025 and 2030

7.5 Threat of substitutes

Threat of substitutes - Impact of key factors in 2025 and 2030

7.6 Threat of rivalry

Threat of rivalry - Impact of key factors in 2025 and 2030

7.7 Market condition

Chart on Market condition - Five forces 2025 and 2030

8. Market Segmentation by Product

8.1 Market segments

Chart on Product - Market share 2025-2030 (%)
Data Table on Product - Market share 2025-2030 (%)

8.2 Comparison by Product

Chart on Comparison by Product
Data Table on Comparison by Product

8.3 Wear resistant - Market size and forecast 2025-2030

Chart on Wear resistant - Market size and forecast 2025-2030 ($ million)
Data Table on Wear resistant - Market size and forecast 2025-2030 ($ million)
Chart on Wear resistant - Year-over-year growth 2025-2030 (%)
Data Table on Wear resistant - Year-over-year growth 2025-2030 (%)

8.4 Corrosion resistant - Market size and forecast 2025-2030

Chart on Corrosion resistant - Market size and forecast 2025-2030 ($ million)
Data Table on Corrosion resistant - Market size and forecast 2025-2030 ($ million)
Chart on Corrosion resistant - Year-over-year growth 2025-2030 (%)
Data Table on Corrosion resistant - Year-over-year growth 2025-2030 (%)

8.5 Water resistant - Market size and forecast 2025-2030

Chart on Water resistant - Market size and forecast 2025-2030 ($ million)
Data Table on Water resistant - Market size and forecast 2025-2030 ($ million)
Chart on Water resistant - Year-over-year growth 2025-2030 (%)
Data Table on Water resistant - Year-over-year growth 2025-2030 (%)

8.6 Photo catalytic self-cleaning - Market size and forecast 2025-2030

Chart on Photo catalytic self-cleaning - Market size and forecast 2025-2030 ($ million)
Data Table on Photo catalytic self-cleaning - Market size and forecast 2025-2030 ($ million)
Chart on Photo catalytic self-cleaning - Year-over-year growth 2025-2030 (%)
Data Table on Photo catalytic self-cleaning - Year-over-year growth 2025-2030 (%)

8.7 Others - Market size and forecast 2025-2030

Chart on Others - Market size and forecast 2025-2030 ($ million)
Data Table on Others - Market size and forecast 2025-2030 ($ million)
Chart on Others - Year-over-year growth 2025-2030 (%)
Data Table on Others - Year-over-year growth 2025-2030 (%)

8.8 Market opportunity by Product

Market opportunity by Product ($ million)
Data Table on Market opportunity by Product ($ million)

9. Market Segmentation by Application

9.1 Market segments

Chart on Application - Market share 2025-2030 (%)
Data Table on Application - Market share 2025-2030 (%)

9.2 Comparison by Application

Chart on Comparison by Application
Data Table on Comparison by Application

9.3 Automotive - Market size and forecast 2025-2030

Chart on Automotive - Market size and forecast 2025-2030 ($ million)
Data Table on Automotive - Market size and forecast 2025-2030 ($ million)
Chart on Automotive - Year-over-year growth 2025-2030 (%)
Data Table on Automotive - Year-over-year growth 2025-2030 (%)

9.4 Building and construction - Market size and forecast 2025-2030

Chart on Building and construction - Market size and forecast 2025-2030 ($ million)
Data Table on Building and construction - Market size and forecast 2025-2030 ($ million)
Chart on Building and construction - Year-over-year growth 2025-2030 (%)
Data Table on Building and construction - Year-over-year growth 2025-2030 (%)

9.5 Aerospace - Market size and forecast 2025-2030

Chart on Aerospace - Market size and forecast 2025-2030 ($ million)
Data Table on Aerospace - Market size and forecast 2025-2030 ($ million)
Chart on Aerospace - Year-over-year growth 2025-2030 (%)
Data Table on Aerospace - Year-over-year growth 2025-2030 (%)

9.6 Electrical and electronics - Market size and forecast 2025-2030

Chart on Electrical and electronics - Market size and forecast 2025-2030 ($ million)
Data Table on Electrical and electronics - Market size and forecast 2025-2030 ($ million)
Chart on Electrical and electronics - Year-over-year growth 2025-2030 (%)
Data Table on Electrical and electronics - Year-over-year growth 2025-2030 (%)

9.7 Others - Market size and forecast 2025-2030

Chart on Others - Market size and forecast 2025-2030 ($ million)
Data Table on Others - Market size and forecast 2025-2030 ($ million)
Chart on Others - Year-over-year growth 2025-2030 (%)
Data Table on Others - Year-over-year growth 2025-2030 (%)

9.8 Market opportunity by Application

Market opportunity by Application ($ million)
Data Table on Market opportunity by Application ($ million)

10. Market Segmentation by Material

10.1 Market segments

Chart on Material - Market share 2025-2030 (%)
Data Table on Material - Market share 2025-2030 (%)

10.2 Comparison by Material

Chart on Comparison by Material
Data Table on Comparison by Material

10.3 Silica-based - Market size and forecast 2025-2030

Chart on Silica-based - Market size and forecast 2025-2030 ($ million)
Data Table on Silica-based - Market size and forecast 2025-2030 ($ million)
Chart on Silica-based - Year-over-year growth 2025-2030 (%)
Data Table on Silica-based - Year-over-year growth 2025-2030 (%)

10.4 Hybrid organic-inorganic - Market size and forecast 2025-2030

Chart on Hybrid organic-inorganic - Market size and forecast 2025-2030 ($ million)
Data Table on Hybrid organic-inorganic - Market size and forecast 2025-2030 ($ million)
Chart on Hybrid organic-inorganic - Year-over-year growth 2025-2030 (%)
Data Table on Hybrid organic-inorganic - Year-over-year growth 2025-2030 (%)

10.5 Titania-based - Market size and forecast 2025-2030

Chart on Titania-based - Market size and forecast 2025-2030 ($ million)
Data Table on Titania-based - Market size and forecast 2025-2030 ($ million)
Chart on Titania-based - Year-over-year growth 2025-2030 (%)
Data Table on Titania-based - Year-over-year growth 2025-2030 (%)

10.6 Zirconia-based - Market size and forecast 2025-2030

Chart on Zirconia-based - Market size and forecast 2025-2030 ($ million)
Data Table on Zirconia-based - Market size and forecast 2025-2030 ($ million)
Chart on Zirconia-based - Year-over-year growth 2025-2030 (%)
Data Table on Zirconia-based - Year-over-year growth 2025-2030 (%)

10.7 Alumina-based - Market size and forecast 2025-2030

Chart on Alumina-based - Market size and forecast 2025-2030 ($ million)
Data Table on Alumina-based - Market size and forecast 2025-2030 ($ million)
Chart on Alumina-based - Year-over-year growth 2025-2030 (%)
Data Table on Alumina-based - Year-over-year growth 2025-2030 (%)

10.8 Market opportunity by Material

Market opportunity by Material ($ million)
Data Table on Market opportunity by Material ($ million)

11. Market Segmentation by Type

11.1 Market segments

Chart on Type - Market share 2025-2030 (%)
Data Table on Type - Market share 2025-2030 (%)

11.2 Comparison by Type

Chart on Comparison by Type
Data Table on Comparison by Type

11.3 Dip coating - Market size and forecast 2025-2030

Chart on Dip coating - Market size and forecast 2025-2030 ($ million)
Data Table on Dip coating - Market size and forecast 2025-2030 ($ million)
Chart on Dip coating - Year-over-year growth 2025-2030 (%)
Data Table on Dip coating - Year-over-year growth 2025-2030 (%)

11.4 Spray coating - Market size and forecast 2025-2030

Chart on Spray coating - Market size and forecast 2025-2030 ($ million)
Data Table on Spray coating - Market size and forecast 2025-2030 ($ million)
Chart on Spray coating - Year-over-year growth 2025-2030 (%)
Data Table on Spray coating - Year-over-year growth 2025-2030 (%)

11.5 Spin coating - Market size and forecast 2025-2030

Chart on Spin coating - Market size and forecast 2025-2030 ($ million)
Data Table on Spin coating - Market size and forecast 2025-2030 ($ million)
Chart on Spin coating - Year-over-year growth 2025-2030 (%)
Data Table on Spin coating - Year-over-year growth 2025-2030 (%)

11.6 Electrophoretic deposition - Market size and forecast 2025-2030

Chart on Electrophoretic deposition - Market size and forecast 2025-2030 ($ million)
Data Table on Electrophoretic deposition - Market size and forecast 2025-2030 ($ million)
Chart on Electrophoretic deposition - Year-over-year growth 2025-2030 (%)
Data Table on Electrophoretic deposition - Year-over-year growth 2025-2030 (%)

11.7 Others - Market size and forecast 2025-2030

Chart on Others - Market size and forecast 2025-2030 ($ million)
Data Table on Others - Market size and forecast 2025-2030 ($ million)
Chart on Others - Year-over-year growth 2025-2030 (%)
Data Table on Others - Year-over-year growth 2025-2030 (%)

11.8 Market opportunity by Type

Market opportunity by Type ($ million)
Data Table on Market opportunity by Type ($ million)

12. Customer Landscape

12.1 Customer landscape overview

Analysis of price sensitivity, lifecycle, customer purchase basket, adoption rates, and purchase criteria

13. Geographic Landscape

13.1 Geographic segmentation

Chart on Market share by geography 2025-2030 (%)
Data Table on Market share by geography 2025-2030 (%)

13.2 Geographic comparison

Chart on Geographic comparison
Data Table on Geographic comparison

13.3 North America - Market size and forecast 2025-2030

Chart on North America - Market size and forecast 2025-2030 ($ million)
Data Table on North America - Market size and forecast 2025-2030 ($ million)
Chart on North America - Year-over-year growth 2025-2030 (%)
Data Table on North America - Year-over-year growth 2025-2030 (%)
Chart on Regional Comparison - North America
Data Table on Regional Comparison - North America

13.3.1 US - Market size and forecast 2025-2030

Chart on US - Market size and forecast 2025-2030 ($ million)
Data Table on US - Market size and forecast 2025-2030 ($ million)
Chart on US - Year-over-year growth 2025-2030 (%)
Data Table on US - Year-over-year growth 2025-2030 (%)

13.3.2 Canada - Market size and forecast 2025-2030

Chart on Canada - Market size and forecast 2025-2030 ($ million)
Data Table on Canada - Market size and forecast 2025-2030 ($ million)
Chart on Canada - Year-over-year growth 2025-2030 (%)
Data Table on Canada - Year-over-year growth 2025-2030 (%)

13.3.3 Mexico - Market size and forecast 2025-2030

Chart on Mexico - Market size and forecast 2025-2030 ($ million)
Data Table on Mexico - Market size and forecast 2025-2030 ($ million)
Chart on Mexico - Year-over-year growth 2025-2030 (%)
Data Table on Mexico - Year-over-year growth 2025-2030 (%)

13.4 Europe - Market size and forecast 2025-2030

Chart on Europe - Market size and forecast 2025-2030 ($ million)
Data Table on Europe - Market size and forecast 2025-2030 ($ million)
Chart on Europe - Year-over-year growth 2025-2030 (%)
Data Table on Europe - Year-over-year growth 2025-2030 (%)
Chart on Regional Comparison - Europe
Data Table on Regional Comparison - Europe

13.4.1 Germany - Market size and forecast 2025-2030

Chart on Germany - Market size and forecast 2025-2030 ($ million)
Data Table on Germany - Market size and forecast 2025-2030 ($ million)
Chart on Germany - Year-over-year growth 2025-2030 (%)
Data Table on Germany - Year-over-year growth 2025-2030 (%)

13.4.2 UK - Market size and forecast 2025-2030

Chart on UK - Market size and forecast 2025-2030 ($ million)
Data Table on UK - Market size and forecast 2025-2030 ($ million)
Chart on UK - Year-over-year growth 2025-2030 (%)
Data Table on UK - Year-over-year growth 2025-2030 (%)

13.4.3 France - Market size and forecast 2025-2030

Chart on France - Market size and forecast 2025-2030 ($ million)
Data Table on France - Market size and forecast 2025-2030 ($ million)
Chart on France - Year-over-year growth 2025-2030 (%)
Data Table on France - Year-over-year growth 2025-2030 (%)

13.4.4 Italy - Market size and forecast 2025-2030

Chart on Italy - Market size and forecast 2025-2030 ($ million)
Data Table on Italy - Market size and forecast 2025-2030 ($ million)
Chart on Italy - Year-over-year growth 2025-2030 (%)
Data Table on Italy - Year-over-year growth 2025-2030 (%)

13.4.5 Spain - Market size and forecast 2025-2030

Chart on Spain - Market size and forecast 2025-2030 ($ million)
Data Table on Spain - Market size and forecast 2025-2030 ($ million)
Chart on Spain - Year-over-year growth 2025-2030 (%)
Data Table on Spain - Year-over-year growth 2025-2030 (%)

13.4.6 The Netherlands - Market size and forecast 2025-2030

Chart on The Netherlands - Market size and forecast 2025-2030 ($ million)
Data Table on The Netherlands - Market size and forecast 2025-2030 ($ million)
Chart on The Netherlands - Year-over-year growth 2025-2030 (%)
Data Table on The Netherlands - Year-over-year growth 2025-2030 (%)

13.5 APAC - Market size and forecast 2025-2030

Chart on APAC - Market size and forecast 2025-2030 ($ million)
Data Table on APAC - Market size and forecast 2025-2030 ($ million)
Chart on APAC - Year-over-year growth 2025-2030 (%)
Data Table on APAC - Year-over-year growth 2025-2030 (%)
Chart on Regional Comparison - APAC
Data Table on Regional Comparison - APAC

13.5.1 China - Market size and forecast 2025-2030

Chart on China - Market size and forecast 2025-2030 ($ million)
Data Table on China - Market size and forecast 2025-2030 ($ million)
Chart on China - Year-over-year growth 2025-2030 (%)
Data Table on China - Year-over-year growth 2025-2030 (%)

13.5.2 Japan - Market size and forecast 2025-2030

Chart on Japan - Market size and forecast 2025-2030 ($ million)
Data Table on Japan - Market size and forecast 2025-2030 ($ million)
Chart on Japan - Year-over-year growth 2025-2030 (%)
Data Table on Japan - Year-over-year growth 2025-2030 (%)

13.5.3 India - Market size and forecast 2025-2030

Chart on India - Market size and forecast 2025-2030 ($ million)
Data Table on India - Market size and forecast 2025-2030 ($ million)
Chart on India - Year-over-year growth 2025-2030 (%)
Data Table on India - Year-over-year growth 2025-2030 (%)

13.5.4 South Korea - Market size and forecast 2025-2030

Chart on South Korea - Market size and forecast 2025-2030 ($ million)
Data Table on South Korea - Market size and forecast 2025-2030 ($ million)
Chart on South Korea - Year-over-year growth 2025-2030 (%)
Data Table on South Korea - Year-over-year growth 2025-2030 (%)

13.5.5 Australia - Market size and forecast 2025-2030

Chart on Australia - Market size and forecast 2025-2030 ($ million)
Data Table on Australia - Market size and forecast 2025-2030 ($ million)
Chart on Australia - Year-over-year growth 2025-2030 (%)
Data Table on Australia - Year-over-year growth 2025-2030 (%)

13.5.6 Indonesia - Market size and forecast 2025-2030

Chart on Indonesia - Market size and forecast 2025-2030 ($ million)
Data Table on Indonesia - Market size and forecast 2025-2030 ($ million)
Chart on Indonesia - Year-over-year growth 2025-2030 (%)
Data Table on Indonesia - Year-over-year growth 2025-2030 (%)

13.6 Middle East and Africa - Market size and forecast 2025-2030

Chart on Middle East and Africa - Market size and forecast 2025-2030 ($ million)
Data Table on Middle East and Africa - Market size and forecast 2025-2030 ($ million)
Chart on Middle East and Africa - Year-over-year growth 2025-2030 (%)
Data Table on Middle East and Africa - Year-over-year growth 2025-2030 (%)
Chart on Regional Comparison - Middle East and Africa
Data Table on Regional Comparison - Middle East and Africa

13.6.1 Saudi Arabia - Market size and forecast 2025-2030

Chart on Saudi Arabia - Market size and forecast 2025-2030 ($ million)
Data Table on Saudi Arabia - Market size and forecast 2025-2030 ($ million)
Chart on Saudi Arabia - Year-over-year growth 2025-2030 (%)
Data Table on Saudi Arabia - Year-over-year growth 2025-2030 (%)

13.6.2 UAE - Market size and forecast 2025-2030

Chart on UAE - Market size and forecast 2025-2030 ($ million)
Data Table on UAE - Market size and forecast 2025-2030 ($ million)
Chart on UAE - Year-over-year growth 2025-2030 (%)
Data Table on UAE - Year-over-year growth 2025-2030 (%)

13.6.3 South Africa - Market size and forecast 2025-2030

Chart on South Africa - Market size and forecast 2025-2030 ($ million)
Data Table on South Africa - Market size and forecast 2025-2030 ($ million)
Chart on South Africa - Year-over-year growth 2025-2030 (%)
Data Table on South Africa - Year-over-year growth 2025-2030 (%)

13.6.4 Turkey - Market size and forecast 2025-2030

Chart on Turkey - Market size and forecast 2025-2030 ($ million)
Data Table on Turkey - Market size and forecast 2025-2030 ($ million)
Chart on Turkey - Year-over-year growth 2025-2030 (%)
Data Table on Turkey - Year-over-year growth 2025-2030 (%)

13.6.5 Israel - Market size and forecast 2025-2030

Chart on Israel - Market size and forecast 2025-2030 ($ million)
Data Table on Israel - Market size and forecast 2025-2030 ($ million)
Chart on Israel - Year-over-year growth 2025-2030 (%)
Data Table on Israel - Year-over-year growth 2025-2030 (%)

13.7 South America - Market size and forecast 2025-2030

Chart on South America - Market size and forecast 2025-2030 ($ million)
Data Table on South America - Market size and forecast 2025-2030 ($ million)
Chart on South America - Year-over-year growth 2025-2030 (%)
Data Table on South America - Year-over-year growth 2025-2030 (%)
Chart on Regional Comparison - South America
Data Table on Regional Comparison - South America

13.7.1 Brazil - Market size and forecast 2025-2030

Chart on Brazil - Market size and forecast 2025-2030 ($ million)
Data Table on Brazil - Market size and forecast 2025-2030 ($ million)
Chart on Brazil - Year-over-year growth 2025-2030 (%)
Data Table on Brazil - Year-over-year growth 2025-2030 (%)

13.7.2 Argentina - Market size and forecast 2025-2030

Chart on Argentina - Market size and forecast 2025-2030 ($ million)
Data Table on Argentina - Market size and forecast 2025-2030 ($ million)
Chart on Argentina - Year-over-year growth 2025-2030 (%)
Data Table on Argentina - Year-over-year growth 2025-2030 (%)

13.7.3 Chile - Market size and forecast 2025-2030

Chart on Chile - Market size and forecast 2025-2030 ($ million)
Data Table on Chile - Market size and forecast 2025-2030 ($ million)
Chart on Chile - Year-over-year growth 2025-2030 (%)
Data Table on Chile - Year-over-year growth 2025-2030 (%)

13.8 Market opportunity by geography

Market opportunity by geography ($ million)
Data Tables on Market opportunity by geography ($ million)

14. Drivers, Challenges, and Opportunity

14.1 Market drivers

Tightening global regulations against hazardous hexavalent chromium
Rising demand for multifunctional smart surface properties
Rapid expansion of renewable energy infrastructure networks

14.2 Market challenges

High thermal curing expenditures and scale constraints
Precursor solution instability and short shelf life
Interfacial stress and film cracking limitations

14.3 Impact of drivers and challenges

Impact of drivers and challenges in 2025 and 2030

14.4 Market opportunities

Shift toward nanostructured hybrid organic inorganic formulations
Integration of stimuli-responsive self-healing corrosion inhibitors
Adoption of waterborne formulations for sustainable manufacturing

15. Competitive Landscape

15.1 Overview

15.2

Overview on criticality of inputs and factors of differentiation

15.3 Landscape disruption

Overview on factors of disruption

15.4 Industry risks

Impact of key risks on business

16. Competitive Analysis

16.1 Companies profiled

Companies covered

16.2 Company ranking index

16.3 Market positioning of companies

Matrix on companies position and classification

16.4 3M Co.

3M Co. - Overview
3M Co. - Business segments
3M Co. - Key news
3M Co. - Key offerings
3M Co. - Segment focus
SWOT

16.5 Akzo Nobel NV

Akzo Nobel NV - Overview
Akzo Nobel NV - Business segments
Akzo Nobel NV - Key offerings
Akzo Nobel NV - Segment focus
SWOT

16.6 Axalta Coating Systems Ltd.

Axalta Coating Systems Ltd. - Overview
Axalta Coating Systems Ltd. - Business segments
Axalta Coating Systems Ltd. - Key offerings
Axalta Coating Systems Ltd. - Segment focus
SWOT

16.7 BASF SE

BASF SE - Overview
BASF SE - Business segments
BASF SE - Key news
BASF SE - Key offerings
BASF SE - Segment focus
SWOT

16.8 Compagnie de Saint Gobain SA

Compagnie de Saint Gobain SA - Overview
Compagnie de Saint Gobain SA - Business segments
Compagnie de Saint Gobain SA - Key offerings
Compagnie de Saint Gobain SA - Segment focus
SWOT

16.9 DuPont de Nemours Inc.

DuPont de Nemours Inc. - Overview
DuPont de Nemours Inc. - Business segments
DuPont de Nemours Inc. - Key news
DuPont de Nemours Inc. - Key offerings
DuPont de Nemours Inc. - Segment focus
SWOT

16.10 Henkel AG and Co. KGaA

Henkel AG and Co. KGaA - Overview
Henkel AG and Co. KGaA - Business segments
Henkel AG and Co. KGaA - Key offerings
Henkel AG and Co. KGaA - Segment focus
SWOT

16.11 Mitsubishi Materials Corp.

Mitsubishi Materials Corp. - Overview
Mitsubishi Materials Corp. - Business segments
Mitsubishi Materials Corp. - Key offerings
Mitsubishi Materials Corp. - Segment focus
SWOT

16.12 Nanovations Pty Ltd.

Nanovations Pty Ltd. - Overview
Nanovations Pty Ltd. - Product / Service
Nanovations Pty Ltd. - Key offerings
SWOT

16.13 PPG Industries Inc.

PPG Industries Inc. - Overview
PPG Industries Inc. - Business segments
PPG Industries Inc. - Key offerings
PPG Industries Inc. - Segment focus
SWOT

16.14 SCHOTT AG

SCHOTT AG - Overview
SCHOTT AG - Product / Service
SCHOTT AG - Key offerings
SWOT

16.15 Socomore S.A.

Socomore S.A. - Overview
Socomore S.A. - Product / Service
Socomore S.A. - Key offerings
SWOT

16.16 Solvay SA

Solvay SA - Overview
Solvay SA - Business segments
Solvay SA - Key offerings
Solvay SA - Segment focus
SWOT

16.17 The Sherwin Williams Co.

The Sherwin Williams Co. - Overview
The Sherwin Williams Co. - Business segments
The Sherwin Williams Co. - Key offerings
The Sherwin Williams Co. - Segment focus
SWOT

16.18 Vibrantz Technologies

Vibrantz Technologies - Overview
Vibrantz Technologies - Product / Service
Vibrantz Technologies - Key offerings
SWOT

17. Appendix

17.1 Scope of the report

Market definition
Objectives
Notes and caveats

17.2 Inclusions and exclusions checklist

Inclusions checklist
Exclusions checklist

17.3 Currency conversion rates for US$

17.4 Research methodology

17.5 Data procurement

Information sources

17.6 Data validation

17.7 Validation techniques employed for market sizing

17.8 Data synthesis

17.9 360 degree market analysis

17.10 List of abbreviations

Research Methodology

Technavio presents a detailed picture of the market by way of study, synthesis, and summation of data from multiple sources. The analysts have presented the various facets of the market with a particular focus on identifying the key industry influencers. The data thus presented is comprehensive, reliable, and the result of extensive research, both primary and secondary.

INFORMATION SOURCES

Primary sources

  • Manufacturers and suppliers
  • Channel partners
  • Industry experts
  • Strategic decision makers

Secondary sources

  • Industry journals and periodicals
  • Government data
  • Financial reports of key industry players
  • Historical data
  • Press releases

DATA ANALYSIS

Data Synthesis

  • Collation of data
  • Estimation of key figures
  • Analysis of derived insights

Data Validation

  • Triangulation with data models
  • Reference against proprietary databases
  • Corroboration with industry experts

REPORT WRITING

Qualitative

  • Market drivers
  • Market challenges
  • Market trends
  • Five forces analysis

Quantitative

  • Market size and forecast
  • Market segmentation
  • Geographical insights
  • Competitive landscape

Interested in this report?

Get your sample now to see our research methodology and insights!

Download Now

Frequently Asked Questions

Sol-Gel Coatings market growth will increase by USD 6332.1 million during 2026-2030.

The Sol-Gel Coatings market is expected to grow at a CAGR of 14.1% during 2026-2030.

Sol-Gel Coatings market is segmented by Product (Wear resistant, Corrosion resistant, Water resistant, Photo catalytic self-cleaning, Others) Application (Automotive, Building and construction, Aerospace, Electrical and electronics, Others) Material (Silica-based, Hybrid organic-inorganic, Titania-based, Zirconia-based, Alumina-based) Type (Dip coating, Spray coating, Spin coating, Electrophoretic deposition, Others)

3M Co., Akzo Nobel NV, Axalta Coating Systems Ltd., BASF SE, Compagnie de Saint Gobain SA, DuPont de Nemours Inc., Henkel AG and Co. KGaA, Mitsubishi Materials Corp., Nanovations Pty Ltd., Optimum Polymer Technologies, PPG Industries Inc., SCHOTT AG, Socomore S.A., Solvay SA, The Sherwin Williams Co., Vibrantz Technologies are a few of the key vendors in the Sol-Gel Coatings market.

North America will register the highest growth rate of 34.4% among the other regions. Therefore, the Sol-Gel Coatings market in North America is expected to garner significant business opportunities for the vendors during the forecast period.

US, Canada, Mexico, Germany, UK, France, Italy, Spain, The Netherlands, China, Japan, India, South Korea, Australia, Indonesia, Saudi Arabia, UAE, South Africa, Turkey, Israel, Brazil, Argentina, Chile

  • Tightening global regulations against hazardous hexavalent chromium is the driving factor this market.

The Sol-Gel Coatings market vendors should focus on grabbing business opportunities from the Product segment as it accounted for the largest market share in the base year.
RIA - Research AI Assistant
Ask RIA
