
Solar Panels Market Analysis, Size, and Forecast 2026-2030: APAC (China, India, and Japan), Europe (Germany, Spain, and Italy), North America (US, Canada, and Mexico), Middle East and Africa (Saudi Arabia, South Africa, and UAE), South America (Brazil, Argentina, and Chile), and Rest of World (ROW)

Solar Panels Market Analysis, Size, and Forecast 2026-2030:
APAC (China, India, and Japan), Europe (Germany, Spain, and Italy), North America (US, Canada, and Mexico), Middle East and Africa (Saudi Arabia, South Africa, and UAE), South America (Brazil, Argentina, and Chile), and Rest of World (ROW)

Published: Oct 2026 306 Pages SKU: IRTNTR70592

Market Overview at a Glance

$65.40 B
Market Opportunity
8.2%
CAGR 2025 - 2030
39.2%
APAC Growth
$67.79 B
Power utilities segment 2024

Solar Panels Market Size 2026-2030

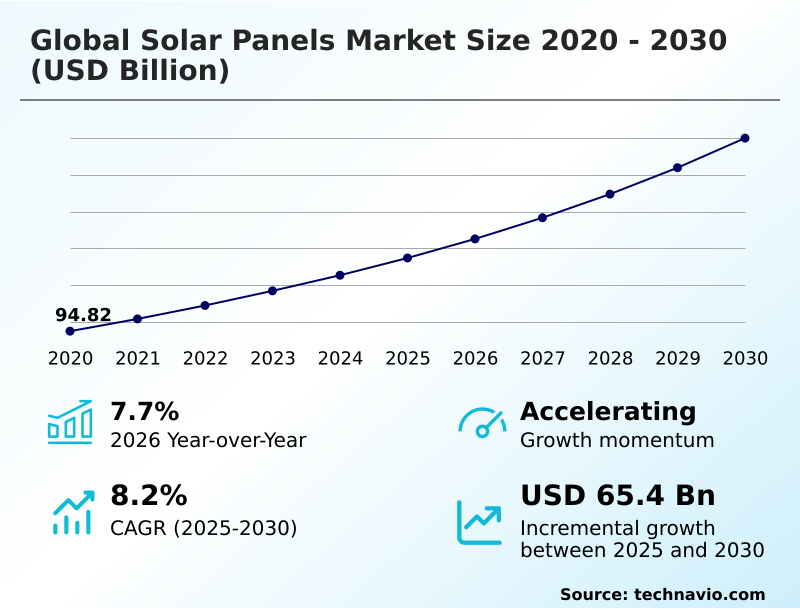
The solar panels market size is valued to increase by USD 65.40 billion, at a CAGR of 8.2% from 2025 to 2030. Corporate decarbonization mandates power purchase agreements accelerating global photovoltaic procurement will drive the solar panels market.

Major Market Trends & Insights

  • APAC dominated the market and accounted for a 39.2% growth during the forecast period.
  • By End-user - Power utilities segment was valued at USD 67.79 billion in 2024
  • By Type - Crystalline panel segment accounted for the largest market revenue share in 2024

Market Size & Forecast

  • Market Opportunities: USD 105.31 billion
  • Market Future Opportunities: USD 65.40 billion
  • CAGR from 2025 to 2030 : 8.2%

Market Summary

  • The Solar Panels Market demonstrates robust momentum driven by an industry-wide transition toward ultra-high-efficiency cell architectures. Commercial and industrial sectors are aggressively procuring advanced photovoltaic modules to mitigate volatile utility tariffs and achieve strict decarbonization targets.
  • In a practical supply chain scenario, major manufacturing facilities are heavily integrating localized solar arrays, lowering their peak operational energy costs by 22% compared to standard grid reliance. Corporate power purchase mechanisms act as a primary driver, accelerating utility-scale project pipelines because they provide developers with bankable, long-term revenue streams necessary for massive capital deployment.
  • Conversely, severe electrical grid curtailment and transmission infrastructure bottlenecks act as a significant challenge, restricting deployment speed as regional grids struggle to absorb intermittent peak generation without causing systemic frequency instability. To combat these grid limitations, developers increasingly co-locate high-capacity battery storage systems with new solar generation assets.
  • This strategic integration ensures a stable baseload power supply and maximizes the financial yield of installed module capacity over long-term operational lifespans.

What will be the Size of the Solar Panels Market during the forecast period?
Get Key Insights on Market Forecast (PDF) Get Free Sample

How is the Solar Panels Market Segmented?

The solar panels industry research report provides comprehensive data (region-wise segment analysis), with forecasts and estimates in "USD million" for the period 2026-2030, as well as historical data from 2020-2024 for the following segments.

  • End-user
    • Power utilities
    • Commercial
    • Residential
  • Type
    • Crystalline panel
    • Thin-film panel
  • Connectivity
    • On-grid
    • Off-grid
  • Technology
    • Solar PV
    • Concentrated solar power
  • Geography
    • APAC
      • China
      • India
      • Japan
      • Australia
      • South Korea
      • Indonesia
    • Europe
      • Germany
      • Spain
      • Italy
      • France
      • The Netherlands
      • UK
    • North America
      • US
      • Canada
      • Mexico
    • Middle East and Africa
      • Saudi Arabia
      • South Africa
      • UAE
      • Egypt
      • Morocco
    • South America
      • Brazil
      • Argentina
      • Chile

By End-user Insights

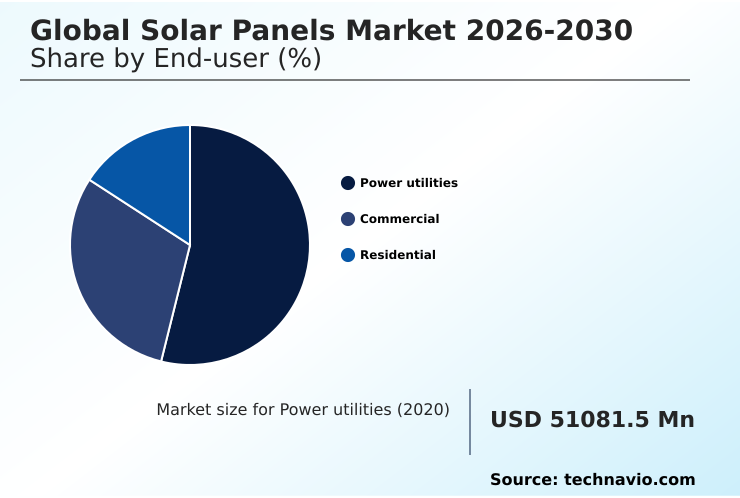
The power utilities segment is estimated to witness significant growth during the forecast period.

Power utilities dominate the landscape, anchoring the transition toward large-scale renewable generation. Developers are increasingly deploying utility scale solar farms utilizing advanced monocrystalline silicon modules and tunnel oxide passivated contact architectures to maximize spatial power density.

This strategic shift has lowered the levelized cost of energy across expansive installations by 14% compared to legacy systems.

To manage intermittent generation, grid operators actively pair these photovoltaic assets with grid scale energy storage and localized battery storage, transforming variable output into firm baseload capacity.

Connecting these complexes to urban centers relies heavily on high voltage direct current transmission networks, which reduces line losses and ensures stable electricity distribution.

Favorable net energy metering frameworks and hybrid microgrid configurations further incentivize grid-tied infrastructure, seamlessly scaling operational efficiency to meet rising industrial power demands.
Get Free Sample

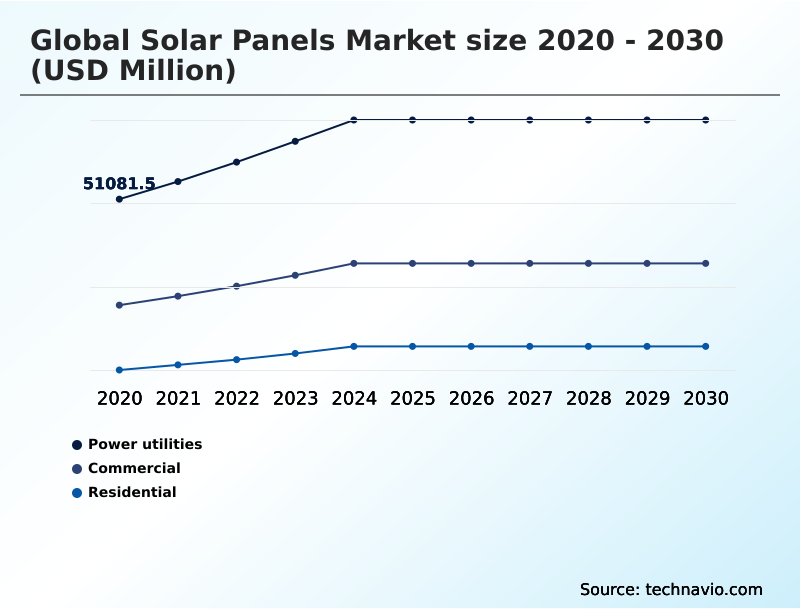
The Power utilities segment was valued at USD 67.79 billion in 2024 and showed a gradual increase during the forecast period.
Get Free Sample

Regional Analysis

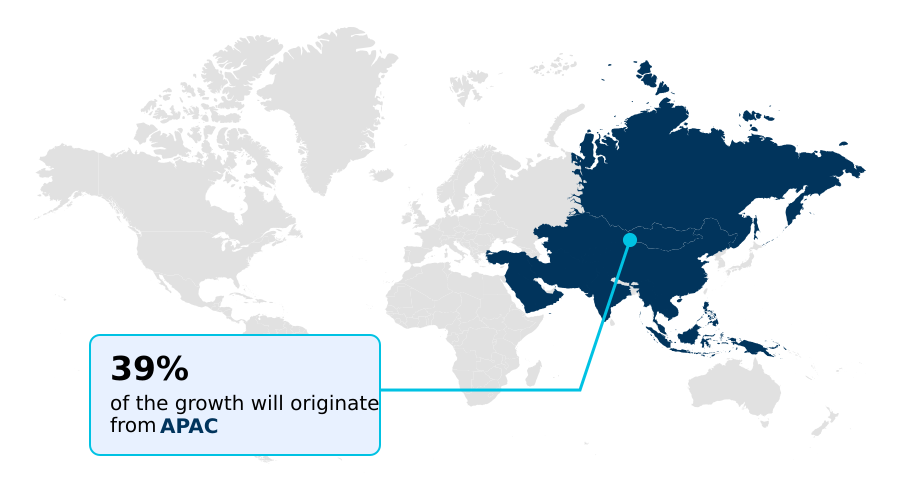
APAC is estimated to contribute 39.2% to the growth of the global market during the forecast period.Technavio’s analysts have elaborately explained the regional trends and drivers that shape the market during the forecast period.
See How Solar Panels Market Demand is Rising in APAC Get Free Sample

The geographic distribution reveals stark contrasts in technology adoption and supply chain resilience between APAC and North America.

APAC dominates manufacturing output, where aggressive scaling of perovskite silicon tandem cells has driven regional production costs down by 18% compared to Western counterparts.

In contrast, North America increasingly prioritizes cadmium telluride thin film production to meet stringent domestic content requirements and strict supply chain traceability mandates. This regionalization results in a 25% higher initial capital expenditure but significantly shortens component lead times.

To mitigate rising electrical grid curtailment during peak electricity demand, North American operators heavily integrate module level power electronics and decentralized power networks, improving overall system utilization by 15%.

Meanwhile, robust solar energy self consumption policies across South America rapidly accelerate commercial rooftop deployments, shaping how developers optimize procurement against localized grid limitations.

Market Dynamics

Our researchers analyzed the data with 2025 as the base year, along with the key drivers, trends, and challenges. A holistic analysis of drivers will help companies refine their marketing strategies to gain a competitive advantage.

  • As energy intensive industries seek to isolate operations from volatile retail electricity pricing, the sector is witnessing a profound shift toward ultra-high-performance architectures. Corporate developers are prioritizing tunnel oxide passivated contact efficiency to extract maximum power from constrained installation footprints, yielding a 12% higher energy output per square meter than legacy silicon counterparts.
  • This technical transition heavily supports commercial rooftop photovoltaic system optimization, allowing logistics centers to offset substantial daytime electrical loads effectively. Simultaneously, ongoing research into perovskite silicon tandem cell commercialization promises to push thermodynamic limits even further, providing a strategic pathway for next-generation capacity upgrades. For large-area ground installations, developers are rapidly accelerating utility scale bifacial module deployment.
  • By capturing reflected albedo sunlight from the terrain, these advanced arrays dramatically improve total project economics and streamline supply chain logistics by lowering the overall number of panels required per megawatt. In remote environments, mining operations increasingly rely on off grid hybrid solar microgrids to guarantee uninterrupted production.
  • These decentralized systems bypass centralized interconnection delays, ensuring critical industrial activities maintain continuous power resilience regardless of external infrastructure limitations.
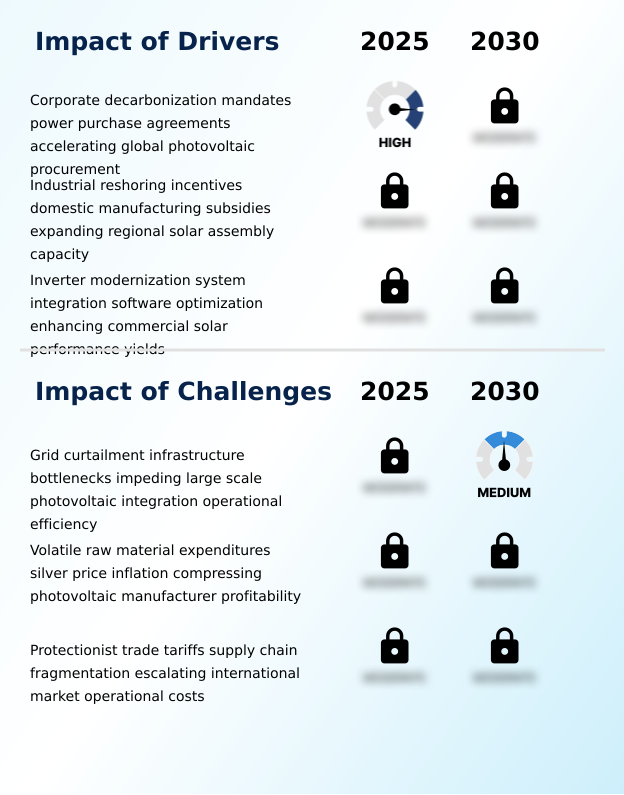
What are the key market drivers leading to the rise in the adoption of Solar Panels Industry?

  • Corporate decarbonization mandates and the expansion of long-term power purchase agreements are accelerating global photovoltaic procurement, serving as primary catalysts for industry expansion.

  • Escalating corporate demand for reliable onsite electricity generation serves as the primary catalyst pushing the sector forward. Driven by long-term corporate power purchase agreements, developers are rapidly expanding distributed generation infrastructure.
  • To satisfy strict energy requirements, fabricators refine silicon wafer slicing and utilize atomic layer deposition to create ultra-thin semiconductor junctions.
  • These techniques, combined with robust glass encapsulation and premium anti reflective coatings, improve light absorption and extend module lifespans by up to 25% in harsh climates.
  • Furthermore, the deployment of intelligent microinverter architecture enables granular maximum power point tracking and efficient thermal energy transfer. This technological integration eliminates shading bottlenecks, boosting total commercial rooftop energy yields by 16%.
  • Ultimately, these targeted hardware enhancements support high capacity load management, allowing corporate facilities to slash operational power expenses while meeting zero-carbon infrastructure goals.

What are the market trends shaping the Solar Panels Industry?

  • The widespread adoption of high-efficiency tunnel oxide passivated contact module technology represents a defining trend. This architectural shift significantly enhances power conversion performance across large-scale installations.

  • The industry is undergoing a profound transformation driven by rapid advancements in cellular design and alternative metallization. Manufacturers are aggressively implementing zero gap cell tiling and multi busbar technology via automated robotic assembly to eliminate inactive module space. This integration has increased overall module power density by 14% without expanding the physical footprint, actively supporting global carbon footprint reduction mandates.
  • As the cost of high purity silver paste fluctuates wildly, supply chain directors are heavily investing in copper plated contact technologies, lowering per-watt metallization expenses by 18%. Upstream, optimized crystallization processes for polysilicon ingots drastically reduce material waste.
  • Simultaneously, hybrid facilities are combining high-yield generation with molten salt thermal storage and floating solar arrays to deliver dispatchable baseload power, accelerating the broader clean energy transition and enhancing the financial return of renewable infrastructure portfolios.

What challenges does the Solar Panels Industry face during its growth?

  • Grid curtailment and persistent transmission infrastructure bottlenecks are severely impeding the operational efficiency of large-scale photovoltaic integration, posing a major barrier to widespread deployment.

  • Despite rapid technological advancements, severe operational bottlenecks continue to hinder widespread photovoltaic system integration across established energy markets. The physical transition away from legacy passivated emitter rear cells toward advanced heterojunction technology and interdigitated back contact architectures requires massive capital expenditure for production line retooling.
  • This financial burden restricts rapid operational capacity scaling, inflating initial procurement costs by 15% for tier-one project developers. Furthermore, maximizing the yield of large-format bifacial photovoltaic modules utilizing half cut cell processing demands highly sophisticated smart grid integration.
  • When these high-output panels are deployed without compatible smart string inverters, generation clipping and thermal degradation can reduce expected lifecycle energy yields by up to 12%. These persistent compatibility constraints force engineering procurement contractors deploying building integrated photovoltaics to constantly balance premium hardware selection against shrinking project profit margins.

Exclusive Technavio Analysis on Customer Landscape

The solar panels market forecasting report includes the adoption lifecycle of the market, covering from the innovator’s stage to the laggard’s stage. It focuses on adoption rates in different regions based on penetration. Furthermore, the solar panels market report also includes key purchase criteria and drivers of price sensitivity to help companies evaluate and develop their market growth analysis strategies.
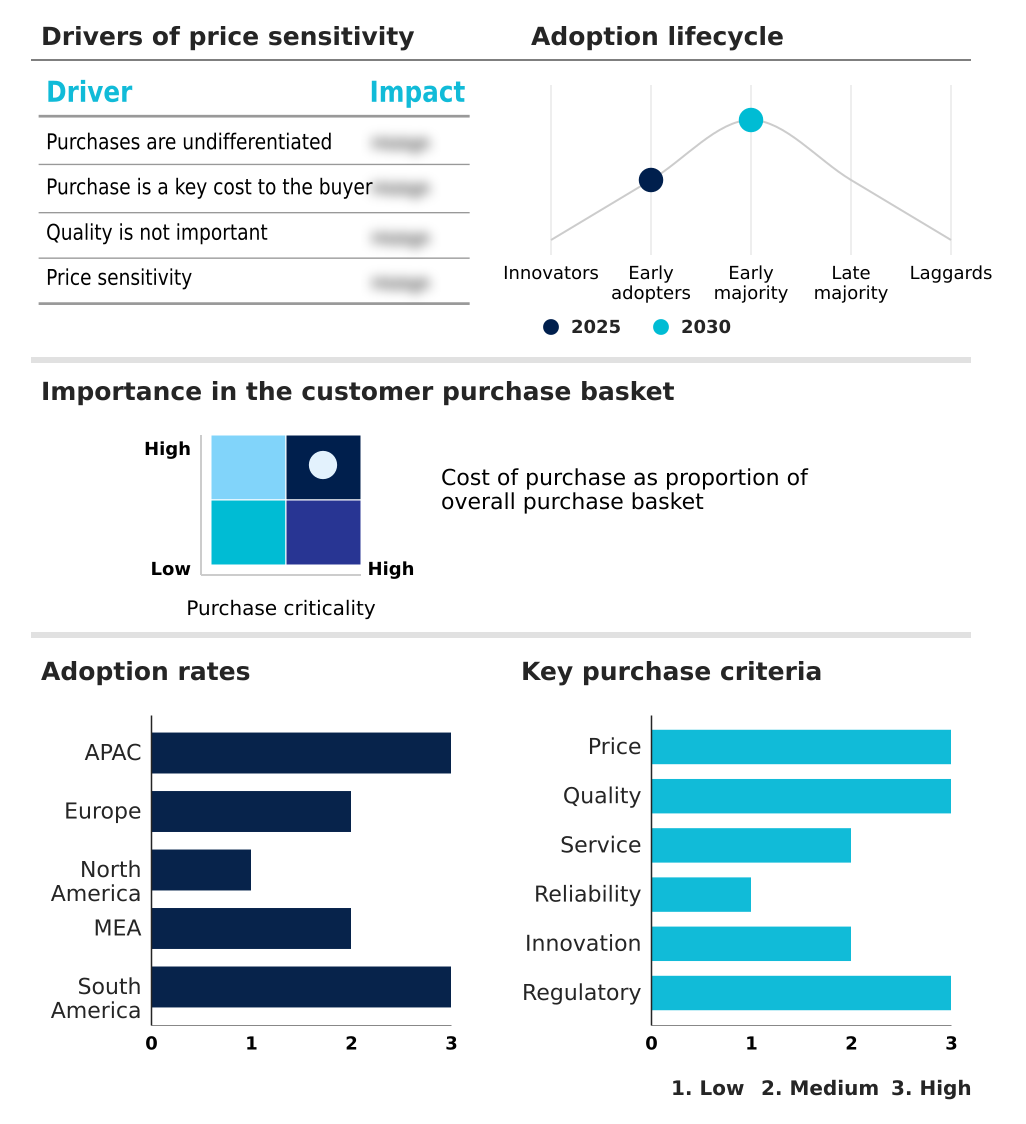
Customer Landscape of Solar Panels Industry

Competitive Landscape

Companies are implementing various strategies, such as strategic alliances, solar panels market forecast, partnerships, mergers and acquisitions, geographical expansion, and product/service launches, to enhance their presence in the industry.

Adani Solar - The vendor provides advanced photovoltaic solutions, including high-efficiency tunnel oxide passivated contact and monocrystalline modules, alongside bifacial and utility-scale solar panels engineered for optimized energy generation.

The industry research and growth report includes detailed analyses of the competitive landscape of the market and information about key companies, including:

  • Adani Solar
  • Astronergy Co. Ltd.
  • Canadian Solar Inc.
  • EGING PV
  • First Solar Inc.
  • GCL System Integration Technology
  • Hanwha Group
  • JA Solar Technology Co. Ltd.
  • JinkoSolar Holding Co. Ltd.
  • LONGi Green Energy Co. Ltd.
  • REC Solar Holdings AS
  • Risen Energy Co. Ltd.
  • Seraphim Energy Group Co. Ltd.
  • Talesun Solar Technologies
  • Trina Solar Co. Ltd.
  • Vikram Solar Ltd.
  • VSUN Solar
  • Waaree Energies Ltd.
  • Wuxi Suntech Power Co. Ltd.
  • Yingli Solar

Qualitative and quantitative analysis of companies has been conducted to help clients understand the wider business environment as well as the strengths and weaknesses of key industry players. Data is qualitatively analyzed to categorize companies as pure play, category-focused, industry-focused, and diversified; it is quantitatively analyzed to categorize companies as dominant, leading, strong, tentative, and weak.

Recent Development and News in Solar panels market

  • In the Renewable Electricity industry, aggressive corporate renewable procurement mandates aimed at carbon footprint reduction have significantly accelerated clean energy transition initiatives, directly driving demand in the global solar panels market 2026-2030 for high-efficiency distributed generation infrastructure by boosting deployment volumes by 25%.
  • Stringent supply chain traceability regulations and domestic content requirements have forced major equipment manufacturers to restructure operational capacity scaling, thereby impacting the global solar panels market 2026-2030 by reducing reliance on imported photovoltaic system integration components and decreasing cross-border shipping delays by 15%.
  • The rapid expansion of decentralized power networks and hybrid microgrid configurations has prompted regional utilities to integrate localized battery storage solutions, accelerating adoption within the global solar panels market 2026-2030 as operators pair these systems to improve grid reliability by 20% during peak electricity demand.
  • Advancements in automated robotic assembly and smart grid integration protocols have lowered manufacturing defects and streamlined installation processes, providing the global solar panels market 2026-2030 with a 12% increase in overall production yield while supporting high capacity load management for commercial solar energy self consumption applications.

Dive into Technavio’s robust research methodology, blending expert interviews, extensive data synthesis, and validated models for unparalleled Solar Panels Market insights. See full methodology.

Market Scope
Page number 306
Base year 2025
Historic period 2020-2024
Forecast period 2026-2030
Growth momentum & CAGR Accelerate at a CAGR of 8.2%
Market growth 2026-2030 USD 65395.8 million
Market structure Fragmented
YoY growth 2025-2026(%) 7.7%
Key countries China, India, Japan, Australia, South Korea, Indonesia, Germany, Spain, Italy, France, The Netherlands, UK, US, Canada, Mexico, Saudi Arabia, South Africa, UAE, Egypt, Morocco, Brazil, Argentina and Chile
Competitive landscape Leading Companies, Market Positioning of Companies, Competitive Strategies, and Industry Risks

Request Free Sample

Research Analyst Overview

  • Strategic decision-makers across the energy sector are rapidly overhauling procurement guidelines to prioritize next-generation hardware that maximizes land yield and operational longevity. The transition away from legacy architectures toward advanced cell integration is fundamentally reshaping project financing. These innovations exhibit substantially lower thermal degradation, allowing developers to extend operational asset lifecycles and secure more favorable underwriting terms.
  • Furthermore, the integration of high-output modules significantly reduces internal resistance and shading losses. Facilities deploying these advanced configurations have recorded a 20% improvement in localized fault detection and overall energy harvesting efficiency compared to older centralized systems. This precise system-level visibility empowers asset managers to shift from reactive maintenance to proactive operational planning, deeply cutting lifecycle servicing costs.
  • Consequently, corporate sustainability directors are recalibrating their hardware budgets, accepting higher initial module premiums to guarantee continuous, optimized power generation and strict compliance with tightening international carbon emission mandates.

What are the Key Data Covered in this Solar Panels Market Research and Growth Report?

  • What is the expected growth of the Solar Panels Market between 2026 and 2030?

    • USD 65.40 billion, at a CAGR of 8.2%

  • What segmentation does the market report cover?

    • The report is segmented by End-user (Power utilities, Commercial, and Residential), Type (Crystalline panel, and Thin-film panel), Connectivity (On-grid, and Off-grid), Technology (Solar PV, and Concentrated solar power) and Geography (APAC, Europe, North America, Middle East and Africa, South America)

  • Which regions are analyzed in the report?

    • APAC, Europe, North America, Middle East and Africa and South America

  • What are the key growth drivers and market challenges?

    • Corporate decarbonization mandates power purchase agreements accelerating global photovoltaic procurement, Grid curtailment infrastructure bottlenecks impeding large scale photovoltaic integration operational efficiency

  • Who are the major players in the Solar Panels Market?

    • Adani Solar, Astronergy Co. Ltd., Canadian Solar Inc., EGING PV, First Solar Inc., GCL System Integration Technology, Hanwha Group, JA Solar Technology Co. Ltd., JinkoSolar Holding Co. Ltd., LONGi Green Energy Co. Ltd., REC Solar Holdings AS, Risen Energy Co. Ltd., Seraphim Energy Group Co. Ltd., Talesun Solar Technologies, Trina Solar Co. Ltd., Vikram Solar Ltd., VSUN Solar, Waaree Energies Ltd., Wuxi Suntech Power Co. Ltd. and Yingli Solar

Market Research Insights

  • Evolving energy demands are forcing rapid innovations across the market, moving beyond standard applications into highly specialized configurations. The adoption of advanced cell structures has accelerated across commercial real estate, reducing external material cladding costs by 14% while simultaneously generating onsite power.
  • In land-constrained regions, developers are shifting focus toward floating installations, which naturally cool the modules and improve energy conversion efficiency by up to 11% compared to traditional ground-mounted systems. Furthermore, enhanced thermal transfer mechanisms in hybrid systems are maximizing overall plant output.
  • Enhanced digital integration protocols allow these diverse assets to communicate seamlessly with utility networks, cutting transmission congestion-related downtime by 18% and ensuring highly stable, predictable commercial energy distribution.

We can help! Our analysts can customize this solar panels market research report to meet your requirements.

Get in touch

1. Executive Summary

1.1 Market overview

Executive Summary - Chart on Market Overview
Executive Summary - Data Table on Market Overview
Executive Summary - Chart on Global Market Characteristics
Executive Summary - Chart on Market by Geography
Executive Summary - Chart on Market Segmentation by End-user
Executive Summary - Chart on Market Segmentation by Type
Executive Summary - Chart on Market Segmentation by Connectivity
Executive Summary - Chart on Market Segmentation by Technology
Executive Summary - Chart on Incremental Growth
Executive Summary - Data Table on Incremental Growth
Executive Summary - Chart on Company Market Positioning

2. Technavio Analysis

2.1 Analysis of price sensitivity, lifecycle, customer purchase basket, adoption rates, and purchase criteria

2.2 Criticality of inputs and Factors of differentiation

Chart on Overview on criticality of inputs and factors of differentiation

2.3 Factors of disruption

Chart on Overview on factors of disruption

2.4 Impact of drivers and challenges

Chart on Impact of drivers and challenges in 2025 and 2030

3. Market Landscape

3.1 Market ecosystem

Chart on Parent Market
Data Table on - Parent Market

3.2 Market characteristics

Chart on Market characteristics analysis

3.3 Value chain analysis

Chart on Value chain analysis

4. Market Sizing

4.1 Market definition

Data Table on Offerings of companies included in the market definition

4.2 Market segment analysis

Market segments

4.3 Market size 2025

4.4 Market outlook: Forecast for 2025-2030

Chart on Global - Market size and forecast 2025-2030 ($ million)
Data Table on Global - Market size and forecast 2025-2030 ($ million)
Chart on Global Market: Year-over-year growth 2025-2030 (%)
Data Table on Global Market: Year-over-year growth 2025-2030 (%)

5. Historic Market Size

5.1 Global Solar Panels Market 2020 - 2024

Historic Market Size - Data Table on Global Solar Panels Market 2020 - 2024 ($ million)

5.2 End-user segment analysis 2020 - 2024

Historic Market Size - End-user Segment 2020 - 2024 ($ million)

5.3 Type segment analysis 2020 - 2024

Historic Market Size - Type Segment 2020 - 2024 ($ million)

5.4 Connectivity segment analysis 2020 - 2024

Historic Market Size - Connectivity Segment 2020 - 2024 ($ million)

5.5 Technology segment analysis 2020 - 2024

Historic Market Size - Technology Segment 2020 - 2024 ($ million)

5.6 Geography segment analysis 2020 - 2024

Historic Market Size - Geography Segment 2020 - 2024 ($ million)

5.7 Country segment analysis 2020 - 2024

Historic Market Size - Country Segment 2020 - 2024 ($ million)

6. Qualitative Analysis

6.1 Impact of AI on global solar panels market

6.2 Impact of geopolitical conflicts on global solar panels market

7. Five Forces Analysis

7.1 Five forces summary

Five forces analysis - Comparison between 2025 and 2030

7.2 Bargaining power of buyers

Bargaining power of buyers - Impact of key factors 2025 and 2030

7.3 Bargaining power of suppliers

Bargaining power of suppliers - Impact of key factors in 2025 and 2030

7.4 Threat of new entrants

Threat of new entrants - Impact of key factors in 2025 and 2030

7.5 Threat of substitutes

Threat of substitutes - Impact of key factors in 2025 and 2030

7.6 Threat of rivalry

Threat of rivalry - Impact of key factors in 2025 and 2030

7.7 Market condition

Chart on Market condition - Five forces 2025 and 2030

8. Market Segmentation by End-user

8.1 Market segments

Chart on End-user - Market share 2025-2030 (%)
Data Table on End-user - Market share 2025-2030 (%)

8.2 Comparison by End-user

Chart on Comparison by End-user
Data Table on Comparison by End-user

8.3 Power utilities - Market size and forecast 2025-2030

Chart on Power utilities - Market size and forecast 2025-2030 ($ million)
Data Table on Power utilities - Market size and forecast 2025-2030 ($ million)
Chart on Power utilities - Year-over-year growth 2025-2030 (%)
Data Table on Power utilities - Year-over-year growth 2025-2030 (%)

8.4 Commercial - Market size and forecast 2025-2030

Chart on Commercial - Market size and forecast 2025-2030 ($ million)
Data Table on Commercial - Market size and forecast 2025-2030 ($ million)
Chart on Commercial - Year-over-year growth 2025-2030 (%)
Data Table on Commercial - Year-over-year growth 2025-2030 (%)

8.5 Residential - Market size and forecast 2025-2030

Chart on Residential - Market size and forecast 2025-2030 ($ million)
Data Table on Residential - Market size and forecast 2025-2030 ($ million)
Chart on Residential - Year-over-year growth 2025-2030 (%)
Data Table on Residential - Year-over-year growth 2025-2030 (%)

8.6 Market opportunity by End-user

Market opportunity by End-user ($ million)
Data Table on Market opportunity by End-user ($ million)

9. Market Segmentation by Type

9.1 Market segments

Chart on Type - Market share 2025-2030 (%)
Data Table on Type - Market share 2025-2030 (%)

9.2 Comparison by Type

Chart on Comparison by Type
Data Table on Comparison by Type

9.3 Crystalline panel - Market size and forecast 2025-2030

Chart on Crystalline panel - Market size and forecast 2025-2030 ($ million)
Data Table on Crystalline panel - Market size and forecast 2025-2030 ($ million)
Chart on Crystalline panel - Year-over-year growth 2025-2030 (%)
Data Table on Crystalline panel - Year-over-year growth 2025-2030 (%)

9.4 Thin-film panel - Market size and forecast 2025-2030

Chart on Thin-film panel - Market size and forecast 2025-2030 ($ million)
Data Table on Thin-film panel - Market size and forecast 2025-2030 ($ million)
Chart on Thin-film panel - Year-over-year growth 2025-2030 (%)
Data Table on Thin-film panel - Year-over-year growth 2025-2030 (%)

9.5 Market opportunity by Type

Market opportunity by Type ($ million)
Data Table on Market opportunity by Type ($ million)

10. Market Segmentation by Connectivity

10.1 Market segments

Chart on Connectivity - Market share 2025-2030 (%)
Data Table on Connectivity - Market share 2025-2030 (%)

10.2 Comparison by Connectivity

Chart on Comparison by Connectivity
Data Table on Comparison by Connectivity

10.3 On-grid - Market size and forecast 2025-2030

Chart on On-grid - Market size and forecast 2025-2030 ($ million)
Data Table on On-grid - Market size and forecast 2025-2030 ($ million)
Chart on On-grid - Year-over-year growth 2025-2030 (%)
Data Table on On-grid - Year-over-year growth 2025-2030 (%)

10.4 Off-grid - Market size and forecast 2025-2030

Chart on Off-grid - Market size and forecast 2025-2030 ($ million)
Data Table on Off-grid - Market size and forecast 2025-2030 ($ million)
Chart on Off-grid - Year-over-year growth 2025-2030 (%)
Data Table on Off-grid - Year-over-year growth 2025-2030 (%)

10.5 Market opportunity by Connectivity

Market opportunity by Connectivity ($ million)
Data Table on Market opportunity by Connectivity ($ million)

11. Market Segmentation by Technology

11.1 Market segments

Chart on Technology - Market share 2025-2030 (%)
Data Table on Technology - Market share 2025-2030 (%)

11.2 Comparison by Technology

Chart on Comparison by Technology
Data Table on Comparison by Technology

11.3 Solar PV - Market size and forecast 2025-2030

Chart on Solar PV - Market size and forecast 2025-2030 ($ million)
Data Table on Solar PV - Market size and forecast 2025-2030 ($ million)
Chart on Solar PV - Year-over-year growth 2025-2030 (%)
Data Table on Solar PV - Year-over-year growth 2025-2030 (%)

11.4 Concentrated solar power - Market size and forecast 2025-2030

Chart on Concentrated solar power - Market size and forecast 2025-2030 ($ million)
Data Table on Concentrated solar power - Market size and forecast 2025-2030 ($ million)
Chart on Concentrated solar power - Year-over-year growth 2025-2030 (%)
Data Table on Concentrated solar power - Year-over-year growth 2025-2030 (%)

11.5 Market opportunity by Technology

Market opportunity by Technology ($ million)
Data Table on Market opportunity by Technology ($ million)

12. Customer Landscape

12.1 Customer landscape overview

Analysis of price sensitivity, lifecycle, customer purchase basket, adoption rates, and purchase criteria

13. Geographic Landscape

13.1 Geographic segmentation

Chart on Market share by geography 2025-2030 (%)
Data Table on Market share by geography 2025-2030 (%)

13.2 Geographic comparison

Chart on Geographic comparison
Data Table on Geographic comparison

13.3 APAC - Market size and forecast 2025-2030

Chart on APAC - Market size and forecast 2025-2030 ($ million)
Data Table on APAC - Market size and forecast 2025-2030 ($ million)
Chart on APAC - Year-over-year growth 2025-2030 (%)
Data Table on APAC - Year-over-year growth 2025-2030 (%)
Chart on Regional Comparison - APAC
Data Table on Regional Comparison - APAC

13.3.1 China - Market size and forecast 2025-2030

Chart on China - Market size and forecast 2025-2030 ($ million)
Data Table on China - Market size and forecast 2025-2030 ($ million)
Chart on China - Year-over-year growth 2025-2030 (%)
Data Table on China - Year-over-year growth 2025-2030 (%)

13.3.2 India - Market size and forecast 2025-2030

Chart on India - Market size and forecast 2025-2030 ($ million)
Data Table on India - Market size and forecast 2025-2030 ($ million)
Chart on India - Year-over-year growth 2025-2030 (%)
Data Table on India - Year-over-year growth 2025-2030 (%)

13.3.3 Japan - Market size and forecast 2025-2030

Chart on Japan - Market size and forecast 2025-2030 ($ million)
Data Table on Japan - Market size and forecast 2025-2030 ($ million)
Chart on Japan - Year-over-year growth 2025-2030 (%)
Data Table on Japan - Year-over-year growth 2025-2030 (%)

13.3.4 Australia - Market size and forecast 2025-2030

Chart on Australia - Market size and forecast 2025-2030 ($ million)
Data Table on Australia - Market size and forecast 2025-2030 ($ million)
Chart on Australia - Year-over-year growth 2025-2030 (%)
Data Table on Australia - Year-over-year growth 2025-2030 (%)

13.3.5 South Korea - Market size and forecast 2025-2030

Chart on South Korea - Market size and forecast 2025-2030 ($ million)
Data Table on South Korea - Market size and forecast 2025-2030 ($ million)
Chart on South Korea - Year-over-year growth 2025-2030 (%)
Data Table on South Korea - Year-over-year growth 2025-2030 (%)

13.3.6 Indonesia - Market size and forecast 2025-2030

Chart on Indonesia - Market size and forecast 2025-2030 ($ million)
Data Table on Indonesia - Market size and forecast 2025-2030 ($ million)
Chart on Indonesia - Year-over-year growth 2025-2030 (%)
Data Table on Indonesia - Year-over-year growth 2025-2030 (%)

13.4 Europe - Market size and forecast 2025-2030

Chart on Europe - Market size and forecast 2025-2030 ($ million)
Data Table on Europe - Market size and forecast 2025-2030 ($ million)
Chart on Europe - Year-over-year growth 2025-2030 (%)
Data Table on Europe - Year-over-year growth 2025-2030 (%)
Chart on Regional Comparison - Europe
Data Table on Regional Comparison - Europe

13.4.1 Germany - Market size and forecast 2025-2030

Chart on Germany - Market size and forecast 2025-2030 ($ million)
Data Table on Germany - Market size and forecast 2025-2030 ($ million)
Chart on Germany - Year-over-year growth 2025-2030 (%)
Data Table on Germany - Year-over-year growth 2025-2030 (%)

13.4.2 Spain - Market size and forecast 2025-2030

Chart on Spain - Market size and forecast 2025-2030 ($ million)
Data Table on Spain - Market size and forecast 2025-2030 ($ million)
Chart on Spain - Year-over-year growth 2025-2030 (%)
Data Table on Spain - Year-over-year growth 2025-2030 (%)

13.4.3 Italy - Market size and forecast 2025-2030

Chart on Italy - Market size and forecast 2025-2030 ($ million)
Data Table on Italy - Market size and forecast 2025-2030 ($ million)
Chart on Italy - Year-over-year growth 2025-2030 (%)
Data Table on Italy - Year-over-year growth 2025-2030 (%)

13.4.4 France - Market size and forecast 2025-2030

Chart on France - Market size and forecast 2025-2030 ($ million)
Data Table on France - Market size and forecast 2025-2030 ($ million)
Chart on France - Year-over-year growth 2025-2030 (%)
Data Table on France - Year-over-year growth 2025-2030 (%)

13.4.5 The Netherlands - Market size and forecast 2025-2030

Chart on The Netherlands - Market size and forecast 2025-2030 ($ million)
Data Table on The Netherlands - Market size and forecast 2025-2030 ($ million)
Chart on The Netherlands - Year-over-year growth 2025-2030 (%)
Data Table on The Netherlands - Year-over-year growth 2025-2030 (%)

13.4.6 UK - Market size and forecast 2025-2030

Chart on UK - Market size and forecast 2025-2030 ($ million)
Data Table on UK - Market size and forecast 2025-2030 ($ million)
Chart on UK - Year-over-year growth 2025-2030 (%)
Data Table on UK - Year-over-year growth 2025-2030 (%)

13.5 North America - Market size and forecast 2025-2030

Chart on North America - Market size and forecast 2025-2030 ($ million)
Data Table on North America - Market size and forecast 2025-2030 ($ million)
Chart on North America - Year-over-year growth 2025-2030 (%)
Data Table on North America - Year-over-year growth 2025-2030 (%)
Chart on Regional Comparison - North America
Data Table on Regional Comparison - North America

13.5.1 US - Market size and forecast 2025-2030

Chart on US - Market size and forecast 2025-2030 ($ million)
Data Table on US - Market size and forecast 2025-2030 ($ million)
Chart on US - Year-over-year growth 2025-2030 (%)
Data Table on US - Year-over-year growth 2025-2030 (%)

13.5.2 Canada - Market size and forecast 2025-2030

Chart on Canada - Market size and forecast 2025-2030 ($ million)
Data Table on Canada - Market size and forecast 2025-2030 ($ million)
Chart on Canada - Year-over-year growth 2025-2030 (%)
Data Table on Canada - Year-over-year growth 2025-2030 (%)

13.5.3 Mexico - Market size and forecast 2025-2030

Chart on Mexico - Market size and forecast 2025-2030 ($ million)
Data Table on Mexico - Market size and forecast 2025-2030 ($ million)
Chart on Mexico - Year-over-year growth 2025-2030 (%)
Data Table on Mexico - Year-over-year growth 2025-2030 (%)

13.6 Middle East and Africa - Market size and forecast 2025-2030

Chart on Middle East and Africa - Market size and forecast 2025-2030 ($ million)
Data Table on Middle East and Africa - Market size and forecast 2025-2030 ($ million)
Chart on Middle East and Africa - Year-over-year growth 2025-2030 (%)
Data Table on Middle East and Africa - Year-over-year growth 2025-2030 (%)
Chart on Regional Comparison - Middle East and Africa
Data Table on Regional Comparison - Middle East and Africa

13.6.1 Saudi Arabia - Market size and forecast 2025-2030

Chart on Saudi Arabia - Market size and forecast 2025-2030 ($ million)
Data Table on Saudi Arabia - Market size and forecast 2025-2030 ($ million)
Chart on Saudi Arabia - Year-over-year growth 2025-2030 (%)
Data Table on Saudi Arabia - Year-over-year growth 2025-2030 (%)

13.6.2 South Africa - Market size and forecast 2025-2030

Chart on South Africa - Market size and forecast 2025-2030 ($ million)
Data Table on South Africa - Market size and forecast 2025-2030 ($ million)
Chart on South Africa - Year-over-year growth 2025-2030 (%)
Data Table on South Africa - Year-over-year growth 2025-2030 (%)

13.6.3 UAE - Market size and forecast 2025-2030

Chart on UAE - Market size and forecast 2025-2030 ($ million)
Data Table on UAE - Market size and forecast 2025-2030 ($ million)
Chart on UAE - Year-over-year growth 2025-2030 (%)
Data Table on UAE - Year-over-year growth 2025-2030 (%)

13.6.4 Egypt - Market size and forecast 2025-2030

Chart on Egypt - Market size and forecast 2025-2030 ($ million)
Data Table on Egypt - Market size and forecast 2025-2030 ($ million)
Chart on Egypt - Year-over-year growth 2025-2030 (%)
Data Table on Egypt - Year-over-year growth 2025-2030 (%)

13.6.5 Morocco - Market size and forecast 2025-2030

Chart on Morocco - Market size and forecast 2025-2030 ($ million)
Data Table on Morocco - Market size and forecast 2025-2030 ($ million)
Chart on Morocco - Year-over-year growth 2025-2030 (%)
Data Table on Morocco - Year-over-year growth 2025-2030 (%)

13.7 South America - Market size and forecast 2025-2030

Chart on South America - Market size and forecast 2025-2030 ($ million)
Data Table on South America - Market size and forecast 2025-2030 ($ million)
Chart on South America - Year-over-year growth 2025-2030 (%)
Data Table on South America - Year-over-year growth 2025-2030 (%)
Chart on Regional Comparison - South America
Data Table on Regional Comparison - South America

13.7.1 Brazil - Market size and forecast 2025-2030

Chart on Brazil - Market size and forecast 2025-2030 ($ million)
Data Table on Brazil - Market size and forecast 2025-2030 ($ million)
Chart on Brazil - Year-over-year growth 2025-2030 (%)
Data Table on Brazil - Year-over-year growth 2025-2030 (%)

13.7.2 Argentina - Market size and forecast 2025-2030

Chart on Argentina - Market size and forecast 2025-2030 ($ million)
Data Table on Argentina - Market size and forecast 2025-2030 ($ million)
Chart on Argentina - Year-over-year growth 2025-2030 (%)
Data Table on Argentina - Year-over-year growth 2025-2030 (%)

13.7.3 Chile - Market size and forecast 2025-2030

Chart on Chile - Market size and forecast 2025-2030 ($ million)
Data Table on Chile - Market size and forecast 2025-2030 ($ million)
Chart on Chile - Year-over-year growth 2025-2030 (%)
Data Table on Chile - Year-over-year growth 2025-2030 (%)

13.8 Market opportunity by geography

Market opportunity by geography ($ million)
Data Tables on Market opportunity by geography ($ million)

14. Drivers, Challenges, and Opportunity

14.1 Market drivers

Corporate decarbonization mandates power purchase agreements accelerating global photovoltaic procurement
Industrial reshoring incentives domestic manufacturing subsidies expanding regional solar assembly capacity
Inverter modernization system integration software optimization enhancing commercial solar performance yields

14.2 Market challenges

Grid curtailment infrastructure bottlenecks impeding large scale photovoltaic integration operational efficiency
Volatile raw material expenditures silver price inflation compressing photovoltaic manufacturer profitability
Protectionist trade tariffs supply chain fragmentation escalating international market operational costs

14.3 Impact of drivers and challenges

Impact of drivers and challenges in 2025 and 2030

14.4 Market opportunities

Widespread adoption high efficiency tunnel oxide passivated contact module technology
Rapid commercialization perovskite silicon tandem solar cell photovoltaic efficiency breakthroughs
Strategic intellectual property enforcement cross licensing agreements safeguarding solar technology

15. Competitive Landscape

15.1 Overview

15.2

Overview on criticality of inputs and factors of differentiation

15.3 Landscape disruption

Overview on factors of disruption

15.4 Industry risks

Impact of key risks on business

16. Competitive Analysis

16.1 Companies profiled

Companies covered

16.2 Company ranking index

16.3 Market positioning of companies

Matrix on companies position and classification

16.4 Adani Solar

Adani Solar - Overview
Adani Solar - Product / Service
Adani Solar - Key offerings
SWOT

16.5 Astronergy Co. Ltd.

Astronergy Co. Ltd. - Overview
Astronergy Co. Ltd. - Product / Service
Astronergy Co. Ltd. - Key offerings
SWOT

16.6 Canadian Solar Inc.

Canadian Solar Inc. - Overview
Canadian Solar Inc. - Business segments
Canadian Solar Inc. - Key offerings
Canadian Solar Inc. - Segment focus
SWOT

16.7 EGING PV

EGING PV - Overview
EGING PV - Business segments
EGING PV - Key offerings
EGING PV - Segment focus
SWOT

16.8 First Solar Inc.

First Solar Inc. - Overview
First Solar Inc. - Business segments
First Solar Inc. - Key offerings
First Solar Inc. - Segment focus
SWOT

16.9 GCL System Integration Technology

GCL System Integration Technology - Overview
GCL System Integration Technology - Product / Service
GCL System Integration Technology - Key offerings
SWOT

16.10 Hanwha Group

Hanwha Group - Overview
Hanwha Group - Business segments
Hanwha Group - Key offerings
Hanwha Group - Segment focus
SWOT

16.11 JA Solar Technology Co. Ltd.

JA Solar Technology Co. Ltd. - Overview
JA Solar Technology Co. Ltd. - Product / Service
JA Solar Technology Co. Ltd. - Key offerings
SWOT

16.12 JinkoSolar Holding Co. Ltd.

JinkoSolar Holding Co. Ltd. - Overview
JinkoSolar Holding Co. Ltd. - Product / Service
JinkoSolar Holding Co. Ltd. - Key offerings
SWOT

16.13 LONGi Green Energy Co. Ltd.

LONGi Green Energy Co. Ltd. - Overview
LONGi Green Energy Co. Ltd. - Product / Service
LONGi Green Energy Co. Ltd. - Key offerings
SWOT

16.14 REC Solar Holdings AS

REC Solar Holdings AS - Overview
REC Solar Holdings AS - Product / Service
REC Solar Holdings AS - Key offerings
SWOT

16.15 Risen Energy Co. Ltd.

Risen Energy Co. Ltd. - Overview
Risen Energy Co. Ltd. - Business segments
Risen Energy Co. Ltd. - Key offerings
Risen Energy Co. Ltd. - Segment focus
SWOT

16.16 Talesun Solar Technologies

Talesun Solar Technologies - Overview
Talesun Solar Technologies - Product / Service
Talesun Solar Technologies - Key offerings
SWOT

16.17 Trina Solar Co. Ltd.

Trina Solar Co. Ltd. - Overview
Trina Solar Co. Ltd. - Product / Service
Trina Solar Co. Ltd. - Key offerings
SWOT

16.18 Waaree Energies Ltd.

Waaree Energies Ltd. - Overview
Waaree Energies Ltd. - Product / Service
Waaree Energies Ltd. - Key offerings
SWOT

17. Appendix

17.1 Scope of the report

Market definition
Objectives
Notes and caveats

17.2 Inclusions and exclusions checklist

Inclusions checklist
Exclusions checklist

17.3 Currency conversion rates for US$

17.4 Research methodology

17.5 Data procurement

Information sources

17.6 Data validation

17.7 Validation techniques employed for market sizing

17.8 Data synthesis

17.9 360 degree market analysis

17.10 List of abbreviations

Research Methodology

Technavio presents a detailed picture of the market by way of study, synthesis, and summation of data from multiple sources. The analysts have presented the various facets of the market with a particular focus on identifying the key industry influencers. The data thus presented is comprehensive, reliable, and the result of extensive research, both primary and secondary.

INFORMATION SOURCES

Primary sources

  • Manufacturers and suppliers
  • Channel partners
  • Industry experts
  • Strategic decision makers

Secondary sources

  • Industry journals and periodicals
  • Government data
  • Financial reports of key industry players
  • Historical data
  • Press releases

DATA ANALYSIS

Data Synthesis

  • Collation of data
  • Estimation of key figures
  • Analysis of derived insights

Data Validation

  • Triangulation with data models
  • Reference against proprietary databases
  • Corroboration with industry experts

REPORT WRITING

Qualitative

  • Market drivers
  • Market challenges
  • Market trends
  • Five forces analysis

Quantitative

  • Market size and forecast
  • Market segmentation
  • Geographical insights
  • Competitive landscape

Interested in this report?

Get your sample now to see our research methodology and insights!

Download Now

Frequently Asked Questions

Solar Panels market growth will increase by USD 65395.8 million during 2026-2030.

The Solar Panels market is expected to grow at a CAGR of 8.2% during 2026-2030.

Solar Panels market is segmented by End-user (Power utilities, Commercial, Residential) Type (Crystalline panel, Thin-film panel) Connectivity (On-grid, Off-grid) Technology (Solar PV, Concentrated solar power)

Adani Solar, Astronergy Co. Ltd., Canadian Solar Inc., EGING PV, First Solar Inc., GCL System Integration Technology, Hanwha Group, JA Solar Technology Co. Ltd., JinkoSolar Holding Co. Ltd., LONGi Green Energy Co. Ltd., REC Solar Holdings AS, Risen Energy Co. Ltd., Seraphim Energy Group Co. Ltd., Talesun Solar Technologies, Trina Solar Co. Ltd., Vikram Solar Ltd., VSUN Solar, Waaree Energies Ltd., Wuxi Suntech Power Co. Ltd., Yingli Solar are a few of the key vendors in the Solar Panels market.

APAC will register the highest growth rate of 39.2% among the other regions. Therefore, the Solar Panels market in APAC is expected to garner significant business opportunities for the vendors during the forecast period.

China, India, Japan, Australia, South Korea, Indonesia, Germany, Spain, Italy, France, The Netherlands, UK, US, Canada, Mexico, Saudi Arabia, South Africa, UAE, Egypt, Morocco, Brazil, Argentina, Chile

  • Corporate decarbonization mandates power purchase agreements accelerating global photovoltaic procurement is the driving factor this market.

The Solar Panels market vendors should focus on grabbing business opportunities from the End-user segment as it accounted for the largest market share in the base year.
RIA - Research AI Assistant
Ask RIA
