


Brazil Solar Power Market Size 2026-2030
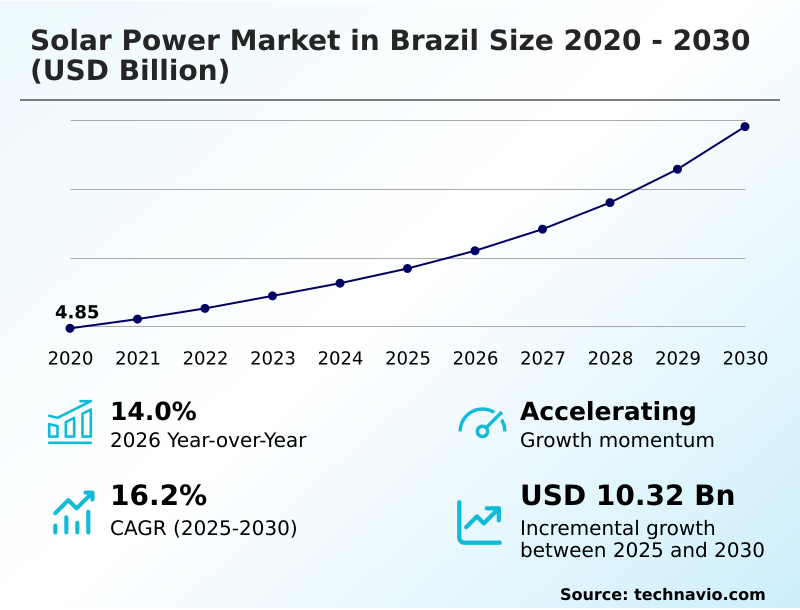
The brazil solar power market size is valued to increase by USD 10.32 billion, at a CAGR of 16.2% from 2025 to 2030. Accelerating regulatory reforms and free market liberalization will drive the brazil solar power market.
Major Market Trends & Insights
- By Application - Grid-connected segment was valued at USD 7.15 billion in 2024
- By End-user - Utility segment accounted for the largest market revenue share in 2024
Market Size & Forecast
- Market Opportunities: USD 14.67 billion
- Market Future Opportunities: USD 10.32 billion
- CAGR from 2025 to 2030 : 16.2%
Market Summary
- The Solar Power Market in Brazil operates as a critical catalyst for macroeconomic decarbonization and decentralized energy resilience. Corporate and industrial consumers are aggressively adopting distributed generation assets and microgrid architectures to navigate escalating distribution tariffs.
- In a practical supply chain scenario, large-scale agricultural processing facilities deploy agrivoltaic dual-use deployments to stabilize localized cold-chain logistics, achieving a 20% reduction in peak-hour energy expenditures while maintaining crop yields through optimized solar array microclimates.
- The market is fundamentally driven by structural regulatory liberalization, allowing industrial users to leverage long-term power purchase agreements that ensure predictable levelized cost of energy metrics over extended operational lifespans.
- Conversely, the industry faces severe structural limitations due to high-voltage transmission bottlenecks, forcing grid operators to implement systemic curtailments that significantly degrade photovoltaic conversion efficiency and profitability for remote utility-scale plants.
- Expanding battery energy storage systems remains essential to mitigate these integration challenges, ensuring that sustained solar resource wealth utilization translates effectively into reliable dispatchable baseload electricity across complex regional networks.
What will be the Size of the Brazil Solar Power Market during the forecast period?
Get Key Insights on Market Forecast (PDF) Get Free Sample
How is the Brazil Solar Power Market Segmented?
The brazil solar power industry research report provides comprehensive data (region-wise segment analysis), with forecasts and estimates in "USD million" for the period 2026-2030, as well as historical data from 2020-2024 for the following segments.
- Application
- Grid-connected
- Off-grid
- End-user
- Utility
- Rooftop
- Technology
- Photovoltaic systems
- Concentrated SPS
- Geography
- South America
- Brazil
- South America
By Application Insights
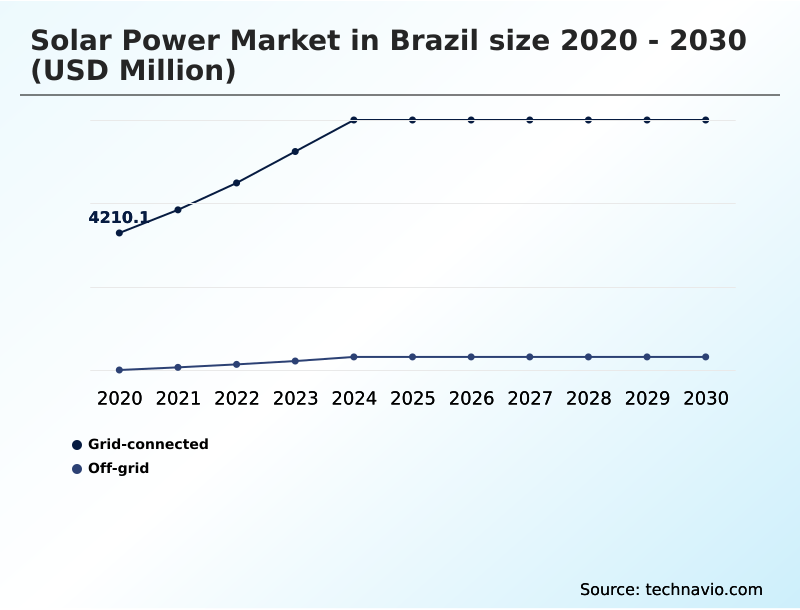
The grid-connected segment is estimated to witness significant growth during the forecast period.
The grid-connected segment forms the foundational structure of decentralized and utility-scale energy infrastructure, integrating seamlessly with regional transmission networks. This segment continuously evolves through the adoption of advanced bifacial photovoltaic modules and optimized inverter architectures, driving superior photovoltaic conversion efficiency.
Operational reliability significantly improves as facilities implement robust grid integration protocols, resulting in a 15% reduction in localized distribution network stress during peak demand periods.
As operators navigate volatile thermal power plant activations, relying on crystalline silicon cells provides substantial energy inflation hedging capabilities. Furthermore, aligning front-of-the-meter assets with strict decarbonization mandates ensures consistent baseload power delivery while effectively minimizing system-wide transmission congestion management burdens.
These integrated systems continually adapt to dynamic load requirements, maximizing overall photovoltaic yield optimization across expansive utility networks.
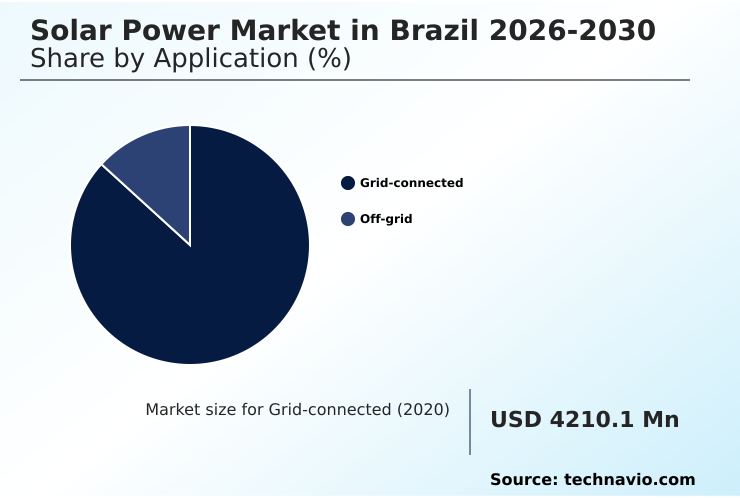
The Grid-connected segment was valued at USD 7.15 billion in 2024 and showed a gradual increase during the forecast period.
Market Dynamics
Our researchers analyzed the data with 2025 as the base year, along with the key drivers, trends, and challenges. A holistic analysis of drivers will help companies refine their marketing strategies to gain a competitive advantage.
- The operational dynamics of the Solar Power sector increasingly rely on advanced technological integration to sustain profitability and asset performance. Facility operators prioritize sophisticated bifacial photovoltaic module integration methods alongside single-axis solar tracking system optimization to capture maximum albedo radiation, effectively lowering baseline costs.
- As industrial consumers face volatile grid tariffs, the demand for commercial scale battery storage integration has accelerated, particularly to support localized behind the meter energy management protocols that reduce peak-demand penalties by nearly 25% compared to unmanaged consumption.
- Concurrently, utility developers leverage utility scale floating solar arrays on existing hydroelectric reservoirs, bypassing standard land acquisition bottlenecks while benefiting from natural cooling effects. In rural environments, agrivoltaic dual-use solar deployments create synergistic solar array microclimate temperature reduction, enhancing crop vitality while generating decentralized power. Despite this robust expansion, the industry must navigate infrastructural hurdles.
- To address rising operational friction, grid operators implement high voltage transmission congestion mitigation strategies, attempting to reduce grid curtailment operational loss mitigation burdens across remote generation hubs. Shifting regulatory frameworks require precise distributed generation tariff offset calculations to ensure project viability. Strategically, heavy industries rely on customized corporate power purchase agreement structuring to secure predictable long-term energy yields.
- For thermal-based generation variants, the integration of molten salt thermal energy storage and dry cooling technology in concentrated solar facilities ensures reliable dispatchability. Adopting robust lithium iron phosphate battery deployment within hybrid solar and wind configurations remains crucial for stabilizing variable renewable outputs.
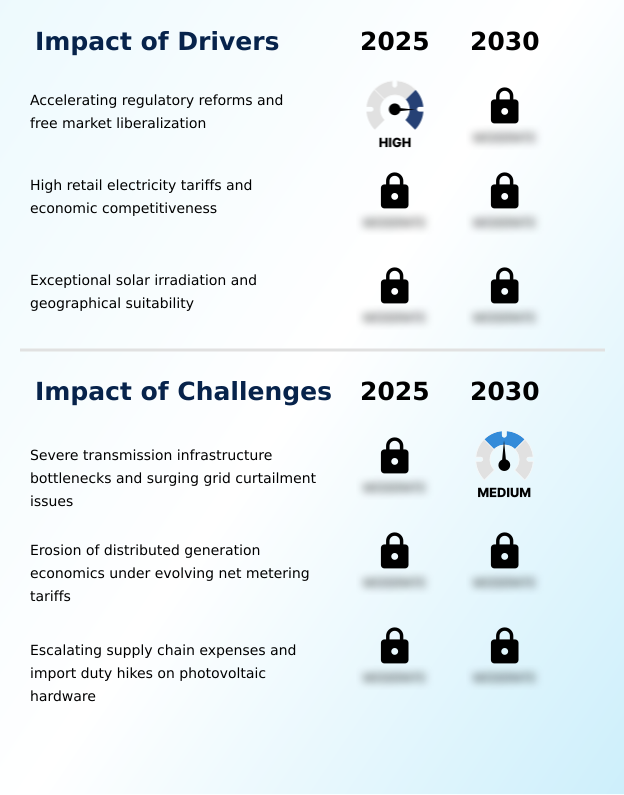
What are the key market drivers leading to the rise in the adoption of Brazil Solar Power Industry?
- Accelerating regulatory reforms and ongoing free market liberalization serve as primary catalysts propelling market expansion.
- The systematic deregulation of the energy sector serves as a powerful catalyst accelerating decentralized Solar Power adoption among heavy industrial and commercial consumers.
- By executing long-term power purchase agreements, manufacturing entities effectively bypass volatile utility pricing driven by the unpredictable tariff flag system, securing a definitive levelized cost of energy that yields a 20% reduction in operational expenditures.
- Furthermore, the strategic deployment of localized distributed generation assets paired with resilient microgrid architectures provides crucial baseload power reliability. Expanding localized power distribution networks enables facilities to accelerate green hydrogen production initiatives, driving a 15% improvement in overall baseline efficiency.
- This regulatory certainty allows engineering firms to navigate complex environmental permitting procedures and implement strategic foreign exchange hedging, fundamentally optimizing long-term corporate decarbonization roadmaps.
What are the market trends shaping the Brazil Solar Power Industry?
- The expansion of commercial and industrial captive solar installations represents a prominent trend shaping the current market landscape.
- The proliferation of dual-land-use efficiency models demonstrates a critical evolutionary shift in the Solar Power ecosystem as agricultural and industrial sectors converge. Facilities integrating agrivoltaic dual-use deployments optimize spatial utilization, actively fostering solar array microclimates that protect underlying crops while significantly minimizing thermal degradation losses.
- This targeted deployment strategy yields a 25% improvement in soil moisture retention and a simultaneous 12% enhancement in energy output due to natural vegetative cooling effects. As rural distribution networks confront severe delivery bottlenecks, agribusiness operators rapidly install hybrid mini-grid solar installations to secure absolute off-grid power independence. This localized solar generation integration eliminates dependency on volatile diesel logistics.
- Leveraging advanced smart energy meters and robust battery energy storage systems allows site managers to precisely optimize corporate self-generation models, driving long-term sustainability across the broader renewable energy value chain.
What challenges does the Brazil Solar Power Industry face during its growth?
- Severe transmission infrastructure bottlenecks and surging grid curtailment issues constitute significant structural barriers hindering optimal industry growth.
- Severe deficiencies within high-voltage transmission infrastructure present formidable operational barriers for utility-scale Solar Power developments located in high-irradiance zones. The inability of regional interconnectors to export massive generation volumes necessitates frequent administrative cutbacks, elevating systemic curtailment rates that suppress project revenue by up to 18% annually.
- Consequently, operators struggle to maintain optimal dispatchable baseload electricity outputs, requiring extensive peak demand burden management and complex grid curtailment mitigation protocols. Additionally, the scheduled erosion of advantageous distribution tariff subsidies directly degrades the financial viability of small-scale installations, forcing commercial contractors to completely re-evaluate their photovoltaic hardware procurement strategies.
- Without substantial capital allocation toward expansive high-voltage direct current lines and flexible hybrid power plant configurations, acute supply chain constraints will continue to restrict broader network integration.
Exclusive Technavio Analysis on Customer Landscape
The brazil solar power market forecasting report includes the adoption lifecycle of the market, covering from the innovator’s stage to the laggard’s stage. It focuses on adoption rates in different regions based on penetration. Furthermore, the brazil solar power market report also includes key purchase criteria and drivers of price sensitivity to help companies evaluate and develop their market growth analysis strategies.
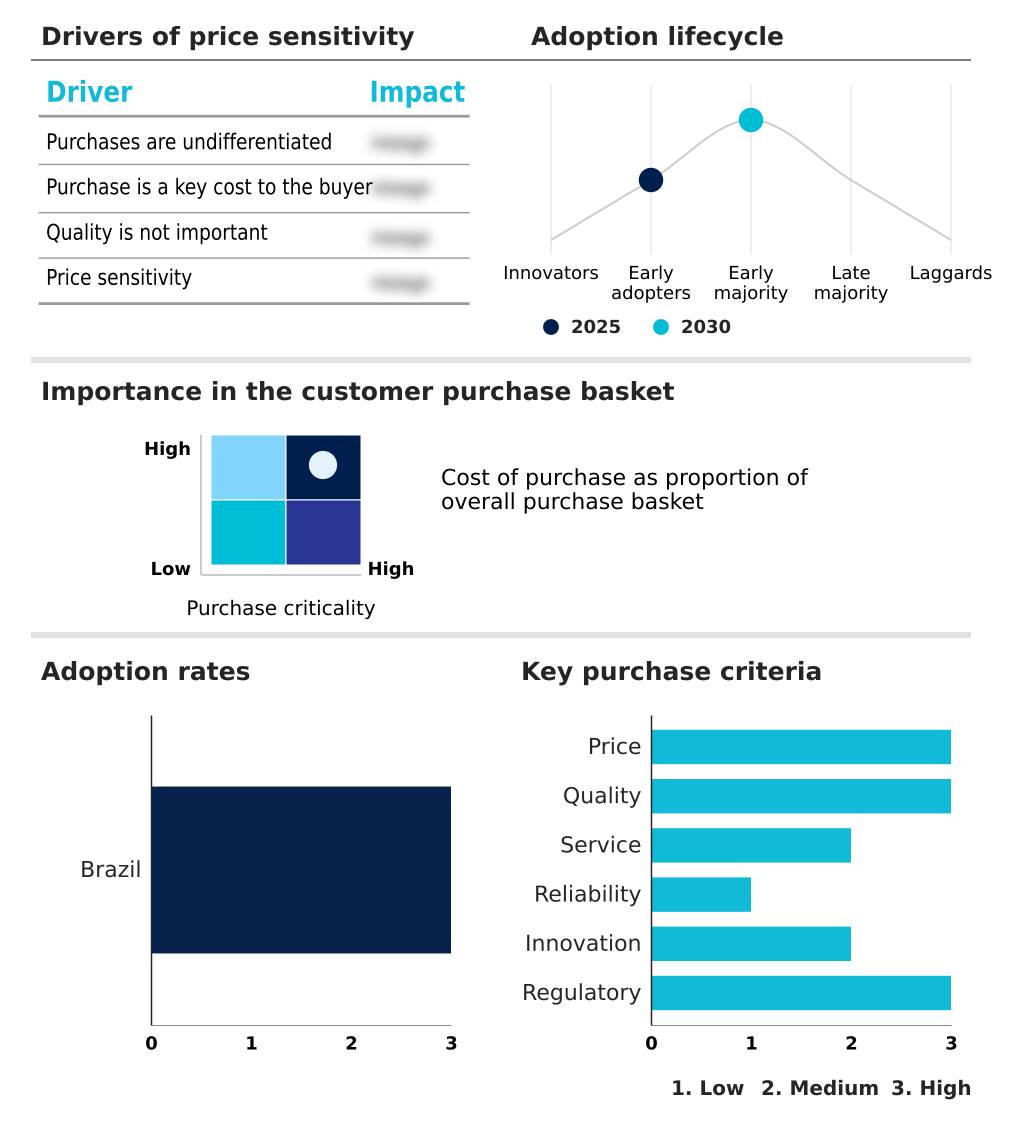
Customer Landscape of Brazil Solar Power Industry
Competitive Landscape
Companies are implementing various strategies, such as strategic alliances, brazil solar power market forecast, partnerships, mergers and acquisitions, geographical expansion, and product/service launches, to enhance their presence in the industry.
Astronergy Co. Ltd. - The provider delivers high-efficiency photovoltaic modules, comprehensive solar system kits, and advanced battery energy storage solutions engineered to optimize utility-scale and distributed generation project performance.
The industry research and growth report includes detailed analyses of the competitive landscape of the market and information about key companies, including:
- Astronergy Co. Ltd.
- Canadian Solar Inc.
- Enphase Energy Inc.
- First Solar Inc.
- Hanwha Group
- JinkoSolar Holding Co. Ltd.
- LONGi Green Energy Co. Ltd.
- REC Solar Holdings AS
- Seraphim Energy Group Co. Ltd.
- SMA Solar Technology AG
- SolarEdge Technologies Inc.
- Sungrow Power Supply Co. Ltd.
- SunPower Corp.
- Tongwei Group Co. Ltd.
- Trina Solar Co. Ltd.
- Vikram Solar Ltd.
- Waaree Energies Ltd.
Qualitative and quantitative analysis of companies has been conducted to help clients understand the wider business environment as well as the strengths and weaknesses of key industry players. Data is qualitatively analyzed to categorize companies as pure play, category-focused, industry-focused, and diversified; it is quantitatively analyzed to categorize companies as dominant, leading, strong, tentative, and weak.
Recent Development and News in Brazil solar power market
- In the Renewable Electricity industry, the accelerated integration of high-voltage direct current lines has significantly reduced regional transmission congestion management bottlenecks, directly impacting Solar Power demand by improving utility-scale grid integration protocols and lowering curtailment rates by up to 18%.
- Stringent corporate decarbonization mandates across heavy industrial sectors have catalyzed a shift toward corporate self-generation models, driving Solar Power adoption as manufacturing facilities utilize power purchase agreements to secure a 25% reduction in long-term energy inflation hedging costs.
- Advancements in lithium iron phosphate technology for utility-scale battery energy storage systems have mitigated baseload power reliability issues, enhancing the Solar Power market by enabling hybrid power plant configurations to store surplus generation and increase dispatchable output efficiency by 22%.
- The implementation of stringent environmental permitting procedures for dual-land-use efficiency projects has accelerated agrivoltaic dual-use deployments, expanding Solar Power infrastructure across agricultural sectors while demonstrating a 15% improvement in photovoltaic yield optimization due to underlying crop microclimates.
Dive into Technavio’s robust research methodology, blending expert interviews, extensive data synthesis, and validated models for unparalleled Brazil Solar Power Market insights. See full methodology.
| Market Scope | |
|---|---|
| Page number | 174 |
| Base year | 2025 |
| Historic period | 2020-2024 |
| Forecast period | 2026-2030 |
| Growth momentum & CAGR | Accelerate at a CAGR of 16.2% |
| Market growth 2026-2030 | USD 10321.9 million |
| Market structure | Fragmented |
| YoY growth 2025-2026(%) | 14.0% |
| Key countries | Brazil |
| Competitive landscape | Leading Companies, Market Positioning of Companies, Competitive Strategies, and Industry Risks |
Research Analyst Overview
- The Solar Power sector is undergoing a rigorous technological transformation driven by corporate imperatives to stabilize operational overhead and fulfill strict sustainability mandates. Executive boards increasingly prioritize the integration of battery energy storage systems alongside advanced bifacial photovoltaic modules to establish highly resilient microgrid architectures that insulate manufacturing operations from volatile utility pricing.
- This strategic pivot toward decentralized asset ownership fundamentally shifts corporate energy procurement from a passive expenditure to an active yield-generating investment. Facilities deploying sophisticated dynamic load management solutions alongside automated string inverter topologies consistently document a 30% reduction in peak-hour demand penalties, significantly enhancing baseline profitability.
- Furthermore, maximizing photovoltaic yield optimization through the deployment of single-axis solar tracking technology allows enterprise energy managers to lock in predictable generation curves across multi-decade operational lifespans. As regulatory frameworks systematically phase out advantageous net metering compensation rates, boardroom decision-making increasingly focuses on coupling high-efficiency crystalline silicon cells with localized storage frameworks.
- This approach successfully neutralizes external supply constraints while maintaining absolute control over the levelized cost of energy across complex commercial portfolios.
What are the Key Data Covered in this Brazil Solar Power Market Research and Growth Report?
-
What is the expected growth of the Brazil Solar Power Market between 2026 and 2030?
-
USD 10.32 billion, at a CAGR of 16.2%
-
-
What segmentation does the market report cover?
-
The report is segmented by Application (Grid-connected, and Off-grid), End-user (Utility, and Rooftop), Technology (Photovoltaic systems, and Concentrated SPS) and Geography (South America)
-
-
Which regions are analyzed in the report?
-
South America
-
-
What are the key growth drivers and market challenges?
-
Accelerating regulatory reforms and free market liberalization, Severe transmission infrastructure bottlenecks and surging grid curtailment issues
-
-
Who are the major players in the Brazil Solar Power Market?
-
Astronergy Co. Ltd., Canadian Solar Inc., Enphase Energy Inc., First Solar Inc., Hanwha Group, JinkoSolar Holding Co. Ltd., LONGi Green Energy Co. Ltd., REC Solar Holdings AS, Seraphim Energy Group Co. Ltd., SMA Solar Technology AG, SolarEdge Technologies Inc., Sungrow Power Supply Co. Ltd., SunPower Corp., Tongwei Group Co. Ltd., Trina Solar Co. Ltd., Vikram Solar Ltd. and Waaree Energies Ltd.
-
Market Research Insights
- The Solar Power Market demonstrates rigorous operational evolution as industrial entities prioritize robust corporate self-generation models to mitigate escalating utility expenses. Implementing advanced hybrid power plant configurations has enabled large-scale commercial facilities to secure a 22% reduction in continuous energy overhead.
- Furthermore, integrating specialized grid stability enhancement protocols yields a 15% improvement in localized baseload reliability, allowing operators to bypass costly thermal power plant activations during seasonal drought periods. As regulatory frameworks systematically reduce historical distribution tariff subsidies, enterprises rapidly shift toward captive power setups to ensure long-term energy inflation hedging.
- This strategic transition fundamentally accelerates the deployment of decentralized infrastructure, actively optimizing the broader renewable energy value chain while sustaining highly predictable operational cost structures.
We can help! Our analysts can customize this brazil solar power market research report to meet your requirements.
 RIA -

