Solder Flux Market Analysis, Size, and Forecast 2026-2030: APAC (China, Japan, and India), Europe (Germany, UK, and France), North America (US, Canada, and Mexico), Middle East and Africa (Israel, South Africa, and Turkey), South America (Brazil, Argentina, and Colombia), and Rest of World (ROW)

Solder Flux Market Analysis, Size, and Forecast 2026-2030:
APAC (China, Japan, and India), Europe (Germany, UK, and France), North America (US, Canada, and Mexico), Middle East and Africa (Israel, South Africa, and Turkey), South America (Brazil, Argentina, and Colombia), and Rest of World (ROW)

Published: Oct 2026 307 Pages SKU: IRTNTR81721

Market Overview at a Glance

$88.04 Mn
Market Opportunity
6.1%
CAGR 2025 - 2030
50.3%
APAC Growth
$109.93 Mn
No-clean flux segment 2024

Solder Flux Market Size 2026-2030

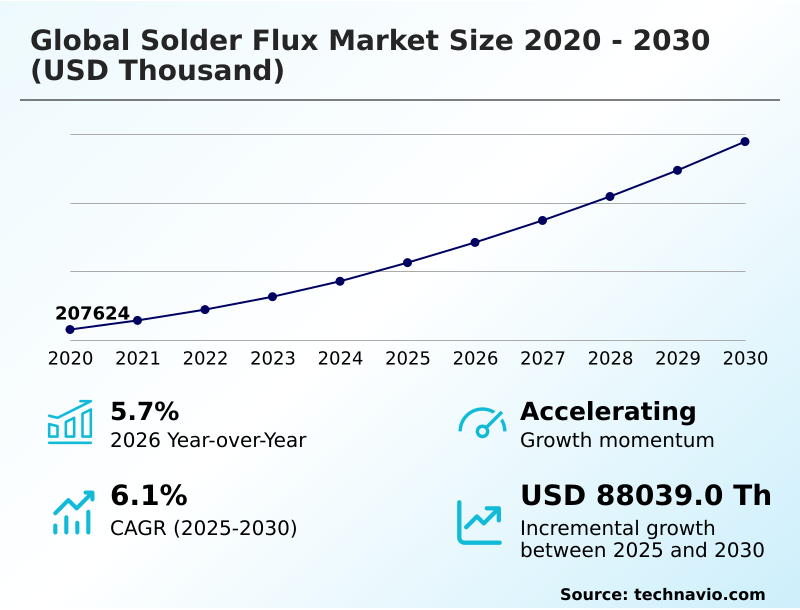
The solder flux market size is valued to increase by USD 88.04 million, at a CAGR of 6.1% from 2025 to 2030. Rapid electrification of automotive sector and expansion of advanced driver assistance systems will drive the solder flux market.

Major Market Trends & Insights

  • APAC dominated the market and accounted for a 50.3% growth during the forecast period.
  • By Product Type - No-clean flux segment was valued at USD 109.93 million in 2024
  • By End-user - Consumer electronics segment accounted for the largest market revenue share in 2024

Market Size & Forecast

  • Market Opportunities:
  • Market Future Opportunities: USD 88.04 million
  • CAGR from 2025 to 2030 : 6.1%

Market Summary

  • Solder Flux Market expansion is heavily dictated by the relentless miniaturization of electronic components and the electrification of automotive powertrains. As original equipment manufacturers pack greater functional density into constrained form factors, precision chemical formulations become essential to ensure reliable interconnections.
  • One major driver accelerating consumption is the deployment of electric vehicle battery management systems, which require exceptional thermal stability and void reduction capabilities to prevent electrical failures under mechanical stress. Consequently, facilities utilizing advanced zero-halogen chemistry have reported a 20% improvement in first-pass assembly yields compared to legacy solvent-based processes.
  • In a real-world manufacturing scenario, automated surface mount technology lines apply targeted liquid fluxes via micro-dispensing jets, entirely eliminating the need for post-reflow washing and substantially lowering hazardous wastewater treatment overhead. However, severe volatility in natural rosin pricing and synthetic chemical supply chain bottlenecks challenge formulators, forcing them to absorb increased production costs while maintaining competitive contract pricing.
  • Striking a balance between high-activity oxide removal and stringent environmental compliance remains a definitive priority for advanced microelectronics fabrication worldwide.

What will be the Size of the Solder Flux Market during the forecast period?
Get Key Insights on Market Forecast (PDF) Get Free Sample

How is the Solder Flux Market Segmented?

The solder flux industry research report provides comprehensive data (region-wise segment analysis), with forecasts and estimates in "USD thousand" for the period 2026-2030, as well as historical data from 2020-2024 for the following segments.

  • Product type
    • No-clean flux
    • Rosin-based flux
    • Water-soluble flux
    • Acid flux
  • End-user
    • Consumer electronics
    • Automotive electronics
    • Telecommunications and data centers
    • Industrial electronics
    • Others
  • Type
    • Liquid flux
    • Solid flux
    • Gel flux
  • Geography
    • APAC
      • China
      • Japan
      • India
      • South Korea
      • Australia
      • Indonesia
    • Europe
      • Germany
      • UK
      • France
      • Italy
      • The Netherlands
      • Spain
    • North America
      • US
      • Canada
      • Mexico
    • Middle East and Africa
      • Israel
      • South Africa
      • Turkey
      • Saudi Arabia
      • UAE
    • South America
      • Brazil
      • Argentina
      • Colombia

By Product Type Insights

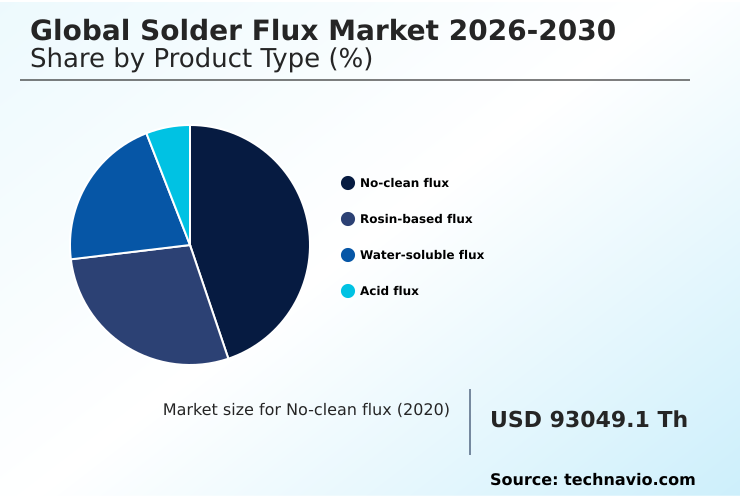
The no-clean flux segment is estimated to witness significant growth during the forecast period.

Industrial manufacturers are increasingly optimizing high-volume production lines by integrating advanced residue-free chemical formulations. As electronic assemblies shrink, managing a fine pitch component becomes critical to maintaining structural integrity without requiring post-reflow washing.

Formulators utilize a specialized thixotropic gelling agent and a halide free activator to ensure precise application during a selective soldering process, preventing bridging and micro-voids.

This approach delivers exceptional thermal stress endurance for a power conversion module operating in demanding conditions. By eliminating aqueous cleaning steps, facilities have reduced operational water consumption by 25%.

Such efficiency gains allow engineers to seamlessly execute complex ball grid array rework while bypassing traditional rosin mildly activated compounds, ultimately streamlining output speed and lowering overall chemical disposal costs across assembly workflows.
Get Free Sample

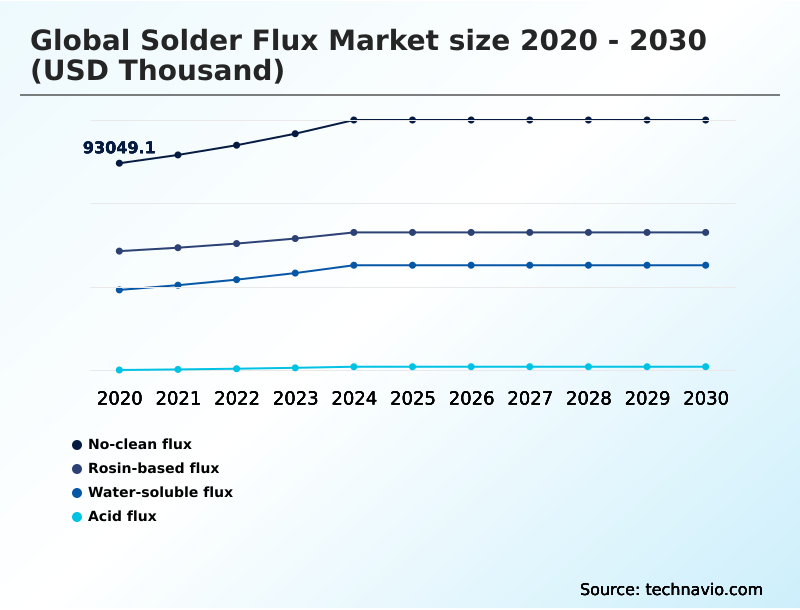
The No-clean flux segment was valued at USD 109.93 million in 2024 and showed a gradual increase during the forecast period.
Get Free Sample

Regional Analysis

APAC is estimated to contribute 50.3% to the growth of the global market during the forecast period.Technavio’s analysts have elaborately explained the regional trends and drivers that shape the market during the forecast period.
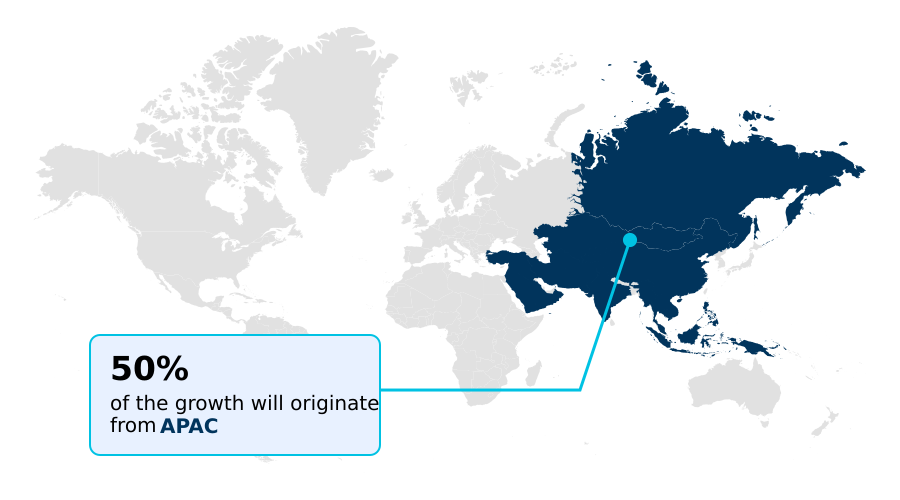
See How Solder Flux Market Demand is Rising in APAC Get Free Sample

Geographic adoption of electronic assembly materials reveals stark operational contrasts, particularly between the rapidly expanding APAC supply chain and the highly regulated European sector.

APAC facilities prioritize high-throughput automated wave soldering to support massive consumer electronics output, achieving a 35% higher production velocity than European counterparts.

Conversely, European manufacturers focus heavily on a sophisticated synthetic resin matrix to meet strict environmental compliance during smart grid modernization initiatives.

This regulatory pressure has driven European plants to reduce hazardous chemical usage by 18% through the integration of advanced water soluble organic materials and closed-loop aqueous cleaning system technologies.

Meanwhile, specialized sectors such as aerospace instrumentation assembly depend on exact intermetallic bonding facilitation to ensure joint durability.

The integration of advanced industrial automation equipment across APAC has subsequently lowered manual rework costs by 14%, demonstrating how distinct regional priorities dictate the deployment of highly active, defect-reducing chemical formulations.

Market Dynamics

Our researchers analyzed the data with 2025 as the base year, along with the key drivers, trends, and challenges. A holistic analysis of drivers will help companies refine their marketing strategies to gain a competitive advantage.

  • Advanced electronics fabrication continuously demands highly specialized chemical solutions to address the increasingly complex architectural requirements of modern circuitry. As hardware designs rapidly miniaturize, the shift toward ultra fine pitch semiconductor packaging forces manufacturers to implement exceptionally precise material dispensing techniques to prevent bridging and micro-voids.
  • This precision is fundamentally critical for the production of high reliability automotive control units, which must endure relentless thermal cycling and intense mechanical vibration without experiencing parasitic electrical leakage. Consequently, assembly operations integrating advanced synthetic liquid fluxes have noted a 15% higher thermal durability rating compared to those relying on conventional rosin formulations, directly bolstering supply chain confidence.
  • Simultaneously, the pursuit of lean manufacturing is accelerating the industry-wide transition toward no clean flux residue elimination, fundamentally streamlining production cycles by bypassing secondary cleaning phases. For environments where ionic cleanliness is absolutely paramount, facilities must navigate the complexities of aqueous wash cycle waste management to mitigate the steep overhead costs associated with hazardous effluent treatment.
  • Meanwhile, contractors servicing orbital platforms face distinct operational constraints, strictly adhering to aerospace grade low outgassing requirements to prevent volatile condensation from degrading sensitive optical sensors in vacuum environments.
  • By aligning precise chemical activation profiles with rigorous environmental safety standards, global formulators empower electronic assembly plants to drastically lower defect rates, reduce energy consumption, and sustain robust long-term functionality across both commercial and mission-critical hardware deployments.
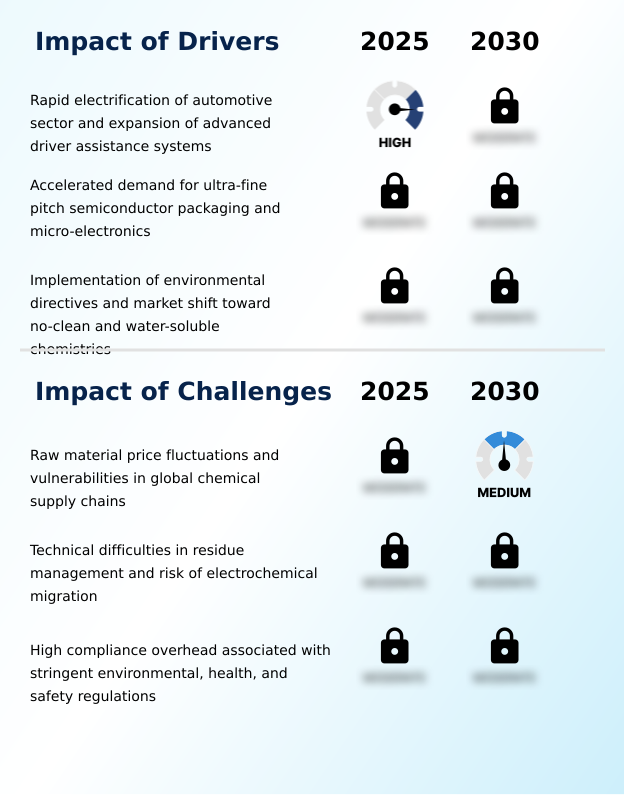
What are the key market drivers leading to the rise in the adoption of Solder Flux Industry?

  • The rapid electrification of the automotive sector, alongside the widespread expansion of advanced driver assistance systems, serves as the primary structural driver propelling market expansion.

  • Stringent environmental regulations and automotive modernization mandates are fundamentally propelling the widespread adoption of sustainable assembly materials.
  • The rapid integration of an advanced driver assistance system demands highly durable electronic control unit production capable of surviving a harsh operating environment without performance degradation.
  • To support this, manufacturers are rapidly transitioning toward zero halogen chemistry and low volatile organic compound formulations. This strategic shift allows facilities utilizing a lead free solder alloy to decrease toxic emissions by 24% while simultaneously improving joint fatigue resistance.
  • Furthermore, the push for a sophisticated high density interconnect design within modern surface mount technology lines has lowered post-reflow inspection failures by 12%.
  • These measurable compliance and efficiency gains ensure that specialized chemical activators remain indispensable to automated electronic manufacturing processes.

What are the market trends shaping the Solder Flux Industry?

  • The surging integration of high-reliability, low-voiding fluxes within renewable energy infrastructure constitutes a major upcoming market trend. This shift emphasizes the critical need for robust thermal management in modern power electronics.

  • The proliferation of complex electronic architectures is driving a massive transition toward high-precision material application techniques across the technology sector. As device footprints shrink, manufacturers are actively deploying advanced micro dispensing application methods to seamlessly support intricate system in package architecture. This technological shift directly facilitates reliable flip chip bonding by preventing unwanted solder bridging on densely packed substrates.
  • By leveraging superior capillary action enhancement, modern formulations allow liquid solder to penetrate ultra-fine clearances, thereby reducing joint voiding defects by 28%. Consequently, this refined void reduction technique dramatically improves thermal dissipation in a high power semiconductor, boosting overall operational lifespan.
  • As global telecommunication network expansion accelerates, optimized printed circuit board assembly processes are enabling data centers to increase hardware processing stability by 14%, proving that targeted chemical innovation is fundamentally reshaping modern digital infrastructure.

What challenges does the Solder Flux Industry face during its growth?

  • Severe price fluctuations of critical raw materials, coupled with persistent vulnerabilities across global chemical supply chains, present significant operational challenges that suppress industry profitability.

  • Managing post-reflow chemical residues presents a formidable structural challenge for high-density microelectronic assembly facilities. As component stand-off heights decrease, achieving total dendritic growth inhibition becomes exceedingly difficult, elevating the risk of catastrophic parasitic electrical leakage across tightly spaced conductive pads.
  • To ensure absolute electrochemical migration prevention within mission critical hardware, manufacturers must often utilize aggressive aqueous solutions, which subsequently increases hazardous wastewater treatment costs by up to 18%. Maintaining adequate surface insulation resistance requires perfect optimization of the thermal reflow profile to fully volatilize active chemical agents without damaging sensitive surrounding modules.
  • Consequently, strict adherence to a complex environmental compliance mandate severely limits formulation flexibility, forcing engineers to navigate an intricate balance between superior oxide removal and absolute long-term reliability.

Exclusive Technavio Analysis on Customer Landscape

The solder flux market forecasting report includes the adoption lifecycle of the market, covering from the innovator’s stage to the laggard’s stage. It focuses on adoption rates in different regions based on penetration. Furthermore, the solder flux market report also includes key purchase criteria and drivers of price sensitivity to help companies evaluate and develop their market growth analysis strategies.
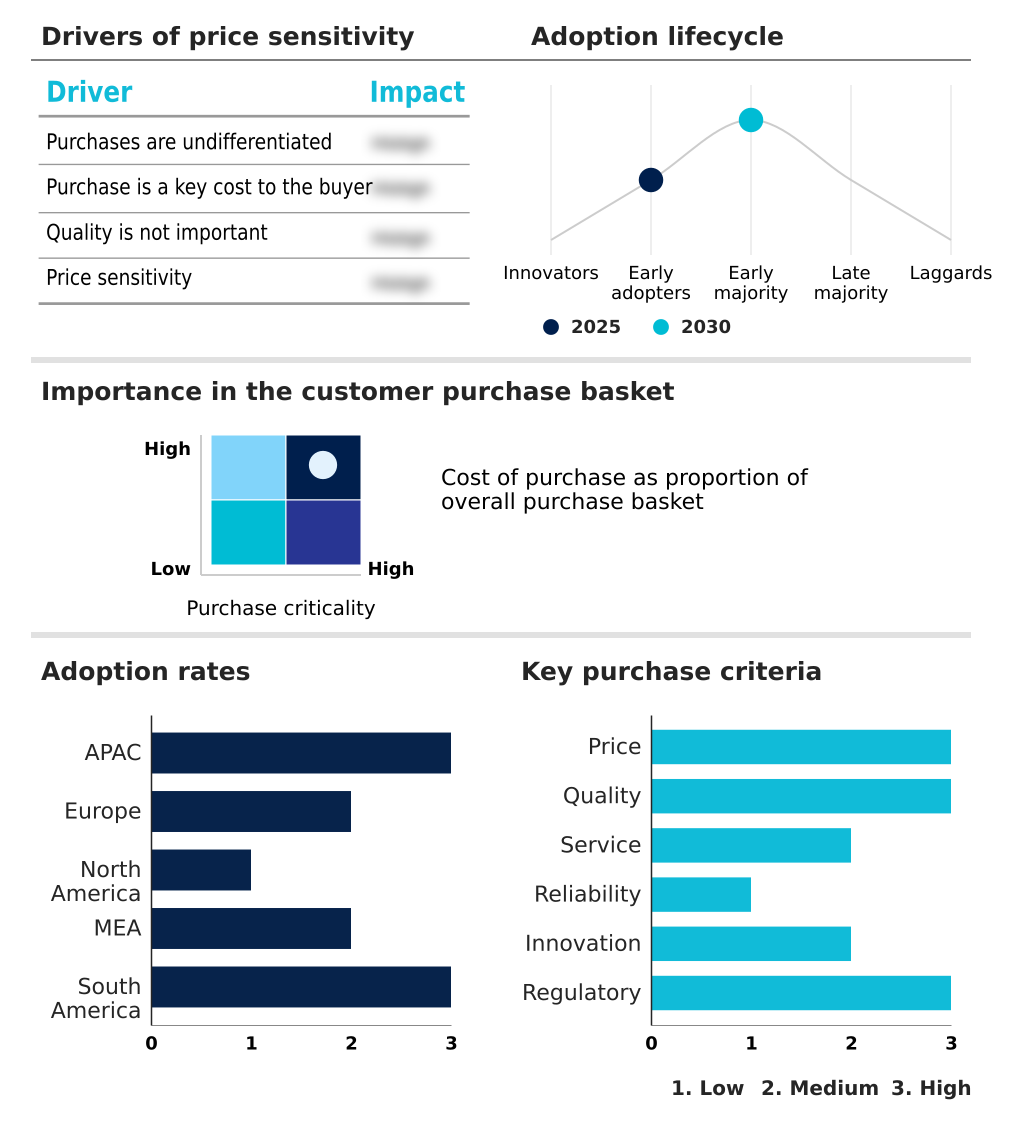
Customer Landscape of Solder Flux Industry

Competitive Landscape

Companies are implementing various strategies, such as strategic alliances, solder flux market forecast, partnerships, mergers and acquisitions, geographical expansion, and product/service launches, to enhance their presence in the industry.

AIM Solder Pvt. Ltd. - Provides specialized no-clean, water-soluble, and halogen-free formulations optimized for advanced semiconductor packaging, surface-mount technology, and highly reliable printed circuit board assembly processes.

The industry research and growth report includes detailed analyses of the competitive landscape of the market and information about key companies, including:

  • AIM Solder Pvt. Ltd.
  • Canfield Technologies LLC
  • Felder GmbH
  • Henkel Adhesives India Pvt Ltd
  • Heraeus Holding GmbH
  • Indium Corp.
  • Interflux Electronics N.V.
  • Inventec Performance Chemicals
  • Johnson Matthey Plc
  • KOKI Co Ltd.
  • Kothari Metsol Pvt Ltd
  • Lucas Milhaupt Inc.
  • MacDermid Alpha Elec. Sol.
  • MG Chemicals Ltd.
  • Senju Metal Industry
  • Shenmao Technology Inc.
  • STANNOL GMBH
  • Superior Flux
  • Tamura Corp.
  • The Harris Products Group

Qualitative and quantitative analysis of companies has been conducted to help clients understand the wider business environment as well as the strengths and weaknesses of key industry players. Data is qualitatively analyzed to categorize companies as pure play, category-focused, industry-focused, and diversified; it is quantitatively analyzed to categorize companies as dominant, leading, strong, tentative, and weak.

Recent Development and News in Solder flux market

  • In the Diversified Chemicals industry, the stringent implementation of REACH and RoHS directives mandating the elimination of halogenated flame retardants and hazardous volatile organic compounds has shifted raw material procurement, directly impacting Solder Flux demand by accelerating the formulation of zero-halogen and bio-based synthetic resin fluxes for electronics manufacturing.
  • The aggressive scaling of local hydrometallurgical recycling infrastructure for critical metals has stabilized the supply of high-purity tin and silver precursors, directly enhancing the production economics of lead-free soldering pastes and liquid fluxes utilized in advanced semiconductor packaging.
  • Rapid transitions toward water-based solvent chemistries to reduce industrial wastewater toxicity have forced contract manufacturers to upgrade their aqueous cleaning systems, increasing the operational adoption rate of eco-friendly water-soluble flux formulations by 30% across mission-critical aerospace and medical device assembly lines.
  • Advancements in precision polymer additive manufacturing have improved the rheological properties of industrial adhesives and thixotropic gels, enabling the development of ultra-fine micro-dispensing flux vehicles that support high-density interconnect applications and reduce component voiding rates below industry-standard thresholds.

Dive into Technavio’s robust research methodology, blending expert interviews, extensive data synthesis, and validated models for unparalleled Solder Flux Market insights. See full methodology.

Market Scope
Page number 307
Base year 2025
Historic period 2020-2024
Forecast period 2026-2030
Growth momentum & CAGR Accelerate at a CAGR of 6.1%
Market growth 2026-2030 USD 88039.0 thousand
Market structure Fragmented
YoY growth 2025-2026(%) 5.7%
Key countries China, Japan, India, South Korea, Australia, Indonesia, Germany, UK, France, Italy, The Netherlands, Spain, US, Canada, Mexico, Israel, South Africa, Turkey, Saudi Arabia, UAE, Brazil, Argentina and Colombia
Competitive landscape Leading Companies, Market Positioning of Companies, Competitive Strategies, and Industry Risks

Request Free Sample

Research Analyst Overview

  • The foundational mechanics of electronic manufacturing are undergoing a massive transformation driven by the mandatory integration of sustainable, high-efficiency joining materials. Boardroom executives are increasingly prioritizing zero halogen chemistry to align with global environmental mandates while simultaneously accelerating production throughput. This strategic pivot actively mitigates supply chain risks and avoids the steep penalties associated with hazardous waste disposal.
  • By optimizing the specific thermal reflow profile of advanced liquid compounds, contract manufacturers have successfully driven down energy consumption by 15% relative to legacy production lines. Such operational enhancements are highly dependent on reliable dendritic growth inhibition, which directly prevents catastrophic parasitic electrical leakage in high-voltage applications.
  • As automated surface mount technology lines operate at unprecedented speeds, the transition away from traditional rosin mildly activated fluxes ensures that microscopic solder joints remain structurally sound without requiring intense post-process washing. These targeted chemical innovations empower procurement leaders to reduce raw material waste, streamline localized assembly protocols, and dramatically improve the long-term operational resilience of next-generation digital hardware.

What are the Key Data Covered in this Solder Flux Market Research and Growth Report?

  • What is the expected growth of the Solder Flux Market between 2026 and 2030?

    • USD 88.04 million, at a CAGR of 6.1%

  • What segmentation does the market report cover?

    • The report is segmented by Product Type (No-clean flux, Rosin-based flux, Water-soluble flux, and Acid flux), End-user (Consumer electronics, Automotive electronics, Telecommunications and data centers, Industrial electronics, and Others), Type (Liquid flux, Solid flux, and Gel flux) and Geography (APAC, Europe, North America, Middle East and Africa, South America)

  • Which regions are analyzed in the report?

    • APAC, Europe, North America, Middle East and Africa and South America

  • What are the key growth drivers and market challenges?

    • Rapid electrification of automotive sector and expansion of advanced driver assistance systems, Raw material price fluctuations and vulnerabilities in global chemical supply chains

  • Who are the major players in the Solder Flux Market?

    • AIM Solder Pvt. Ltd., Canfield Technologies LLC, Felder GmbH, Henkel Adhesives India Pvt Ltd, Heraeus Holding GmbH, Indium Corp., Interflux Electronics N.V., Inventec Performance Chemicals, Johnson Matthey Plc, KOKI Co Ltd., Kothari Metsol Pvt Ltd, Lucas Milhaupt Inc., MacDermid Alpha Elec. Sol., MG Chemicals Ltd., Senju Metal Industry, Shenmao Technology Inc., STANNOL GMBH, Superior Flux, Tamura Corp. and The Harris Products Group

Market Research Insights

  • The Solder Flux Market is fundamentally reshaping modern printed circuit board assembly by enabling highly reliable connections in extreme environments. As manufacturers transition to a high density interconnect design, adopting an advanced void reduction technique becomes vital for maintaining thermal stability in mission critical hardware.
  • Facilities upgrading to these precision chemistries have witnessed a 15% reduction in post-solder defect rates, directly improving overall operational output. Furthermore, substituting legacy rosin materials with eco-friendly alternatives has decreased hazardous wastewater disposal costs by 22%.
  • By eliminating secondary cleaning stages, electronics contract manufacturers can optimize factory floor space and accelerate production cycles, thereby securing a definitive competitive advantage in automated semiconductor packaging operations.

We can help! Our analysts can customize this solder flux market research report to meet your requirements.

Get in touch

1. Executive Summary

1.1 Market overview

Executive Summary - Chart on Market Overview
Executive Summary - Data Table on Market Overview
Executive Summary - Chart on Global Market Characteristics
Executive Summary - Chart on Market by Geography
Executive Summary - Chart on Market Segmentation by Product Type
Executive Summary - Chart on Market Segmentation by End-user
Executive Summary - Chart on Market Segmentation by Type
Executive Summary - Chart on Incremental Growth
Executive Summary - Data Table on Incremental Growth
Executive Summary - Chart on Company Market Positioning

2. Technavio Analysis

2.1 Analysis of price sensitivity, lifecycle, customer purchase basket, adoption rates, and purchase criteria

2.2 Criticality of inputs and Factors of differentiation

Chart on Overview on criticality of inputs and factors of differentiation

2.3 Factors of disruption

Chart on Overview on factors of disruption

2.4 Impact of drivers and challenges

Chart on Impact of drivers and challenges in 2025 and 2030

3. Market Landscape

3.1 Market ecosystem

Chart on Parent Market
Data Table on - Parent Market

3.2 Market characteristics

Chart on Market characteristics analysis

3.3 Value chain analysis

Chart on Value chain analysis

4. Market Sizing

4.1 Market definition

Data Table on Offerings of companies included in the market definition

4.2 Market segment analysis

Market segments

4.3 Market size 2025

4.4 Market outlook: Forecast for 2025-2030

Chart on Global - Market size and forecast 2025-2030 ($ thousand)
Data Table on Global - Market size and forecast 2025-2030 ($ thousand)
Chart on Global Market: Year-over-year growth 2025-2030 (%)
Data Table on Global Market: Year-over-year growth 2025-2030 (%)

5. Historic Market Size

5.1 Global Solder Flux Market 2020 - 2024

Historic Market Size - Data Table on Global Solder Flux Market 2020 - 2024 ($ thousand)

5.2 Product Type segment analysis 2020 - 2024

Historic Market Size - Product Type Segment 2020 - 2024 ($ thousand)

5.3 End-user segment analysis 2020 - 2024

Historic Market Size - End-user Segment 2020 - 2024 ($ thousand)

5.4 Type segment analysis 2020 - 2024

Historic Market Size - Type Segment 2020 - 2024 ($ thousand)

5.5 Geography segment analysis 2020 - 2024

Historic Market Size - Geography Segment 2020 - 2024 ($ thousand)

5.6 Country segment analysis 2020 - 2024

Historic Market Size - Country Segment 2020 - 2024 ($ thousand)

6. Qualitative Analysis

6.1 Impact of AI on Global Solder Flux Market

6.2 Impact of Geopolitical Conflicts on Global Solder Flux Market

7. Five Forces Analysis

7.1 Five forces summary

Five forces analysis - Comparison between 2025 and 2030

7.2 Bargaining power of buyers

Bargaining power of buyers - Impact of key factors 2025 and 2030

7.3 Bargaining power of suppliers

Bargaining power of suppliers - Impact of key factors in 2025 and 2030

7.4 Threat of new entrants

Threat of new entrants - Impact of key factors in 2025 and 2030

7.5 Threat of substitutes

Threat of substitutes - Impact of key factors in 2025 and 2030

7.6 Threat of rivalry

Threat of rivalry - Impact of key factors in 2025 and 2030

7.7 Market condition

Chart on Market condition - Five forces 2025 and 2030

8. Market Segmentation by Product Type

8.1 Market segments

Chart on Product Type - Market share 2025-2030 (%)
Data Table on Product Type - Market share 2025-2030 (%)

8.2 Comparison by Product Type

Chart on Comparison by Product Type
Data Table on Comparison by Product Type

8.3 No-clean flux - Market size and forecast 2025-2030

Chart on No-clean flux - Market size and forecast 2025-2030 ($ thousand)
Data Table on No-clean flux - Market size and forecast 2025-2030 ($ thousand)
Chart on No-clean flux - Year-over-year growth 2025-2030 (%)
Data Table on No-clean flux - Year-over-year growth 2025-2030 (%)

8.4 Rosin-based flux - Market size and forecast 2025-2030

Chart on Rosin-based flux - Market size and forecast 2025-2030 ($ thousand)
Data Table on Rosin-based flux - Market size and forecast 2025-2030 ($ thousand)
Chart on Rosin-based flux - Year-over-year growth 2025-2030 (%)
Data Table on Rosin-based flux - Year-over-year growth 2025-2030 (%)

8.5 Water-soluble flux - Market size and forecast 2025-2030

Chart on Water-soluble flux - Market size and forecast 2025-2030 ($ thousand)
Data Table on Water-soluble flux - Market size and forecast 2025-2030 ($ thousand)
Chart on Water-soluble flux - Year-over-year growth 2025-2030 (%)
Data Table on Water-soluble flux - Year-over-year growth 2025-2030 (%)

8.6 Acid flux - Market size and forecast 2025-2030

Chart on Acid flux - Market size and forecast 2025-2030 ($ thousand)
Data Table on Acid flux - Market size and forecast 2025-2030 ($ thousand)
Chart on Acid flux - Year-over-year growth 2025-2030 (%)
Data Table on Acid flux - Year-over-year growth 2025-2030 (%)

8.7 Market opportunity by Product Type

Market opportunity by Product Type ($ thousand)
Data Table on Market opportunity by Product Type ($ thousand)

9. Market Segmentation by End-user

9.1 Market segments

Chart on End-user - Market share 2025-2030 (%)
Data Table on End-user - Market share 2025-2030 (%)

9.2 Comparison by End-user

Chart on Comparison by End-user
Data Table on Comparison by End-user

9.3 Consumer electronics - Market size and forecast 2025-2030

Chart on Consumer electronics - Market size and forecast 2025-2030 ($ thousand)
Data Table on Consumer electronics - Market size and forecast 2025-2030 ($ thousand)
Chart on Consumer electronics - Year-over-year growth 2025-2030 (%)
Data Table on Consumer electronics - Year-over-year growth 2025-2030 (%)

9.4 Automotive electronics - Market size and forecast 2025-2030

Chart on Automotive electronics - Market size and forecast 2025-2030 ($ thousand)
Data Table on Automotive electronics - Market size and forecast 2025-2030 ($ thousand)
Chart on Automotive electronics - Year-over-year growth 2025-2030 (%)
Data Table on Automotive electronics - Year-over-year growth 2025-2030 (%)

9.5 Telecommunications and data centers - Market size and forecast 2025-2030

Chart on Telecommunications and data centers - Market size and forecast 2025-2030 ($ thousand)
Data Table on Telecommunications and data centers - Market size and forecast 2025-2030 ($ thousand)
Chart on Telecommunications and data centers - Year-over-year growth 2025-2030 (%)
Data Table on Telecommunications and data centers - Year-over-year growth 2025-2030 (%)

9.6 Industrial electronics - Market size and forecast 2025-2030

Chart on Industrial electronics - Market size and forecast 2025-2030 ($ thousand)
Data Table on Industrial electronics - Market size and forecast 2025-2030 ($ thousand)
Chart on Industrial electronics - Year-over-year growth 2025-2030 (%)
Data Table on Industrial electronics - Year-over-year growth 2025-2030 (%)

9.7 Others - Market size and forecast 2025-2030

Chart on Others - Market size and forecast 2025-2030 ($ thousand)
Data Table on Others - Market size and forecast 2025-2030 ($ thousand)
Chart on Others - Year-over-year growth 2025-2030 (%)
Data Table on Others - Year-over-year growth 2025-2030 (%)

9.8 Market opportunity by End-user

Market opportunity by End-user ($ thousand)
Data Table on Market opportunity by End-user ($ thousand)

10. Market Segmentation by Type

10.1 Market segments

Chart on Type - Market share 2025-2030 (%)
Data Table on Type - Market share 2025-2030 (%)

10.2 Comparison by Type

Chart on Comparison by Type
Data Table on Comparison by Type

10.3 Liquid flux - Market size and forecast 2025-2030

Chart on Liquid flux - Market size and forecast 2025-2030 ($ thousand)
Data Table on Liquid flux - Market size and forecast 2025-2030 ($ thousand)
Chart on Liquid flux - Year-over-year growth 2025-2030 (%)
Data Table on Liquid flux - Year-over-year growth 2025-2030 (%)

10.4 Solid flux - Market size and forecast 2025-2030

Chart on Solid flux - Market size and forecast 2025-2030 ($ thousand)
Data Table on Solid flux - Market size and forecast 2025-2030 ($ thousand)
Chart on Solid flux - Year-over-year growth 2025-2030 (%)
Data Table on Solid flux - Year-over-year growth 2025-2030 (%)

10.5 Gel flux - Market size and forecast 2025-2030

Chart on Gel flux - Market size and forecast 2025-2030 ($ thousand)
Data Table on Gel flux - Market size and forecast 2025-2030 ($ thousand)
Chart on Gel flux - Year-over-year growth 2025-2030 (%)
Data Table on Gel flux - Year-over-year growth 2025-2030 (%)

10.6 Market opportunity by Type

Market opportunity by Type ($ thousand)
Data Table on Market opportunity by Type ($ thousand)

11. Customer Landscape

11.1 Customer landscape overview

Analysis of price sensitivity, lifecycle, customer purchase basket, adoption rates, and purchase criteria

12. Geographic Landscape

12.1 Geographic segmentation

Chart on Market share by geography 2025-2030 (%)
Data Table on Market share by geography 2025-2030 (%)

12.2 Geographic comparison

Chart on Geographic comparison
Data Table on Geographic comparison

12.3 APAC - Market size and forecast 2025-2030

Chart on APAC - Market size and forecast 2025-2030 ($ thousand)
Data Table on APAC - Market size and forecast 2025-2030 ($ thousand)
Chart on APAC - Year-over-year growth 2025-2030 (%)
Data Table on APAC - Year-over-year growth 2025-2030 (%)
Chart on Regional Comparison - APAC
Data Table on Regional Comparison - APAC

12.3.1 China - Market size and forecast 2025-2030

Chart on China - Market size and forecast 2025-2030 ($ thousand)
Data Table on China - Market size and forecast 2025-2030 ($ thousand)
Chart on China - Year-over-year growth 2025-2030 (%)
Data Table on China - Year-over-year growth 2025-2030 (%)

12.3.2 Japan - Market size and forecast 2025-2030

Chart on Japan - Market size and forecast 2025-2030 ($ thousand)
Data Table on Japan - Market size and forecast 2025-2030 ($ thousand)
Chart on Japan - Year-over-year growth 2025-2030 (%)
Data Table on Japan - Year-over-year growth 2025-2030 (%)

12.3.3 India - Market size and forecast 2025-2030

Chart on India - Market size and forecast 2025-2030 ($ thousand)
Data Table on India - Market size and forecast 2025-2030 ($ thousand)
Chart on India - Year-over-year growth 2025-2030 (%)
Data Table on India - Year-over-year growth 2025-2030 (%)

12.3.4 South Korea - Market size and forecast 2025-2030

Chart on South Korea - Market size and forecast 2025-2030 ($ thousand)
Data Table on South Korea - Market size and forecast 2025-2030 ($ thousand)
Chart on South Korea - Year-over-year growth 2025-2030 (%)
Data Table on South Korea - Year-over-year growth 2025-2030 (%)

12.3.5 Australia - Market size and forecast 2025-2030

Chart on Australia - Market size and forecast 2025-2030 ($ thousand)
Data Table on Australia - Market size and forecast 2025-2030 ($ thousand)
Chart on Australia - Year-over-year growth 2025-2030 (%)
Data Table on Australia - Year-over-year growth 2025-2030 (%)

12.3.6 Indonesia - Market size and forecast 2025-2030

Chart on Indonesia - Market size and forecast 2025-2030 ($ thousand)
Data Table on Indonesia - Market size and forecast 2025-2030 ($ thousand)
Chart on Indonesia - Year-over-year growth 2025-2030 (%)
Data Table on Indonesia - Year-over-year growth 2025-2030 (%)

12.4 Europe - Market size and forecast 2025-2030

Chart on Europe - Market size and forecast 2025-2030 ($ thousand)
Data Table on Europe - Market size and forecast 2025-2030 ($ thousand)
Chart on Europe - Year-over-year growth 2025-2030 (%)
Data Table on Europe - Year-over-year growth 2025-2030 (%)
Chart on Regional Comparison - Europe
Data Table on Regional Comparison - Europe

12.4.1 Germany - Market size and forecast 2025-2030

Chart on Germany - Market size and forecast 2025-2030 ($ thousand)
Data Table on Germany - Market size and forecast 2025-2030 ($ thousand)
Chart on Germany - Year-over-year growth 2025-2030 (%)
Data Table on Germany - Year-over-year growth 2025-2030 (%)

12.4.2 UK - Market size and forecast 2025-2030

Chart on UK - Market size and forecast 2025-2030 ($ thousand)
Data Table on UK - Market size and forecast 2025-2030 ($ thousand)
Chart on UK - Year-over-year growth 2025-2030 (%)
Data Table on UK - Year-over-year growth 2025-2030 (%)

12.4.3 France - Market size and forecast 2025-2030

Chart on France - Market size and forecast 2025-2030 ($ thousand)
Data Table on France - Market size and forecast 2025-2030 ($ thousand)
Chart on France - Year-over-year growth 2025-2030 (%)
Data Table on France - Year-over-year growth 2025-2030 (%)

12.4.4 Italy - Market size and forecast 2025-2030

Chart on Italy - Market size and forecast 2025-2030 ($ thousand)
Data Table on Italy - Market size and forecast 2025-2030 ($ thousand)
Chart on Italy - Year-over-year growth 2025-2030 (%)
Data Table on Italy - Year-over-year growth 2025-2030 (%)

12.4.5 The Netherlands - Market size and forecast 2025-2030

Chart on The Netherlands - Market size and forecast 2025-2030 ($ thousand)
Data Table on The Netherlands - Market size and forecast 2025-2030 ($ thousand)
Chart on The Netherlands - Year-over-year growth 2025-2030 (%)
Data Table on The Netherlands - Year-over-year growth 2025-2030 (%)

12.4.6 Spain - Market size and forecast 2025-2030

Chart on Spain - Market size and forecast 2025-2030 ($ thousand)
Data Table on Spain - Market size and forecast 2025-2030 ($ thousand)
Chart on Spain - Year-over-year growth 2025-2030 (%)
Data Table on Spain - Year-over-year growth 2025-2030 (%)

12.5 North America - Market size and forecast 2025-2030

Chart on North America - Market size and forecast 2025-2030 ($ thousand)
Data Table on North America - Market size and forecast 2025-2030 ($ thousand)
Chart on North America - Year-over-year growth 2025-2030 (%)
Data Table on North America - Year-over-year growth 2025-2030 (%)
Chart on Regional Comparison - North America
Data Table on Regional Comparison - North America

12.5.1 US - Market size and forecast 2025-2030

Chart on US - Market size and forecast 2025-2030 ($ thousand)
Data Table on US - Market size and forecast 2025-2030 ($ thousand)
Chart on US - Year-over-year growth 2025-2030 (%)
Data Table on US - Year-over-year growth 2025-2030 (%)

12.5.2 Canada - Market size and forecast 2025-2030

Chart on Canada - Market size and forecast 2025-2030 ($ thousand)
Data Table on Canada - Market size and forecast 2025-2030 ($ thousand)
Chart on Canada - Year-over-year growth 2025-2030 (%)
Data Table on Canada - Year-over-year growth 2025-2030 (%)

12.5.3 Mexico - Market size and forecast 2025-2030

Chart on Mexico - Market size and forecast 2025-2030 ($ thousand)
Data Table on Mexico - Market size and forecast 2025-2030 ($ thousand)
Chart on Mexico - Year-over-year growth 2025-2030 (%)
Data Table on Mexico - Year-over-year growth 2025-2030 (%)

12.6 Middle East and Africa - Market size and forecast 2025-2030

Chart on Middle East and Africa - Market size and forecast 2025-2030 ($ thousand)
Data Table on Middle East and Africa - Market size and forecast 2025-2030 ($ thousand)
Chart on Middle East and Africa - Year-over-year growth 2025-2030 (%)
Data Table on Middle East and Africa - Year-over-year growth 2025-2030 (%)
Chart on Regional Comparison - Middle East and Africa
Data Table on Regional Comparison - Middle East and Africa

12.6.1 Israel - Market size and forecast 2025-2030

Chart on Israel - Market size and forecast 2025-2030 ($ thousand)
Data Table on Israel - Market size and forecast 2025-2030 ($ thousand)
Chart on Israel - Year-over-year growth 2025-2030 (%)
Data Table on Israel - Year-over-year growth 2025-2030 (%)

12.6.2 South Africa - Market size and forecast 2025-2030

Chart on South Africa - Market size and forecast 2025-2030 ($ thousand)
Data Table on South Africa - Market size and forecast 2025-2030 ($ thousand)
Chart on South Africa - Year-over-year growth 2025-2030 (%)
Data Table on South Africa - Year-over-year growth 2025-2030 (%)

12.6.3 Turkey - Market size and forecast 2025-2030

Chart on Turkey - Market size and forecast 2025-2030 ($ thousand)
Data Table on Turkey - Market size and forecast 2025-2030 ($ thousand)
Chart on Turkey - Year-over-year growth 2025-2030 (%)
Data Table on Turkey - Year-over-year growth 2025-2030 (%)

12.6.4 Saudi Arabia - Market size and forecast 2025-2030

Chart on Saudi Arabia - Market size and forecast 2025-2030 ($ thousand)
Data Table on Saudi Arabia - Market size and forecast 2025-2030 ($ thousand)
Chart on Saudi Arabia - Year-over-year growth 2025-2030 (%)
Data Table on Saudi Arabia - Year-over-year growth 2025-2030 (%)

12.6.5 UAE - Market size and forecast 2025-2030

Chart on UAE - Market size and forecast 2025-2030 ($ thousand)
Data Table on UAE - Market size and forecast 2025-2030 ($ thousand)
Chart on UAE - Year-over-year growth 2025-2030 (%)
Data Table on UAE - Year-over-year growth 2025-2030 (%)

12.7 South America - Market size and forecast 2025-2030

Chart on South America - Market size and forecast 2025-2030 ($ thousand)
Data Table on South America - Market size and forecast 2025-2030 ($ thousand)
Chart on South America - Year-over-year growth 2025-2030 (%)
Data Table on South America - Year-over-year growth 2025-2030 (%)
Chart on Regional Comparison - South America
Data Table on Regional Comparison - South America

12.7.1 Brazil - Market size and forecast 2025-2030

Chart on Brazil - Market size and forecast 2025-2030 ($ thousand)
Data Table on Brazil - Market size and forecast 2025-2030 ($ thousand)
Chart on Brazil - Year-over-year growth 2025-2030 (%)
Data Table on Brazil - Year-over-year growth 2025-2030 (%)

12.7.2 Argentina - Market size and forecast 2025-2030

Chart on Argentina - Market size and forecast 2025-2030 ($ thousand)
Data Table on Argentina - Market size and forecast 2025-2030 ($ thousand)
Chart on Argentina - Year-over-year growth 2025-2030 (%)
Data Table on Argentina - Year-over-year growth 2025-2030 (%)

12.7.3 Colombia - Market size and forecast 2025-2030

Chart on Colombia - Market size and forecast 2025-2030 ($ thousand)
Data Table on Colombia - Market size and forecast 2025-2030 ($ thousand)
Chart on Colombia - Year-over-year growth 2025-2030 (%)
Data Table on Colombia - Year-over-year growth 2025-2030 (%)

12.8 Market opportunity by geography

Market opportunity by geography ($ thousand)
Data Tables on Market opportunity by geography ($ thousand)

13. Drivers, Challenges, and Opportunity

13.1 Market drivers

Rapid electrification of automotive sector and expansion of advanced driver assistance systems
Accelerated demand for ultra-fine pitch semiconductor packaging and micro-electronics
Implementation of environmental directives and market shift toward no-clean and water-soluble chemistries

13.2 Market challenges

Raw material price fluctuations and vulnerabilities in global chemical supply chains
Technical difficulties in residue management and risk of electrochemical migration
High compliance overhead associated with stringent environmental, health, and safety regulations

13.3 Impact of drivers and challenges

Impact of drivers and challenges in 2025 and 2030

13.4 Market opportunities

Surging integration of high-reliability low-voiding fluxes in renewable energy
Proliferation of space-grade low-outgassing solder fluxes
Adoption of automated jetting and high-precision micro-dispensing flux technologies

14. Competitive Landscape

14.1 Overview

14.2

Overview on criticality of inputs and factors of differentiation

14.3 Landscape disruption

Overview on factors of disruption

14.4 Industry risks

Impact of key risks on business

15. Competitive Analysis

15.1 Companies profiled

Companies covered

15.2 Company ranking index

15.3 Market positioning of companies

Matrix on companies position and classification

15.4 AIM Solder Pvt. Ltd.

AIM Solder Pvt. Ltd. - Overview
AIM Solder Pvt. Ltd. - Product / Service
AIM Solder Pvt. Ltd. - Key offerings
SWOT

15.5 Henkel Adhesives India Pvt Ltd

Henkel Adhesives India Pvt Ltd - Overview
Henkel Adhesives India Pvt Ltd - Product / Service
Henkel Adhesives India Pvt Ltd - Key offerings
SWOT

15.6 Heraeus Holding GmbH

Heraeus Holding GmbH - Overview
Heraeus Holding GmbH - Product / Service
Heraeus Holding GmbH - Key offerings
SWOT

15.7 Indium Corp.

Indium Corp. - Overview
Indium Corp. - Product / Service
Indium Corp. - Key offerings
SWOT

15.8 Inventec Performance Chemicals

Inventec Performance Chemicals - Overview
Inventec Performance Chemicals - Product / Service
Inventec Performance Chemicals - Key offerings
SWOT

15.9 Johnson Matthey Plc

Johnson Matthey Plc - Overview
Johnson Matthey Plc - Business segments
Johnson Matthey Plc - Key offerings
Johnson Matthey Plc - Segment focus
SWOT

15.10 KOKI Co Ltd.

KOKI Co Ltd. - Overview
KOKI Co Ltd. - Product / Service
KOKI Co Ltd. - Key offerings
SWOT

15.11 MacDermid Alpha Elec. Sol.

MacDermid Alpha Elec. Sol. - Overview
MacDermid Alpha Elec. Sol. - Product / Service
MacDermid Alpha Elec. Sol. - Key offerings
SWOT

15.12 MG Chemicals Ltd.

MG Chemicals Ltd. - Overview
MG Chemicals Ltd. - Product / Service
MG Chemicals Ltd. - Key offerings
SWOT

15.13 Senju Metal Industry

Senju Metal Industry - Overview
Senju Metal Industry - Product / Service
Senju Metal Industry - Key offerings
SWOT

15.14 Shenmao Technology Inc.

Shenmao Technology Inc. - Overview
Shenmao Technology Inc. - Product / Service
Shenmao Technology Inc. - Key offerings
SWOT

15.15 STANNOL GMBH

STANNOL GMBH - Overview
STANNOL GMBH - Product / Service
STANNOL GMBH - Key offerings
SWOT

15.16 Superior Flux

Superior Flux - Overview
Superior Flux - Product / Service
Superior Flux - Key offerings
SWOT

15.17 Tamura Corp.

Tamura Corp. - Overview
Tamura Corp. - Product / Service
Tamura Corp. - Key offerings
SWOT

15.18 The Harris Products Group

The Harris Products Group - Overview
The Harris Products Group - Product / Service
The Harris Products Group - Key offerings
SWOT

16. Appendix

16.1 Scope of the report

Market definition
Objectives
Notes and caveats

16.2 Inclusions and exclusions checklist

Inclusions checklist
Exclusions checklist

16.3 Currency conversion rates for US$

16.4 Research methodology

16.5 Data procurement

Information sources

16.6 Data validation

16.7 Validation techniques employed for market sizing

16.8 Data synthesis

16.9 360 degree market analysis

16.10 List of abbreviations

Research Methodology

Technavio presents a detailed picture of the market by way of study, synthesis, and summation of data from multiple sources. The analysts have presented the various facets of the market with a particular focus on identifying the key industry influencers. The data thus presented is comprehensive, reliable, and the result of extensive research, both primary and secondary.

INFORMATION SOURCES

Primary sources

  • Manufacturers and suppliers
  • Channel partners
  • Industry experts
  • Strategic decision makers

Secondary sources

  • Industry journals and periodicals
  • Government data
  • Financial reports of key industry players
  • Historical data
  • Press releases

DATA ANALYSIS

Data Synthesis

  • Collation of data
  • Estimation of key figures
  • Analysis of derived insights

Data Validation

  • Triangulation with data models
  • Reference against proprietary databases
  • Corroboration with industry experts

REPORT WRITING

Qualitative

  • Market drivers
  • Market challenges
  • Market trends
  • Five forces analysis

Quantitative

  • Market size and forecast
  • Market segmentation
  • Geographical insights
  • Competitive landscape

Interested in this report?

Get your sample now to see our research methodology and insights!

Download Now

Frequently Asked Questions

Solder Flux market growth will increase by USD 88039.0 thousand thousand during 2026-2030.

The Solder Flux market is expected to grow at a CAGR of 6.1% during 2026-2030.

Solder Flux market is segmented by Product type (No-clean flux, Rosin-based flux, Water-soluble flux, Acid flux) End-user (Consumer electronics, Automotive electronics, Telecommunications and data centers, Industrial electronics, Others) Type (Liquid flux, Solid flux, Gel flux)

AIM Solder Pvt. Ltd., Canfield Technologies LLC, Felder GmbH, Henkel Adhesives India Pvt Ltd, Heraeus Holding GmbH, Indium Corp., Interflux Electronics N.V., Inventec Performance Chemicals, Johnson Matthey Plc, KOKI Co Ltd., Kothari Metsol Pvt Ltd, Lucas Milhaupt Inc., MacDermid Alpha Elec. Sol., MG Chemicals Ltd., Senju Metal Industry, Shenmao Technology Inc., STANNOL GMBH, Superior Flux, Tamura Corp., The Harris Products Group are a few of the key vendors in the Solder Flux market.

APAC will register the highest growth rate of 50.3% among the other regions. Therefore, the Solder Flux market in APAC is expected to garner significant business opportunities for the vendors during the forecast period.

China, Japan, India, South Korea, Australia, Indonesia, Germany, UK, France, Italy, The Netherlands, Spain, US, Canada, Mexico, Israel, South Africa, Turkey, Saudi Arabia, UAE, Brazil, Argentina, Colombia

  • Rapid electrification of automotive sector and expansion of advanced driver assistance systems is the driving factor this market.

The Solder Flux market vendors should focus on grabbing business opportunities from the Product type segment as it accounted for the largest market share in the base year.
RIA - Research AI Assistant
Ask RIA
